Bitcoin teases 'seller exhaustion' as BTC price downside reaches $60.3K
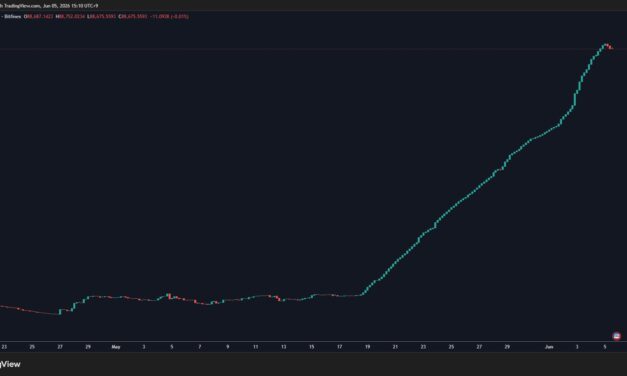
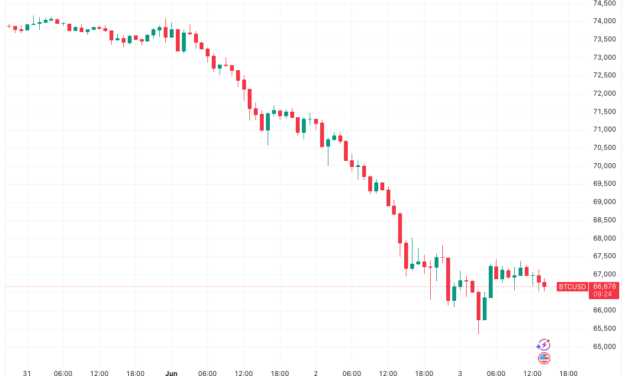
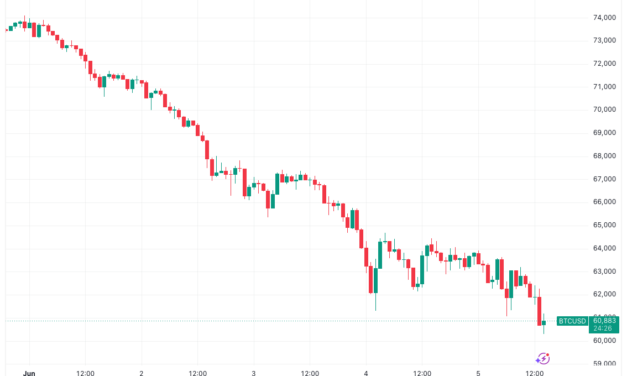
Bitcoin (BTC) extended losses after Friday’s Wall Street open as traders prepared for a retest of $60,000.Key points:Bitcoin begins a battle to protect $60,000 support as sell-side pressure refuses to cool.Analysis sees early signals that “seller exhaustion” is here.US nonfarm payrolls data produce a stronger-than-expected picture of US labor market conditions.Bitcoin battles for $60,000 supportData from TradingView showed daily BTC price downside approaching 5% as sellers stayed in the driving seat.BTC/USD one-hour chart. Source: Cointelegraph/TradingView“Rapidly approaching its February low at $60K. Now in its 6th red daily candle and down more than the entire April/May rally,” trader Daan Crypto Trades noted in a reaction on X. “Really was a case of stairs up elevator down which is something we often see in these larger bear trends. Eyes on that $60K area for now.”BTC/USDT perpetual contract one-day chart. Source: Daan Crypto Trades/XCommentator Expitump referenced the Coinbase Premium, the difference in price between Coinbase’s BTC/USD and Binance’s BTC/USDT pairs and a key yardstick for US demand.“Price is still under controlled selling, but seeing funding getting almost into negative and coinbase discount decreasing,” they summarized in their latest market coverage. “Early signs of seller exhaustion.”Binance Bitcoin futures 30-minute chart with order-book data. Source: Exitpump/XTrader Morin said that BTC/USD was now “frontrunning a key range low” with the key $60,000 mark in sight.“Swept 61.3k internal low but failed to make higher high. Consistent lower highs – > Sellers in Control,” he told X followers. “Wouldn’t be surprised to see 60s traded or even ran through.”BTC/USD 30-minute chart. Source: Morin/Xrisk assetsNonfarm payrolls further reduce Fed rate-cut oddsCrypto bulls were not helped by macro data, with US nonfarm payrolls considerably outpacing expectations to suggest a stronger labor market. Related: Bitcoin needs one more thing to happen to spark BTC price ‘rally:’ AnalysisThe economy added 172,000 jobs in May, more than double the anticipated 85,000.“April’s jobs number was also revised UP by +64,000 jobs. This marks the second strongest US jobs report in 13 months,” trading resource The Kobeissi Letter responded.Fed target rate probabilities (screenshot). Source: CME GroupHigher jobs numbers notionally reduce the need for the Federal Reserve to cut interest rates and provide crypto and risk assets with a liquidity tailwind. Data from CME Group’s FedWatch Tool showed markets pricing in a rate hike before the end of the year.Commenting, trading resource Mosaic Asset Company argued that strong labor-market data would in fact complicate the Fed’s task.“If the payrolls report for the month of May confirms underlying strength in the economy and labor market, the outlook for monetary policy will grow more uncertain given the recent jump in consumer and producer inflation,” it wrote previously in its latest Mosaic Chart Alerts update. “At the same time, evidence of solid economic activity is helping the average stock catch up to the gains in the S&P 500 and Nasdaq.”
Čítaj viac