Autor Cointelegraph By Ray Salmond

XRP price breaks out of range with a 25% rally, but why?

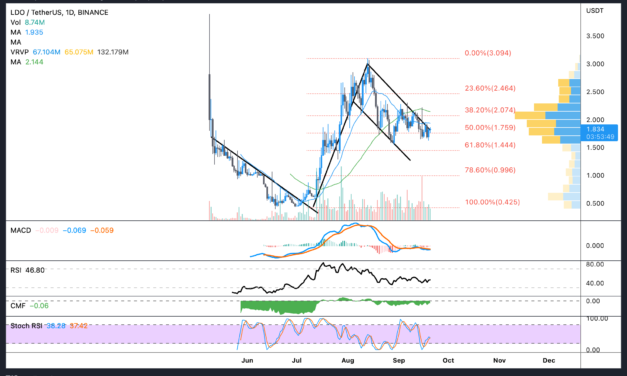
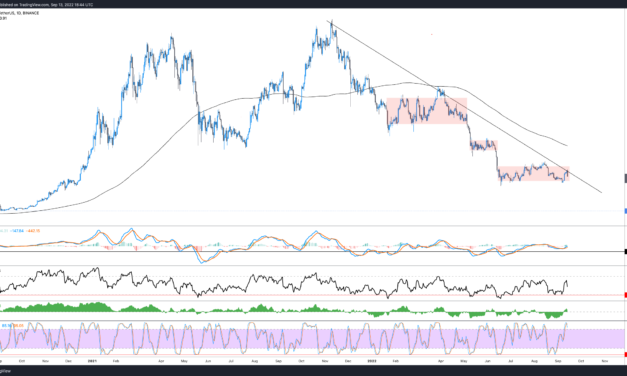
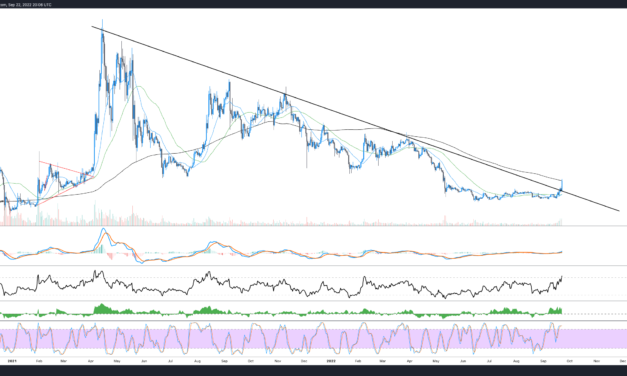
Crypto markets are flashing a bit of green on Sept. 22 as Bitcoin (BTC) price tacked on a 4.7% gain to trade above $19,300 and Ether (ETH) surged 6.5% to recapture the $1,300 level. RSR and Astar Network (ASTAR) also surged by 23% and 17% respectively, but the more notable mover of the day was XRP. Currently, XRP price reflects a near 25% gain and the asset is up 41% in the past month. According to defense lawyer James K. Filan, on Sept. 18, Ripple Labs filed a motion for summary judgment — a legal process that involves the court making a final decision based on the provided facts, rather than ordering a trial — and a decision on whether XRP is a security is expected by mid-December. #XRPCommunity #SECGov v. #Ripple #XRP 1/2 The parties have filed a request that any motions by third-parties to seal portions of the parties’ summary judgment filings be filed subject to the Court’s September 12, 2022 order. pic.twitter.com/J6rbeRXmHi— James K. Filan 113k (beware of imposters) (@FilanLaw) September 19, 2022Excitement over the news could be improving investor sentiment about the longer-term prospects for XRP. Related: Crypto and stocks soften ahead of Fed rate hike, but XRP, ALGO and LDO look ‘interesting’From the perspective of technical analysis, XRP price is looking to secure a second daily close above a longterm descending trendline resistance and trading volumes and open interest on futures contracts have risen sharply in the past 24-hours. XRP/USDT 1-day chart. Source: TradingViewAccording to Cointelegraph market analyst Marcel Pechman: “XRP’s open interest is now at $575 million up from $310 million just a week ago.” Traders who are not yet positioned might consider waiting to see if the 200-day moving average at $0.49 is flipped to support over the next few daily closes. Typically, intraday and swing traders take profit at longer term resistance levels and they also anticipate price rejections and lower support retests after an asset manages a breakout from a period of long consolidation, price bottom or a market structure-altering move. Crypto analytics data provider TheKingfisher drove a similar point by suggesting that buyers would “likely have an opportunity to long XRP lower.”You’ll likely have an opportunity to long $XRP lower if that’s what you’re looking for Don’t FOMO, Long the long liquidations https://t.co/jmaCFVVOvn pic.twitter.com/TP9SW6OmXO— TheKingfisher (@kingfisher_btc) September 22, 2022

The views and opinions expressed here are solely those of the author and do not necessarily reflect the views of Cointelegraph.com. Every investment and trading move involves risk, you should conduct your own research when making a decision.

Čítaj viac

Crypto and stocks soften ahead of Fed rate hike, but XRP, ALGO and LDO look ‘interesting’

Prices remain soft across the market as traders await Federal Reserve Chair Jerome Powell’s statement on the size of the next interest rate hike. At the moment, the market consensus is a 0.75 bps rate hike and a sliver of analysts are banking on 1%. Stocks also appear en-route to close the day in the red, with the Dow down 0.75%, and the S&P 500 and Nasdaq registering a 0.79% and 0.64% loss. Bitcoin continues to fight what appears to be a losing battle at the $19,000 mark, while Ether (ETH) dug a little deeper into its post-Merge dip by making an intra-day low at $1,329. While BTC, Ether and altcoins aren’t making any notable moves that defy the current downtrend, from the perspective of market structure and technical analysis, there are a few interesting developments occurring. Lido (LDO) has corrected alongside Ethereum now that the Merge-trade fervor has subsided, but the asset currently trades in what some would say is a bull flag. While ETH bulls and traders might have taken profits on their long Ether positions, the Merge was a success, stakers and validators still derive yield from the altcoin and the fundamentals that turned investors bullish on Ether remain present. Ideally, if Ether’s DApps and active users continue to expand and traders keep accumulating, then in an otherwise down market, yield should be a capital magnet no? LDO/USDT 1-day chart. Source: TradingViewFrom a market structure point of view Ripple (XRP) looks interesting, and there’s been a ton of social chatter about it on Twitter lately. Following the usual hopium-laced narrative, members of the XRP army have been suggesting that if XRP beats its SEC case and is not deemed a security, the price could “moon.” Of course, solid fundamentals and signs of growth via new address and an in-demand product to market fit should drive investments, but in the absence of that, the market structure does look interesting. XRP/USDT 1-day chart. Source: TradingViewBasically, there’s pre-bull market precedent of a lengthy consolidation phase within a rounding bottom that is somewhat similar to what we can see from the last 137 days. Volumes are kicking up, price broke through a long-term descending trendline that has historically served as resistance and from the perspective of XRP’s HTF market structure, one might conclude that a price bottom has been found. But as a word of caution, hype and expectation tend to trigger volume surges. Regardless of whether the SEC decides that XRP is a security or the opposite, investor excitement could still peter out and the price could simply trade in the same sideways range in perpetuity or until the “next bull market.” Related: Price analysis 9/19: BTC, ETH, BNB, XRP, ADA, SOL, DOGE, DOT, MATIC, SHIBALGO/USDT 2-day chart. Source: TradingViewAlgorand’s (ALGO) market structure also looks interesting. Price fully retraced the complete bull market rally and now trades in the same range as it did in 2019 and 2020. Occasional buy volume pops haven’t been sustained for long enough to clear the $0.40 level, but things could get spicy if a few daily closes above this zone and a test of the 200-MA at $0.48 occurred. If the wider market began to consolidate and ALGO buy volume sustains, flipping this moving average to support could see upside to $0.69, and daily closes above $0.80 would set a significant higher high that would indicate confirmation of a trend reversal. As a disclaimer, these charts simply reflect assets that look “interesting.” Currently, the market is still overwhelmingly bearish and large caps like BTC and ETH have yet to find a bottom. Ultimately, it’s the Federal Reserve that is calling the shots on what happens in risk assets like crypto. So take these snapshots with a grain of salt and proceed with caution. The views and opinions expressed here are solely those of the author and do not necessarily reflect the views of Cointelegraph.com. Every investment and trading move involves risk, you should conduct your own research when making a decision.

Čítaj viac

Bitcoin is trapped in a downtrend, but a ‘trifecta of positives’ scream ‘deep value’

$20,000 is no longer support. $100,000 didn’t happen. The Bitcoin halving is 562 days away.Bears simply refuse to release their vice grip on the market and the Federal Reserve’s policy of interest rate hikes and quantitative tightening is adding fuel to the fire. Despite these challenges, in a Sept. 15 Twitter Space hosted by Cointelegraph, Capriole Fund founder Charles Edwards explained why he is still bullish on Bitcoin. Edwards said that several on-chain metrics suggest that BTC is undervalued: “I see incredible deep value and I kind of call it a trifecta and that we have three positive things happening in my mind. One is cycle timing, where between years two and three, which historically has been where all of the Bitcoin cycles are bottomed. The second is that we’ve hit 90% of normal cycle down draws. Now, obviously, all of these things can go lower, but that alone is a bit of a good value signal. And then thirdly, just the readings across pretty much all on-chain metrics, whether it be Mayer Multiple, whether it be Puell Multiple, or NVT or dormancy, everything is at kind of one in four year level discounts. So for me, it’s kind of that once a cycle opportunity that we see at the moment.”When asked about his thoughts on the previous Bitcoin halving and how the current economic environment might impact the next halving, Edwards said: “I think it was successful because it placed Bitcoin as one of the hardest assets in the world in the midst of massive monetary printing. And we did see a lot of the old school traditional finance, legendary investors, Druckenmiller, etc. kind of get into Bitcoin because of that as it’s kind of a hedge more or less. And that kind of triggered the next 6 to 12 months of rallying. I also think that the crypto industry still does run on the Bitcoin halving cycle kind of time frame. For now. I don’t think they will continue forever, but for now I do still think it holds weight and impact in how people invest in the space. With each subsequent halving the incremental value of the drop in inflation for bitcoin is negligible because it’s already — barring Ethereum — now the hardest asset, or harder than gold.”2022 has proved that risk management and building a balanced portfolio is still a skillset crypto investors are working to develop. Edwards said: “Whatever your method is, however you are trading or investing, whether using stop losses or not as a strategy. You need to do some detailed modeling over as much data as you can and not just two years of data, because that’s how entities have blown up in the past. Do as much as you can, like 10 years of Bitcoin at least, and assume the worst and then add again an element of buffer below that to manage your position sizing.”Tune in and listen to the full episode!Disclaimer. Cointelegraph does not endorse any content of product on this page. While we aim at providing you all important information that we could obtain, readers should do their own research before taking any actions related to the company and carry full responsibility for their decisions, nor this article can be considered as an investment advice.

Čítaj viac

Most of the crypto market is down, but Cosmos (ATOM) price is up — Why?

The Ethereum Merge has finally happened. It’s over, and fortunately it went smoothly without any major hiccups. As predicted by many, the event turned out to be a “buy the rumor sell the news” style event, or perhaps, the hotter-than-expected consumer price index print on Sept. 12 was the real catalyst that pushed the market in its current direction. Regardless of the reasons for this week’s downturn, the Merge is over and in its wake, bulls are left holding a whole lot of nothing. It’s likely that a new bullish narrative will need to emerge, or analysts will need to keep a close eye on smart money to see what assets they elect to rotate into. So now that it’s over, what’s the new narrative? Surge, verge, purge, or splurge? Maybe dirge?— Galois Capital (@Galois_Capital) September 15, 2022Remember, “The Merge,” according to so many “smart” people, was meant to be a bullish event that would possibly send Ether price higher and the treasure trove of hardfork ETH POW tokens was meant to magically materialize multi-billions of dollars in liquidity which would likely inflow to Bitcoin and help the ailing asset to break out of its current range. Well, none of that happened. It’s not to say that it won’t happen, but the current reality is a market painted in a bright shade of red. Bitcoin’s Sept.15 drop below $20,000, induced a market-wide correction resulting in double-digit losses for a majority of altcoins and at the moment, there isn’t an easily graspable story for investors to interpret as bullish.Not everything is dumpingThere does happen to be an outlier, and its name is Cosmos (ATOM). To the surprise of some, it’s one of the few green assets on the charts on Merge day. Currently, the altcoin reflects a 9.4% gain and it has rebounded strongly off its Sept.14 low at $13.19. Previous analysis discussed how ATOM price trades within an ascending channel, riding above the 20-day moving average and suggested that dips to and under the moving average reflected good purchase opportunities. A simple technical analysis of ATOM’s price action would focus on: ATOM price continues to make higher lows and higher highs while trading within the trendlines of an ascending channel.ATOM price saw a brief bull break outside of the channel, tapping the 200-day moving average and then correcting back to the channel midline and 20-MA to confirm each as support. After testing support, price resumed the uptrend and now trades in the top of the current range and is likely to retest the 200-MA in an attempt to flip the level to support. Let’s briefly investigate a few of the possible factors behind ATOM’s bullish momentum. Related: Crypto traders eye ATOM, APE, CHZ and QNT as Bitcoin flashes bottom signsProtocol migration, liquid staking, a rising TVL and the potential of IBCA number of protocols pivoted away from Terra after its implosion and re-launched on the Cosmos Hub SDK. In September, analytics firm and protocol builder Delphi Digital also announced that it had selected Cosmos as its primary blockchain to build new projects on. When projects build on Cosmos Hub, value accrual to ATOM often results because DeFi protocols and other DApps will participate in the network’s interchain security system which works over IBC. Inter-Blockchain Communication protocol (IBC) is basically an “internet of blockchains” and a bridge that allows the cross-chain transfer of tokens and secure interoperability between different blockchains. Typically, the DApps, AMMs and DeFi-style platforms built on blockchains offer staking and the fees generated from this are oftentimes shared among stakers. Staking ATOM currently offers a 17.75% APY and according to Staking Rewards, 66.75% of the available circulating supply is being staked. Cosmos is set to launch liquid staking, a phenomenon which when deployed in other DeFi platforms on other blockchains resulted in increased buy pressure on the ecosystem’s native token(s). Data also shows a steady increase in the number of unique delegation addresses in the network. 7-day increase in unique delegation addresses on Cosmos. Source: Staking RewardsMultiple Cosmos ecosystem platforms, including COMDEX, are set to launch their own stablecoin (CMST), and it is likely that assets locked and staked within the platform will “back” the $1 peg of said stablecoins. Given the structure of the Cosmos Hub and IBC, it seems likely that ATOM will be one of the primary assets used in the “minting” process. Of course, the total value locked (TVL) within the Cosmos ecosystem collapsed as DeFi and the wider crypto market succumbed to the bear trend. This figure has yet to recover in a notable way, but the chart below shows notable inflows in the last 7-days. This will be a figure to keep an eye on, alongside ATOM’s price.Protocols within the Cosmos Hub (ATOM) ecosystem. Source: Defi LlamaAdditional growth metrics that should raise investors eyebrows are Cosmos’ 180-day supply side revenue, protocol revenue and daily trading volumes. Supply side revenue reflects the amount of transaction fees that are allotted to validators while total revenue is the total transaction amount paid by protocol users. Protocol revenue, on the other hand, is the amount of transaction fees that go to protocol, who are holders of ATOM and possibly sharing a portion of this revenue with platform users and stakers. Cosmos circulating market cap and supply side revenue. Source: token terminalCosmos circulating market cap and protocol revenue. Source: token terminalCosmos circulating market cap and ATOM trading volume. Source: token terminalEssentially, what we see is Metcalfe’s law in effect. As the ecosystem grows, the network grows, total value locked increases, liquid staking gives additional utility to staked assets, which also enter a cycle of being purchased, staked, minted to stablecoin or IOUs and then used within the ecosystem to fuel additional growth. The views and opinions expressed here are solely those of the author and do not necessarily reflect the views of Cointelegraph.com. Every investment and trading move involves risk, you should conduct your own research when making a decision.

Čítaj viac

Hot CPI report puts a dent in Bitcoin and Ethereum rally, stocks also lose ground

Crypto and stock markets are feeling the pain after the Sept. 13 inflation report printed an unexpectedly hot figure that showed headline inflation rising by 0.1% month-over-month.Even with gas prices falling to multi-month lows and a cooling housing market, core inflation saw a 0.6% month-over-month bump and year-to-year inflation sits at 8.3%. This chart from @TheTerminal shows why this #CPI number is so disappointing. The contribution of energy has declined, as expected; but services inflation is now rising sharply. Not what the #FOMC will have wanted to see. pic.twitter.com/BsfwFsuyD5— John Authers (@johnauthers) September 13, 2022While market participants and investors had estimated the next Federal Reserve interest hike to be a hefty 0.75 basis points, many also subscribed to a loosely held assumption that Sept. 13’s CPI report would come in softer than projected. Given that the market had supposedly “priced in” a 0.75 bps hike, crypto traders expected Bitcoin (BTC), Ether (ETH) and select altcoins to break out to the upside.Well, obviously the complete opposite occurred. Perma-bull Fed pivot CPI traders REKT. LOL— Big Smokey (@big_smokey1) September 13, 2022

The Dow slid about 2.6%, while the S&P 500 and Nasdaq fell 2.9% and 3.6%, respectively. Naturally, risky assets also fell and Bitcoin price gave up more than 50% of its recent weekend gains with a 9% pullback to $20,350. With just 1 day left before the Merge, Ether price also pulled back 7.29% to $1,590, and the majority of cryptocurrencies in the top 100 are nursing single to double-digit losses at the moment. While Bitcoin’s weekend rally from Sept. 9 extended into the start of this week and the price pushed as high as $22,800, the earlier analysis cautioned that BTC was also trading near a key overhead resistance. As seen below, the multi-month resistance from BTC’s all-time high held as price crumbled at $22,400 when the market opened and the monthly CPI data hit media outlets. The analysis also highlighted the “successive bear flag continuation” trend that has been in play since Bitcoin price topped out at $69,000 on Nov. 10, 2021.BTC/USDT 1-day chart. Source: TradingViewBarring an extremely bullish Merge event, the most likely direction for Bitcoin remains to the downside. A positive point to note is, that despite Sept. 13’s correction, Bitcoin price continues to chop about in its 90-day range (pink box) between $25,400 and $17,600. From my vantage point, there’s “nothing to see here” until the price breaks below $18,500 or the yearly low at $17,600. The views and opinions expressed here are solely those of the author and do not necessarily reflect the views of Cointelegraph.com. Every investment and trading move involves risk, you should conduct your own research when making a decision.

Čítaj viac

Získaj BONUS 8 € v Bitcoinoch

nakup bitcoin z karty

Registrácia Binance

Burza Binance

Aktuálne kurzy