Autor Cointelegraph By Rakesh Upadhyay

Price analysis 12/22: BTC, ETH, BNB, SOL, ADA, XRP, LUNA, AVAX, DOT, DOGE

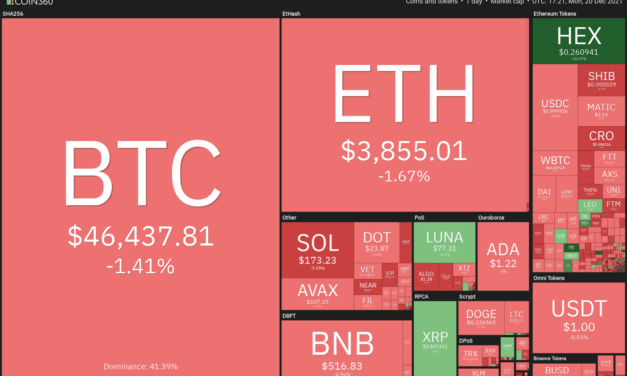
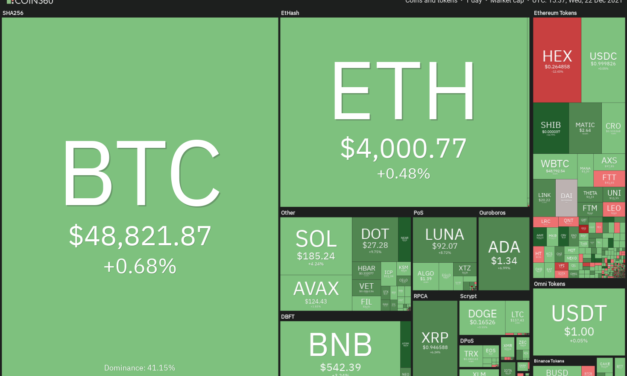
Bitcoin (BTC) is attempting to break above the psychologically critical level at $50,000 and close the year on a strong note. The up-move in Bitcoin has led to a sharp recovery in the value of the Crypto Fear & Greed Index from 27 to 45 within a day, signaling improving sentiment.BlockFi co-founder Flori Marquez said in a recent interview that new talent, regulatory clarity and higher crypto prices could lead to a feeling of FOMO, boosting crypto adoption in 2022. Marquez added that the “majority of Blockfi’s clients—when they receive a BTC reward, they’re not selling that for cash.” Daily cryptocurrency market performance. Source: Coin360In another positive news that could boost crypto adoption further, popular internet browser Opera announced an integration with Polygon (MATIC), expected to go live in the first quarter of 2022. Millions of Opera users, first on the Android platform, and then on other devices, will get access to Polygon’s ecosystem.Could Bitcoin and the major altcoins extend their recovery in the last few days of the year? Let’s study the charts of the top 10 cryptocurrencies to find out.BTC/USDTBitcoin dipped below the 200-day simple moving average (SMA) ($47,259) on Dec. 17 but the bears could not build upon their advantage and extend the decline further. This shows that selling dried up at lower levels.BTC/USDT daily chart. Source: TradingViewThe bulls pushed the price back above the 200-day SMA on Dec. 21 but the recovery is facing resistance at the 20-day exponential moving average (EMA) ($49,517). This indicates that bears have not yet given up and are selling on rallies.If the price turns down from the current level, the bears will again try to sink the price below the 200-day SMA and extend the decline to the strong support zone at $42,000 to $39,600.Conversely, if bulls drive the price above the 20-day EMA, the BTC/USDT pair could rise to $52,000. This level may act as a barrier but if bulls thrust the price above it, the rally could reach the next major hurdle at $60,000.ETH/USDTThe bulls are attempting to push and sustain Ether (ETH) above the descending channel and the 20-day EMA ($4,055). If they succeed, it will suggest that the corrective phase could be over.ETH/USDT daily chart. Source: TradingViewThe buyers will then attempt to propel the price to $4,488 and next to the all-time high at $4,868. A break and close above this resistance will indicate the resumption of the uptrend. The pair could then rally to $5,859.Contrary to this assumption, if the price turns down from the current level, it will suggest that the sentiment remains negative. The bears will then try to pull the price below $3,643.73. If they do that, the ETH/USDT pair could drop to the 200-day SMA ($3,302).BNB/USDTBinance Coin (BNB) has held the $500 psychological support for the past few days, indicating that buyers are defending the level aggressively.BNB/USDT daily chart. Source: TradingViewThe BNB/USDT pair could now rise to the downtrend line where the bears may again mount a strong resistance. If the price turns down from this resistance, it will suggest that the sentiment remains negative and traders are selling on rallies.A break and close below $500 could start the next leg of the down move, which could reach the 200-day SMA ($437).Alternatively, if bulls drive the price above the downtrend line, it will indicate that the correction may be over. The pair could then rise to $617 and later to the overhead resistance at $669.30.SOL/USDTSolana (SOL) has been trading close to the 20-day EMA ($183) for the past few days, indicating that the selling pressure could be reducing.SOL/USDT daily chart. Source: TradingViewThe flattening 20-day EMA and the relative strength index (RSI) just below the midpoint indicate that bulls are making a comeback. A breakout and close above the 20-day EMA could start a stronger recovery to $204.10 and then to $240.Conversely, if the price turns down from the current level and breaks below $167, it will suggest that bears have absorbed the demand. That could clear the path for a drop to $148.04. If this support cracks, the SOL/USDT pair could plummet to the 200-day SMA ($121).ADA/USDT The failure of the bears to pull Cardano (ADA) below $1.18 has resulted in a recovery that has reached the 20-day EMA ($1.35).ADA/USDT daily chart. Source: TradingViewIf the price turns down from the current level, the sellers will again try to sink the ADA/USDT pair below $1.18. If they succeed, the next stop could be $1. The bulls are likely to defend this support aggressively as it has not been breached for the past many months.On the other hand, if bulls push and close the price above the 20-day EMA, it will indicate the start of a sustained recovery. The first hurdle is $1.47 but if bulls push the price above it, the pair could reach the stiff overhead resistance at $1.87. XRP/USDTRipple (XRP) broke and closed above the 20-day EMA ($0.87) on Dec. 20, suggesting that the selling pressure is reducing. The bulls are currently attempting to push the price above the psychological level at $1. XRP/USDT daily chart. Source: TradingViewThe 20-day EMA has started to turn up gradually and the RSI has jumped into the positive territory, indicating that bulls have a slight edge. A break and close above $1 could open the doors for a possible rally to $1.20 and next to $1.41.Conversely, if the price turns down from $1, the XRP/USDT pair could drop to the 20-day EMA. A strong rebound off this level will suggest that the sentiment has turned positive and traders are buying the dips. That will increase the possibility of a break above $1. However, if bears sink the price below $0.85, the pair faces a possible drop to $0.75. LUNA/USDTTerra’s LUNA token broke and closed above the overhead resistance at $78.29 on Dec. 20, indicating the resumption of the uptrend. LUNA/USDT daily chart. Source: TradingViewThe bullish momentum continued and the LUNA/USDT pair soared to $98.20 on Dec. 22. The sharp rally of the past few days has pushed the RSI into the overbought zone and the pair is nearing the psychological mark at $100. This may result in a minor correction or consolidation in the next few days.If the price turns down from the current level but rebounds off $78.29, it will suggest that the sentiment remains bullish and traders are buying on dips. The buyers will then attempt to resume the uptrend, with the next target objective at $124.65.The bears will have to pull and sustain the price below the 20-day EMA ($69.75) to signal a change in the short-term trend.Related: Missed out on hot crypto stocks in 2021? It paid just to buy Bitcoin and Ethereum, data showsAVAX/USDTAvalanche (AVAX) bounced off the 20-day EMA ($104) on Dec. 20, which suggests that the bulls are buying on dips. The up-move rose above the 61.8% Fibonacci retracement level at $119.69 on Dec. 21, indicating that bulls are back in the game.AVAX/USDT daily chart. Source: TradingViewThere is a minor resistance at the $78.60% Fibonacci retracement level at $131.70, which, if cleared, could result in a retest of the all-time high at $147. The bulls will have to push and sustain the price above this level to signal the start of the next leg of the uptrend.The upsloping 20-day EMA and the RSI in the positive zone suggest that bulls have the upper hand. This positive view will invalidate if the price turns down and breaks below the 20-day EMA. Such a move could pull the price to $98. If this level gives way, the next stop could be $75.50.DOT/USDTPolkadot (DOT) has bounced off the strong support zone at $25 to $22.66, which suggests that bulls are defending this zone with vigor.DOT/USDT daily chart. Source: TradingViewThe recovery could first reach the 20-day EMA ($28.21) where the bears are likely to mount a strong defense. If the price turns down from this level, the bears will make one more attempt to pull the price below the support zone.If that happens, the DOT/USDT pair could drop to $16.81. Alternatively, if the price breaks above the 200-day SMA ($28.84), it will suggest that the downtrend is weakening. The pair could first rally to $31.49 and next to $39.35.DOGE/USDTDogecoin (DOGE) bounced off the strong support at $0.15 on Dec. 20, indicating that buyers continue to defend the level with all their might.DOGE/USDT daily chart. Source: TradingViewThe DOGE/USDT pair has reached the 20-day EMA ($0.17), which is acting as a strong resistance. If the price turns down from this level, it could keep the pair stuck between the 20-day EMA and $0.15 for a few days. If this tight range trading resolves to the downside, the pair could slide to $0.13 and a break below this level could result in a decline to $0.10.Conversely, if bulls drive and sustain the price above the 20-day EMA, the pair could rise to $0.19. This level may again act as a stiff resistance but if crossed, the pair could start a strong recovery to $0.22.The views and opinions expressed here are solely those of the author and do not necessarily reflect the views of Cointelegraph. Every investment and trading move involves risk. You should conduct your own research when making a decision.Market data is provided by HitBTC exchange.

Čítaj viac

Price analysis 12/20: BTC, ETH, BNB, SOL, ADA, XRP, LUNA, AVAX, DOT, DOGE

Bitcoin (BTC) continues to lose ground in December, a signal that traders may be locking in their gains before the end of the year. The lack of a Santa rally in the U.S. equity markets indicates that the risk-off sentiment prevails due to the uncertainty regarding the spread of the COVID-19 omicron variant in several parts of the world.Even after the sharp drop in Bitcoin’s price, the demand from institutional investors remains tepid, and data shows that the largest institutional Bitcoin product, the Grayscale Bitcoin Trust (GBTC), is trading at a discount of more than 20%. Daily cryptocurrency market performance. Source: Coin360Veteran trader Peter Brandt said that “high volume panic capitulations” usually signal a bottom in Bitcoin and that has not yet happened during the current decline from the all-time high. This could be a hint that the “real” capitulation is yet to happen.Could Bitcoin and most major altcoins continue their down move in the next few days or will a Santa rally come to the rescue? Let’s study the charts of the top 10 cryptocurrencies to find out.BTC/USDTThe bulls have been defending the 200-day simple moving average (SMA) ($47,130) for the past few days, but they have not been able to push the price above the 20-day exponential moving average (EMA) ($49,622). This shows a lack of demand at higher levels.BTC/USDT daily chart. Source: TradingViewThe bears pulled the price below the 200-day SMA on Dec. 20 and if the price sustains below this crucial level, the selling may pick up momentum.  TheBTC/USDT pair is at risk of hitting the strong support zone at $42,000 to $39,600. The bulls are likely to defend this zone aggressively but the recovery may face a stiff challenge at the 200-day SMA.This negative view could invalidate if the price turns up from the current level and rises above the 20-day EMA. Such a move will suggest that the break below the 200-day SMA could have been a bear trap. The pair could then rise to $52,000 and later attempt a rally to $60,000.ETH/USDTEther (ETH) has been trading inside a descending channel for the past few days. The bounce off the support line of the channel on Dec. 13 failed to rise above the 20-day EMA ($4,058), indicating that bears are selling on rallies. ETH/USDT daily chart. Source: TradingViewThe downsloping 20-day EMA and the relative strength index (RSI) below 43 suggest that the path of least resistance is to the downside. The ETH/USDT pair could slide to $3,643.73 and then to the support line of the channel.A strong rebound off the support line could extend the stay inside the channel for a few more days. The bulls will then make one more attempt to push the price above the channel. If they succeed, it will indicate that the selling pressure may be reducing.Alternatively, if the price breaks below the channel, the bears could challenge the 200-day SMA ($3,288). A break and close below this level could intensify the selling.BNB/USDTThe buyers successfully defended the 100-day SMA ($509) for the past few days but they could not push Binance Coin (BNB) above the 20-day EMA ($552). This suggests that demand dries up at higher levels.BNB/USDT daily chart. Source: TradingViewThe downsloping 20-day EMA and the RSI in the negative zone suggest that bears have the upper hand. If the price breaks and sustains below the 100-day SMA, the BNB/USDT pair could drop to the 200-day SMA ($436).Contrary to this assumption, if the price turns up from the current level and rises above the 20-day EMA, it will suggest that the bulls have absorbed the supply. That could start a recovery to $617 and next to the stiff overhead resistance at $669.30.SOL/USDTSolana (SOL) turned down from the 20-day EMA ($183) on Dec. 19, indicating that bears are defending this level with vigor. If the price slips and sustains below $167.88, a retest of $148.04 is possible.SOL/USDT daily chart. Source: TradingViewThis is an important support to watch out for because a break below it could sink the SOL/USDT pair to the 200-day SMA ($120). The downsloping 20-day EMA and the RSI below 43 suggest that bears are in control.This negative view will invalidate if the price turns up from the current level and breaks above the 20-day EMA. Such a move will suggest that the selling pressure may be reducing. The pair could then attempt a rally to $200 and later to $240.ADA/USDT Cardano (ADA) repeatedly bounced off the strong support at $1.18 in the past few days but the bulls have not been able to push the price above the 20-day EMA ($1.35). This suggests a lack of demand at higher levels. ADA/USDT daily chart. Source: TradingViewThe bears will now attempt to sink and sustain the price below $1.18. If they manage to do that, the ADA/USDT pair could drop to the critical support at $1. The bulls are likely to defend this level aggressively.The first sign of strength will be a break and close above the 20-day EMA. Such a move will indicate that demand exceeds supply. The pair could first rise to $1.47 and then attempt a rally to the overhead resistance at $1.87.XRP/USDTRipple (XRP) has been trading between $0.75 and $0.85 for the past few days. The bulls pushed the price above $0.85 on Dec. 20 but the long wick on the candlestick suggests that bears continue to sell on rallies.XRP/USDT daily chart. Source: TradingViewThe RSI has recovered strongly from the oversold levels, indicating that the bearish momentum may be losing steam. This could keep the XRP/USDT pair stuck inside the range for a few more days.A break and close above $0.85 will indicate that the bulls have overpowered the bears. That could push the price to the psychological mark at $1. Alternatively, a break and close below $0.75 could open the doors for a possible drop to $0.60.LUNA/USDTTerra’s LUNA token soared to a new all-time high on Dec. 20 but the long wick on the day’s candlestick suggests that short-term traders may be booking profits at higher levels. LUNA/USDT daily chart. Source: TradingViewIf the price sustains below $78.29, the bears will attempt to pull the LUNA/USDT pair to the 20-day EMA ($64). This is an important support to keep an eye on because a strong rebound off it will suggest that sentiment remains positive and traders are buying on dips.The bulls will then again try to push the price above the overhead zone at $78.29 to $81.87. If they do that, the pair could start its rally toward the psychological mark at $100. Conversely, if bears pull the price below the 20-day EMA, it will suggest that traders are exiting their positions. That could sink the pair to $50.Related: 0.01% of Bitcoin holders control 27% of all circulating coins: StudyAVAX/USDTAvalanche (AVAX) bounced off the strong support at $75.50 on Dec. 14 and broke above the downtrend line on Dec. 15. This indicated that bulls are attempting to resume the uptrend.AVAX/USDT daily chart. Source: TradingViewHowever, the up-move turned down from the 61.8% Fibonacci retracement level at $119.69, indicating that bears are selling on rallies. The AVAX/USDT pair has reached critical support at the 20-day EMA ($99).If the price rebounds off the current level, the buyers will again attempt to resume the up-move. A break and close above $119.69 could clear the path for a rally to $131.70 and later to the all-time high at $147.Conversely, if the price breaks and sustains below the 20-day EMA, the pair could drift down to the strong support at $75.50.DOT/USDTPolkadot (DOT) has been trading below the 200-day SMA ($28.82) for the past few days. This suggests that bears are in command. The sellers are currently attempting to sink the price below the strong support zone at $25 to $22.66.DOT/USDT daily chart. Source: TradingViewIf they manage to do that, the DOT/USDT pair could extend its downward journey toward the next support at $16.81. The longer the price stays below the 200-day SMA, the greater the possibility of the continuation of the downtrend.Contrary to this assumption, if the price rebounds off the current zone, the bulls will make one more attempt to push the pair above the 200-day SMA. If they succeed, it will suggest that the bears are losing their grip. The pair could then rise toward $39.35. DOGE/USDTDogecoin (DOGE) rebounded off the strong support at $0.15 on Dec. 14 and soared above the 20-day EMA ($0.18) but the long wick on the candlestick shows that traders sold at higher levels.DOGE/USDT daily chart. Source: TradingViewThe bears pulled the price back below the 20-day EMA on Dec. 15. This could have trapped the aggressive bulls who may have then been forced to liquidate their position. This has pulled the price to the strong support at $0.15.A break and close below this level could pull the price to the Dec. 4 low at $0.13. If this support cracks, the DOGE/USDT pair could drop to the psychological level at $0.10. Conversely, if the price rebounds off the current level, the bulls will again attempt to clear the overhead hurdle at the 20-day EMA and $0.19.The views and opinions expressed here are solely those of the author and do not necessarily reflect the views of Cointelegraph. Every investment and trading move involves risk. You should conduct your own research when making a decision.Market data is provided by HitBTC exchange.

Čítaj viac

Price analysis 12/6: BTC, ETH, BNB, SOL, ADA, XRP, DOT, DOGE, LUNA, AVAX

Bitcoin (BTC) is attempting to extend its recovery by rising above the psychological mark at $50,000, but several popular analysts believe that BTC could remain range-bound for a few weeks or even months.On-chain analytics firm CryptoQuant said that Bitcoin “whales are still depositing BTC to exchanges.” This simply indicates that whales are setting themselves up to react at short notice depending on which path the price elects to take.Daily cryptocurrency market performance. Source: Coin360The sharp correction of the past few days has pulled the Crypto Fear and Greed Index to 16, which indicates a sentiment of “extreme fear.” Some believe the current fall looks similar to the March 2020 crash.However, CoinCorner CEO Danny Scott said that Bitcoin’s fall was due to the liquidation of positions by gamblers and not because of sentiment. According to him, the sentiment is “still very bullish.”After the most receshakeout, could Bitcoin start a strong recovery and lead crypto markets higher? Let’s study the charts of the top-10 cryptocurrencies to find out.BTC/USDTBitcoin broke below the uptrend line and the psychological support at $50,000, which may have resulted in panic selling by traders. Although bulls purchased the dip aggressively, they are finding it difficult to push the price above $50,000.BTC/USDT daily chart. Source: TradingViewThe downsloping 20-day exponential moving average ($55,551) and the relative strength index (RSI) near the oversold zone indicate that bears are in command. The sellers will attempt to flip the uptrend line into resistance. If that happens, the bears will again try to sink the BTC/USDT pair to the strong support zone at $42,000 to $39,600.Alternatively, if bulls push the price above the uptrend line, the pair could rally to the 20-day EMA. This is an important level to watch out for because a break and close above it will be the first sign that bears may be losing their grip. The pair could then rally to the overhead resistance at $61,000.ETH/USDTEther (ETH) plummeted below the 100-day simple moving average ($3,873) on Dec. 4 but the bears could not sustain the lower levels. This suggests that traders are accumulating on dips.ETH/USDT daily chart. Source: TradingViewThe recovery attempt is facing stiff resistance near $4,250. The bears again attempted to pull the price below the $3,900 support today but the long tail on the candlestick suggests that bulls are defending the level.If buyers push and sustain the price above the 20-day EMA ($4,315), the ETH/USDT pair could rise to the overhead resistance at $4,868. A break and close above this resistance will indicate the resumption of the uptrend.On the contrary, if the price turns down from the 20-day EMA, the bears will make one more attempt to sink and sustain the pair below the 100-day SMA. If they succeed, the pair could drop to $3,400.BNB/USDTBinance Coin (BNB) broke and closed below the 20-day EMA ($592) on Dec. 3. That was followed by a sharp sell-off on Dec. 4 which pulled the price to the 100-day SMA ($496).BNB/USDT daily chart. Source: TradingViewThe buyers aggressively defended the 100-day SMA as seen from the long tail on the day’s candlestick. The recovery could reach the 20-day EMA where the bears are likely to mount a strong resistance.If the price turns down from the overhead resistance, the BNB/USDT pair could remain stuck between the moving averages.A break and close above the 20-day EMA could clear the path for an up-move to the overhead resistance zone at $669.30 to $691.80. This positive view will be negated on a drop below the 100-day SMA. The pair could then drop to $435.30.SOL/USDTSolana (SOL) turned down and re-entered the triangle on Dec. 3. This could have trapped the aggressive bulls who bought the breakout of the triangle on Dec. 1 and 2. SOL/USDT daily chart. Source: TradingViewThe selling picked up momentum after the SOL/USDT pair broke and closed below the 20-day EMA ($209). The bears pulled the price below the support line of the triangle and the 100-day SMA ($181) on Dec. 4.Although bulls purchased this dip and again defended the 100-day SMA on Dec. 5, they could not build upon the recovery. The bears pounced on this opportunity and are currently attempting to sink the price below the 100-day SMA. If they manage to do that, the pair could drop to the strong support zone at $120 to $140.ADA/USDT Cardano (ADA) turned down from the 20-day EMA ($1.63) on Dec. 3, indicating that sentiment remains negative and traders are selling on rallies.ADA/USDT daily chart. Source: TradingViewThe selling intensified on Dec. 4 and the ADA/USDT pair plunged to $1.18. Although bulls purchased this dip, they could not sustain the recovery. This indicates that demand dries up at higher levels.If bears sink the price below $1.18, the pair could plummet to the strong support at $1 where buyers are expected to defend the level with all their might. A break and close above the 20-day EMA will be the first sign that the bears may be losing their grip.XRP/USDTXRP broke below the strong support at $0.85 on Dec. 4 and fell to an intraday low at $0.60. Aggressive buying at lower levels helped stage a strong recovery as seen from the long tail on the day’s candlestick.XRP/USDT daily chart. Source: TradingViewThe buyers attempted to push the price above $0.85 on Dec. 5 but failed. This suggests that the level has flipped into resistance. The bears will now again try to resume the down move and sink the XRP/USDT pair to $0.60.The RSI has dropped into the oversold territory, indicating that the pair could witness a consolidation or a relief rally in the next few days.If bulls drive the price above $0.85, the pair may rally to the 20-day EMA ($0.97) where bears may again pose a stiff challenge. A break and close above this level will suggest that the sellers may be losing their grip.DOT/USDTPolkadot (DOT) plummeted below the strong support at $32.21 on Dec. 4 and dropped to the next critical level at $25. Although bulls defended this support, the weak rebound suggests a lack of aggressive buying at higher levels. DOT/USDT daily chart. Source: TradingViewThe price turned down on Dec. 5 and the bears are again attempting to pull the DOT/USDT pair below the strong support at $25. If they succeed, the pair could drop to $22.50 and later to $20.On the other hand, if the price rebounds off the current level, it will suggest that buyers are defending this level with all their might. The pair could then rise to the 20-day EMA ($36).If the price turns down from this level, it will indicate that sentiment remains negative and traders are selling on rallies. The bulls will have to push and sustain the price above the 20-day EMA to indicate a possible change in trend.Related: Grayscale finds that over 25% of US households surveyed currently own BitcoinDOGE/USDTDogecoin (DOGE) plunged below the critical support at $0.15 on Dec. 4 but bulls purchased this dip as seen from the long tail on the candlestick. The failure of the buyers to push the price to the overhead resistance at $0.19 indicates a lack of demand at higher levels.DOGE/USDT daily chart. Source: TradingViewThe bears are trying to pull the price back below $0.15 today. If this support is breached, the selling could intensify and the DOGE/USDT pair could drop to $0.13 and then to the psychological support at $0.10.Conversely, if the price rebounds off the current level, it will suggest that bulls are defending the $0.15 support aggressively. The pair could then rise to the overhead resistance at $0.19. A break and close above this level and the 20-day EMA ($0.20) will signal a possible trend change.LUNA/USDTTerra’s LUNA token was hugely volatile on Dec. 4 but the strong closing on the day shows that bulls came on top. However, the buyers could not keep up the momentum, resulting in profit-booking on Dec. 5.LUNA/USDT daily chart. Source: TradingViewThe bears are trying to pull the price back into the ascending channel today but the bulls are likely to defend this level with vigor. The upsloping 20-day EMA ($55) and the RSI in the positive zone indicate advantage to buyers.If the price rebounds off the current level, the bulls will attempt to thrust the price above the all-time high at $78.29 and resume the uptrend. The LUNA/USDT pair could then rally to $90.This positive view will invalidate if bears pull the price below the 20-day EMA. That could open the doors for a possible decline to the support line of the channel.AVAX/USDTAvalanche (AVAX) turned down sharply on Dec. 4 and plunged to the strong support at $81. The bulls purchased this dip but the weak bounce indicates a lack of demand at higher levels.AVAX/USDT daily chart. Source: TradingViewThe bears again attempted to sink and sustain the price below the strong support at $81 and the 100-day SMA ($73) today but the rebound suggests that bulls are accumulating on dips. The AVAX/USDT could rise to the 20-day EMA ($104) where the bears are expected to mount a strong resistance. A break and close above the 20-day EMA and the downtrend line will signal a possible change in trend.Conversely, if the price turns down from the current level or the 20-day EMA, it will suggest that bears continue to sell on rallies. That could pull the pair to the 100-day SMA.The views and opinions expressed here are solely those of the author and do not necessarily reflect the views of Cointelegraph. Every investment and trading move involves risk. You should conduct your own research when making a decision.Market data is provided by HitBTC exchange.

Čítaj viac

Top 5 cryptocurrencies to watch this week: BTC, ETH, MATIC, ALGO, EGLD

Bitcoin (BTC) and most altcoins sold off on Dec. 4 with massive deleveraging seen in the crypto derivatives markets. Data suggests more than $2.5 billion of crypto liquidations over a 24-hour period.During the recent fall, Ether (ETH) has continued to outperform Bitcoin. While Bitcoin’s market dominance has dropped below 41%, Ether has continued to gain ground and its market dominance has risen above 21%.Crypto market data daily view. Source: Coin360Some analysts believe that Bitcoin’s recent decline could result in a lengthy phase of consolidation. Decentrader co-founder filbfilb expects Bitcoin to consolidate well into the first quarter of the next year. Lex Moskovski, CIO of Moskovski Capital, also expects “a slow grind up.”Could Bitcoin hit a bottom within the next few days? Let’s analyze the charts of the top-5 cryptocurrencies that could lead the markets higher.BTC/USDTBitcoin had taken strong support at the 100-day simple moving average ($54,496) in end-September, making this an important support for the bulls to defend.BTC/USDT daily chart. Source: TradingViewHowever, the bears had other plans. They pulled the price below the 100-day SMA on Dec. 3 which may have triggered several stop losses. That resulted in panic selling and the BTC/USDT pair plunged to $42,000 on Dec. 4. The bulls bought this decline with vigor as seen from the long tail on the day’s candlestick.The downsloping 20-day exponential moving average ($56,219) and the relative strength index (RSI) near the oversold zone suggest that bears have the upper hand. If the pair continues lower from the current levels, the next stop could be the strong support at $40,000. Conversely, if the price turns up from the current level, the pair could rise to the 100-day SMA, which may act as a strong hurdle. A break and close above this level will be the first sign that a stronger recovery is possible.BTC/USDT 4-hour chart. Source: TradingViewThe pair has been trading inside a descending channel pattern. The bears pulled the price below the support line of the channel but bulls purchased this dip and pushed the pair back into the channel.If bulls successfully defend the support line, the pair could rise to the 20-EMA. This level is again expected to act as a strong resistance. If the price turns down from the 20-EMA, it will signal that sentiment remains negative. That may increase the likelihood of a break below the channel.If that happens, the pair could drop to the strong support zone at $42,000 to $40,000. Conversely, a break and close above the 20-EMA will be the first sign that sellers may be losing their grip. The pair could then rise to the resistance line of the channel.ETH/USDTEther (ETH) has been range-bound between $4,868 and $3,900 for the past few days. Although bears pulled the price below the range on Dec. 4, they could not sustain the lower levels. The bulls bought this dip aggressively as seen from the long tail on the day’s candlestick.ETH/USDT daily chart. Source: TradingViewIf bulls sustain the price above $3,900, the ETH/USDT pair could rise to the 20-day EMA ($4,326). A break and close above this level could clear the path for a possible rally to the all-time high at $4,868. The bulls will have to overcome this barrier to signal the resumption of the uptrend.Contrary to this assumption, if the price turns down from the current level, the bears will make one more attempt to sink and sustain the pair below $3,900. If they succeed, the pair could plummet to the strong support at $3,400.ETH/USDT 4-hour chart. Source: TradingViewThe pair’s rebound is facing stiff resistance near the 61.8% Fibonacci retracement level at $4,215.12. The 20-EMA is sloping down and the RSI is in the negative territory, indicating a minor advantage to the bears.If the price breaks the $4,000 support, the pair could drop to $3,823.98. A break and close below this level could result in a retest of $3,503.68.Conversely, if bulls drive the price above the moving averages, the pair could rise to $4,654.88 and then challenge the all-time high.MATIC/USDTPolygon (MATIC) has been trading inside an ascending channel pattern for the past several days. The bulls pushed the price above the resistance line of the channel on Dec. 3 but could not sustain the higher levels. This may have prompted profit-booking on Dec. 4.MATIC/USDT daily chart. Source: TradingViewThe MATIC/USDT pair plunged to the 100-day SMA ($1.54) but buyers stepped in and bought this dip. However, the long wick on today’s candlestick indicates that bears are selling near the resistance line.The 20-day EMA ($1.85) is sloping up and the RSI is in the positive zone, signaling advantage to buyers. If the current rebound sustains, the bulls will again attempt to thrust the price above the resistance line.Alternatively, a break and close below the 50-day SMA ($1.76) could pull the price to the 100-day SMA.MATIC/USDT 4-hour chart. Source: TradingViewThe pair’s recovery is facing selling at the 78.6% Fibonacci retracement level at $2.21. If bears sink the price below the 20-EMA, the pair could decline to the 50-SMA and then to the 100-SMA. A break below this support could open the doors for a decline to $1.54.Conversely, if the price rebounds off the 20-EMA, the bulls will again try to thrust the pair above $2.21. If they manage to do that, the pair could rally to $2.40. The bulls will have to clear this overhead hurdle to thrust the pair to the all-time high at $2.70.Related: Bitmart hacked for $200M following Ethereum, Binance Smart Chain exploitALGO/USDTAlgorand (ALGO) plunged below the critical support at $1.50 on Dec. 4 but the bulls bought the dip aggressively as seen from the long tail on the candlestick. The bulls will now try to push the price above the moving averages.ALGO/USDT daily chart. Source: TradingViewIf they do that, the ALGO/USDT pair could rise to the resistance line. This is an important level for the bears to defend because a break above it could invalidate the descending triangle pattern. The pair could then rise to $2.36 and later to $2.55.Contrary to this assumption, if the price turns down from the moving averages, it will indicate that bears are selling on rallies. The pair could then retest the support at $1.50. A break and close below this level will complete the bearish setup. The pair could then drop to $0.80.ALGO/USDT 4-hour chart. Source: TradingViewThe pair has been trading between $1.60 and $2 for some time. The bears pulled the price below $1.60 but could not sustain the lower levels. This suggests aggressive buying on dips. The bulls have pushed the price back into the range.If buyers drive the price above the moving averages, the pair could rally to the overhead resistance at $2. On the other hand, if the price turns down from the moving averages, the bears will again try to sink and sustain the pair below $1.60. If they manage to do that, a retest of $1.32 is likely.EGLD/USDTThe sharp rally in Elrond (EGLD) from $287 on Nov. 17 to the all-time high at $544.25 on Nov. 31 pushed the RSI deep into the overbought zone. Vertical rallies are generally followed by waterfall declines and that is what happened in the past few days. EGLD/USDT daily chart. Source: TradingViewThe EGLD/USDT pair turned down from the all-time high and plunged to $224.62 on Dec. 4, completing a 100% retracement of the latest leg of the rally.A minor positive is that bulls purchased the lows on Dec. 4 as seen from the long tail on the day’s candlestick. The buyers are currently attempting to defend the uptrend line and push the price back above the 50-day SMA ($324).If they manage to do that, the pair could rise to the 20-day EMA ($364) where bears may again mount a stiff resistance. If bulls overcome this hurdle, the pair could rally to $425.Conversely, if the price dips and closes below the 100-day SMA ($271), the pair could extend its slide to $200.EGLD/USDT 4-hour chart. Source: TradingViewSharp selling pulled the price below the uptrend line but the bears could not sustain the lower levels. This indicates strong accumulation on dips. The pair quickly climbed back above the uptrend line but the bulls could not clear the barrier at the 20-EMA.This indicates that sentiment remains negative and traders are selling on rallies. If the price sustains below the uptrend line, the next stop could be $224.62.On the contrary, if the price turns up from the current level and breaks above the 20-EMA, it will indicate that the bears may be losing their grip. The pair could then start a recovery, which may reach the 50-SMA. A break and close above this resistance could clear the path for a possible rally to the $425 to $440 resistance zone.The views and opinions expressed here are solely those of the author and do not necessarily reflect the views of Cointelegraph. Every investment and trading move involves risk, you should conduct your own research when making a decision.

Čítaj viac

Price analysis 12/3: BTC, ETH, BNB, SOL, ADA, XRP, DOT, DOGE, LUNA, AVAX

Bitcoin (BTC) and Ether (ETH) have turned down from their respective overhead resistance levels, suggesting that bears continue to sell on rallies.New research in Australia suggests that the Ethereum Improvement Proposal (EIP) 1559 upgrade has turned Ether into a better store of value than Bitcoin. The report said the annual rate of increase in Ether’s supply since EIP-1559 is 0.98% compared to an increase of 1.99% in Bitcoin’s supply.Demand for Ether has been on the rise following the surging popularity of nonfungible tokens, decentralized finance and Metaverse-related altcoins. Several analysts remain bullish on Ether and anticipate it to rally to the range between $6,000 and $10,000.Daily cryptocurrency market performance. Source: Coin360On-chain analytics firm Glassnode said that high open interest in the derivatives market and long-term holders selling could extend Bitcoin’s decline. The “open interest leverage in options and futures at or new all-time high” could result in a shakeout.Could Bitcoin’s correction pull the entire crypto sector lower? Let’s study the charts of the top 10 cryptocurrencies to find out.BTC/USDTThe bulls could not sustain Bitcoin’s price above the 20-day exponential moving average (EMA) ($57,905) on Nov. 30 and Dec. 1. This suggests that bears are defending the 20-day EMA with vigor.BTC/USDT daily chart. Source: TradingViewThe bears will now attempt to sink and sustain the price below the 100-day simple moving average (SMA) ($54,485) and the Nov. 28 intraday low at $53,256.64. If they succeed, the BTC/USDT pair could plummet to the psychologically critical support at $50,000.This is an important support to keep an eye on because if it breaks down, the selling could pick up momentum and the pair could drop to $40,000. The downsloping 20-day EMA and the relative strength index (RSI) in the negative zone suggest the path of least resistance is to the downside.Contrary to this assumption, if the price rebounds off the 100-day SMA and rises above the 20-day EMA, it will indicate accumulation at lower levels. The pair could then rise to the 50-day SMA ($60,750).ETH/USDTEther turned down from $4,778.75 on Dec. 1, indicating that bears are aggressively defending the all-time high at $4,868. The price pulled back to the 50-day SMA ($4,319) on Dec. 3.ETH/USDT daily chart. Source: TradingViewIf the price rebounds off the current level, it will suggest that the sentiment remains positive and traders are buying on dips. The bulls will then make one more attempt to propel the price above $4,868.If they succeed, the ETH/USDT pair could resume its uptrend, with the next target objective at $5,796. Conversely, if the price breaks below the 50-day SMA, it will indicate that traders may be rushing to the exit. The pair could then decline to the strong support at $3,900.BNB/USDTThe bulls again attempted to push Binance Coin (BNB) above the overhead resistance at $669.30 on Dec. 1 but failed. This suggests that bears continue to pose a stiff challenge at higher levels.BNB/USDT daily chart. Source: TradingViewThe 20-day EMA ($602) has flattened out and the RSI is near the midpoint, indicating a possible range-bound action in the near term.If the price breaks below the 20-day EMA, the BNB/USDT pair could drop to the 50-day SMA ($564). This is an important level for the bulls to defend because a break below it could pull the price down to the 100-day SMA ($494).On the contrary, if the price rises from the current level or the 50-day SMA, the bulls will attempt to push the pair above the $669.30 to $691.80 resistance zone. SOL/USDTSolana (SOL) broke and closed above the resistance line of the symmetrical triangle on Dec. 1 but the bulls could not sustain the higher levels. The bears pulled the price back into the triangle on Dec. 3.SOL/USDT daily chart. Source: TradingViewIf the price rebounds off the 20-day EMA ($215), the bulls will make one more attempt to start the up-move by pushing the SOL/USDT pair above the overhead resistance at $243.12. Contrary to this assumption, if the price breaks below the 50-day SMA ($210), it will suggest that the recent breakout above the resistance line may have been a bull trap. The bears will then try to sink the price below the support line of the triangle.A break and close below the 100-day SMA ($178) could start a deeper correction that may reach $140.ADA/USDT Cardano (ADA) recovered sharply on Dec. 2 but hit a wall at the 20-day EMA ($1.72). The failure of the bulls to clear the overhead hurdle may have attracted heavy selling by the bears.ADA/USDT daily chart. Source: TradingViewThe sellers will now attempt to sink the price to the strong support zone at $1.50 to $1.41. This is an important support for the bears to defend because if it cracks, the selling could accelerate and the ADA/USDT pair may start its downward journey to $1.Contrary to this assumption, if the price turns up from the support zone, it will indicate buying at lower levels. The bulls will then make one more attempt to propel the price above the 20-day EMA. If that happens, the pair could rally to the 50-day SMA ($1.94).XRP/USDTRipple’s (XRP) failure to break and sustain above the psychological level at $1 indicates that bears are aggressively selling on minor rallies. The price has turned down and the bears will now try to pull the price to the strong support at $0.85.XRP/USDT daily chart. Source: TradingViewThe downsloping 20-day EMA ($1.02) and the RSI below 37 indicate that sellers are in control. If bears sink and sustain the price below $0.85, the XRP/USDT pair could plummet to the next support at $0.70.On the other hand, if the price turns up from the current level or the $0.85 support and breaks above the 20-day EMA, it will suggest that the selling pressure may be reducing. The pair could then rise to the 50-day SMA ($1.09). DOT/USDTPolkadot (DOT) turned down from the breakdown level of the H&S pattern at $38.70 on Nov. 30 and broke below the 100-day SMA ($37). The bears will now attempt to pull the price to the strong support at $32.21. DOT/USDT daily chart. Source: TradingViewIf this level cracks, the selling could intensify and the DOT/USDT pair could plummet to the next support at $26. The downsloping 20-day EMA ($39) and the RSI in the negative territory suggest that bears have the upper hand.Conversely, if the price turns up from the current level and breaks above the 20-day EMA, it will indicate that the markets have rejected the lower levels. That may trap several aggressive bears, resulting in a short covering. The pair could then rise to the 50-day SMA ($43) and later to $47.50.Related: NFT music platforms to disrupt Spotify in 2022, Saxo Bank predictsDOGE/USDTThe bulls repeatedly failed to push Dogecoin (DOGE) above the 20-day EMA ($0.22) in the past few days, suggesting that sentiment remains negative and bears are selling on rallies.DOGE/USDT daily chart. Source: TradingViewThe 20-day EMA is sloping down and the RSI is below 36, indicating that the path of least resistance is to the downside. If bears sink the price below $0.19, the DOGE/USDT pair could drop to the critical support at $0.15.On the other hand, if the price turns up from the current level or rebounds off $0.19 and breaks above the 20-day EMA, it will indicate strong accumulation at lower levels. The pair could then rally to the 50-day SMA ($0.24).LUNA/USDTTerra’s LUNA token broke above the moving averages on Nov. 28 and picked up momentum. Strong buying by the bulls pushed the price to a new all-time high on Nov. 30, indicating the resumption of the uptrend.LUNA/USDT daily chart. Source: TradingViewThe failure of the bears to stall the up-move at the resistance line indicates aggressive buying by the bulls. If the price sustains above the channel, the LUNA/USDT pair could rally to $85.07.On the contrary, if the price turns down and plummets back into the channel, it will suggest that traders are booking profits at higher levels. The pair could then decline to the 20-day EMA ($51).If the price rebounds off this level, it will suggest that sentiment remains positive while a break below the 20-day EMA could pull the price down to the support line of the channel.AVAX/USDTAvalanche (AVAX) turned down from the 61.8% Fibonacci retracement level at $129.26 on Dec. 1. This may have prompted profit-booking from traders, which pulled the price below the 20-day EMA ($109) on Dec. 2.AVAX/USDT daily chart. Source: TradingViewThe flattening 20-day EMA and the RSI near the midpoint suggest a balance between supply and demand. If bulls push and sustain the price back above the 20-day EMA, the AVAX/USDT pair could rally to $129.26. A break and close above this level could open the doors for a possible retest of the all-time high at $147.Alternatively, if the price fails to sustain above the 20-day EMA, it will suggest that traders are selling on minor rallies. The bears will then attempt to sink the price below the psychological support at $100. If that happens, the pair could decline to the 50-day SMA ($87).The views and opinions expressed here are solely those of the author and do not necessarily reflect the views of Cointelegraph. Every investment and trading move involves risk. You should conduct your own research when making a decision.Market data is provided by HitBTC exchange.

Čítaj viac

Získaj BONUS 8 € v Bitcoinoch

nakup bitcoin z karty

Registrácia Binance

Burza Binance

Aktuálne kurzy