Autor Cointelegraph By Rakesh Upadhyay

Price analysis 12/31: BTC, ETH, BNB, SOL, ADA, XRP, LUNA, AVAX, DOT, DOGE

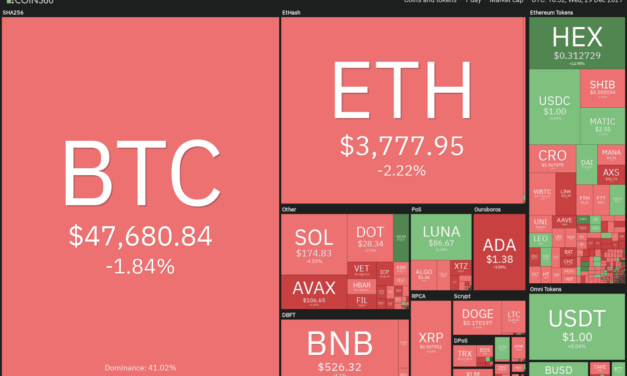
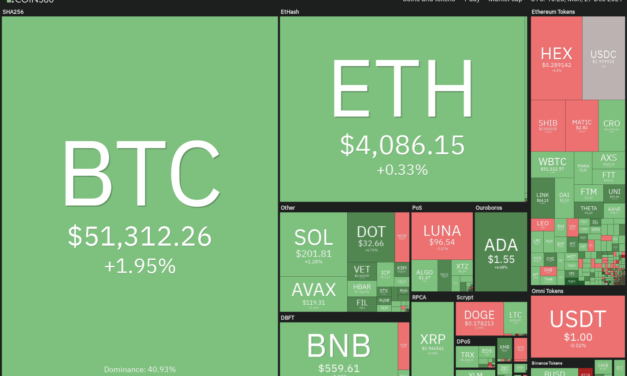
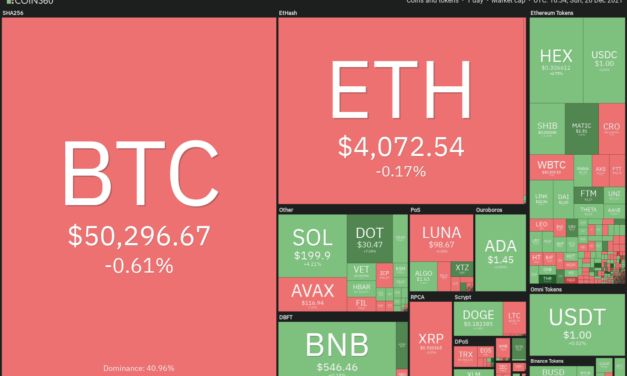
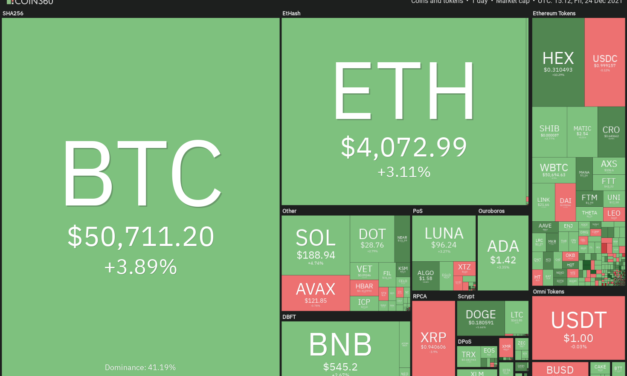
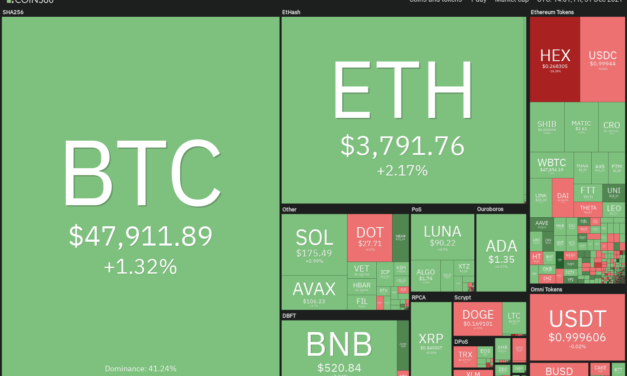
Bitcoin (BTC) and most major altcoins are attempting a rebound off their respective support levels, indicating that buyers continue to accumulate on dips.Data from Coinglass shows that 9,925 Bitcoin left Coinbase Pro, the professional trading arm of Coinbase, on Dec. 30, a possible sign of institutional buying. This is in sharp contrast to the strong inflows seen in Binance and OKEx. Several analysts believe that institutional buying could pick up in January.Economist and trader Alex Krüger expects a Bitcoin rally in early January based on fund flows. He also highlighted that January has produced positive results for Bitcoin between 2018 and 2021, with gains ranging from 7% to 36%. Daily cryptocurrency market performance. Source: Coin360While investors debate about the next possible direction of the crypto markets, MicroStrategy has continued to accumulate Bitcoin on dips. The business intelligence firm purchased 1,914 Bitcoin between Dec. 9 and Dec. 29, according to a filing with the U.S. Securities and Exchange Commission. The recent purchase has boosted the company’s holdings to 124,391 Bitcoin.Could Bitcoin lead a strong recovery in the crypto markets in the new year? Let’s study the charts of the top-10 cryptocurrencies to find out.BTC/USDTBitcoin bounced off the $45,456 support and has risen above the 200-day simple moving average (SMA) ($47,826). However, the bulls are likely to face a strong challenge at the 20-day exponential moving average (EMA) ($49,096).BTC/USDT daily chart. Source: TradingViewIf the price turns down from the current level or the 20-day EMA, it will suggest that bears are selling on every minor rally. That will increase the possibility of a break below $45,456. If that happens, the BTC/USDT pair could drop to the strong support zone at $42,000 to $40,000.The relative strength index (RSI) is forming a possible positive divergence, which suggests that the selling pressure could be reducing.If bulls drive the price above the 20-day EMA, the pair could rally to $51,936.33. A break and close above this resistance could start an up-move to the 50% Fibonacci retracement level at $55,000 and then to the 61.8% retracement level at $58,686.ETH/USDTEther (ETH) has bounced off the strong support zone at $3,643.73 to $3,503.68. The bulls will now try to push the price to the 20-day EMA ($3,952), which is an important level to watch out for.ETH/USDT daily chart. Source: TradingViewIf the price turns down from the 20-day EMA, it will suggest that the sentiment remains negative and traders are selling on rallies. The bears will then make another attempt to sink the price below the support zone.A break and close below the 200-day SMA ($3,365) may indicate the start of a deeper correction to $2,800. This negative view will be negated if the price breaks and sustains above $4,200. The ETH/USDT pair could then rise to $4,488 and later to $4,868.BNB/USDTBinance Coin (BNB) is attempting a bounce off the strong support at $500. The recovery is likely to face selling at the 20-day EMA ($540). If the price turns down from this level, it will suggest that the sentiment remains negative and traders are selling on rallies.BNB/USDT daily chart. Source: TradingViewThe downsloping 20-day EMA and the RSI in the negative territory indicate that bears are in command. A break and close below $500 could intensify selling and the BNB/USDT pair could drop to the 200-day SMA ($445). Contrary to this assumption, if the price rises above the 20-day EMA, the bulls will try to push the pair above $575. If they succeed, the pair could rally to $617 and later to the overhead resistance zone at $669.30 to $691.80.SOL/USDTSolana (SOL) is attempting to bounce off $167.88. The relief rally is likely to face strong selling at the 20-day EMA ($182). The RSI is in the negative zone and the 20-day EMA is sloping down gradually, indicating that bears are at an advantage.SOL/USDT daily chart. Source: TradingViewIf the price turns down and dips below the $167.88 support, the SOL/USDT pair could drop to $148.04. The bulls may try to defend this level but if the support gives way, the pair could start its downward journey toward the 200-day SMA ($128).This negative view will invalidate if bulls push the price above the 20-day EMA and the overhead resistance at $204.75. The pair could then rise to the resistance line of the falling wedge pattern. A break and close above this level could clear the path for a retest of the all-time high at $259.90.ADA/USDT Cardano (ADA) broke and closed below the 20-day EMA ($1.38) on Dec. 29 but the buyers have not yet given up. They are attempting to push the price back above the 20-day EMA.ADA/USDT daily chart. Source: TradingViewIf they succeed, the ADA/USDT pair could rise to the resistance line of the descending channel. The bears are likely to defend this level aggressively. If the price turns down from the resistance line, the pair could extend its stay inside the channel for a few more days.A break and close above the channel will be the first indication of a possible change in trend. Conversely, if the price turns down from the current level, the pair could drop to $1.18. This is an important level to watch out for because if it cracks, the pair could drop to $1. XRP/USDTRipple (XRP) is range-bound between $1 and $0.75. The price bounced off $0.80 on Dec. 30 and the bulls will now attempt to push the price back above the 20-day EMA ($0.88).XRP/USDT daily chart. Source: TradingViewIf they do that, the XRP/USDT pair could rise to the 200-day SMA ($0.94) and then to the overhead resistance at $1. The bulls will have to push and sustain the price above this resistance to signal the start of a sustained recovery.The 20-day EMA is turning down and the RSI is below 45, indicating that bears have the upper hand. If the price turns down from the 20-day EMA, the bears will try to sink the pair below $0.75. A close below this level could clear the path for a decline to $0.60.LUNA/USDTTerra’s LUNA token bounced off the 20-day EMA ($81) on Dec. 30, indicating that the sentiment remains positive and traders are buying on dips.LUNA/USDT daily chart. Source: TradingViewThe bulls will now attempt to push the price to the all-time high at $103.60. A break and close above this resistance will signal the start of the next leg of the uptrend that could reach $135.26 and then $150.On the other hand, if the price turns down from $93.81 and breaks below the 20-day EMA, it will suggest that traders are closing their positions on rallies. The LUNA/USDT pair could then drop to the 61.8% Fibonacci retracement level at $71.61.Related: Frax Share, Swipe and Gnosis lead the altcoin market as Bitcoin recovers to $47.5kAVAX/USDTAvalanche (AVAX) bounced off the minor support at $98 on Dec. 30 and the bulls are now attempting to push the price above the 20-day EMA ($107).AVAX/USDT daily chart. Source: TradingViewIf they succeed, the AVAX/USDT pair could rise to the downtrend line where the bears may mount stiff resistance. A break and close above this level will be the first sign that the correction may be over.The pair could then rise to $128. If bulls thrust the price above this resistance, it will complete a bullish inverse head and shoulders pattern. The pair could first retest the all-time high at $147 and then attempt a rally to the pattern target at $177.50.On the contrary, if the price turns down from the 20-day EMA and breaks below $98, the pair could drop to $75.50.DOT/USDTPolkadot (DOT) broke below the 20-day EMA ($28) on Dec. 28 and the bears have successfully warded off attempts by the bulls to push the price back above the moving averages.DOT/USDT daily chart. Source: TradingViewIf the price turns down from the current level, the bears will try to sink the DOT/USDT pair below the $25 to $22.66 support zone. If that happens, the selling could pick up momentum and the decline could extend to $16.81.Alternatively, if the price rises above the moving averages, the buyers will try to propel the pair above $31.49. If they manage to do that, it could open the doors for a possible rally to $39.50 and later to $43.56.DOGE/USDTDogecoin (DOGE) broke below the 20-day EMA ($0.17) on Dec. 28 but the bears could not challenge the major support at $0.15. This suggests that selling dries up at lower levels.DOGE/USDT daily chart. Source: TradingViewThe bulls are attempting to push the price back above the 20-day EMA. If they manage to do that, the DOGE/USDT pair could rally to the overhead resistance at $0.19. A break and close above this level will signal the possible start of a new up-move that could reach the 200-day SMA ($0.23).Conversely, if the price turns down from the 20-day EMA, the bears will attempt to sink the pair below $0.15. This is an important level for the bulls to defend because if it cracks, the pair could plunge to $0.13 and eventually to the psychological support at $0.10. The views and opinions expressed here are solely those of the author and do not necessarily reflect the views of Cointelegraph. Every investment and trading move involves risk. You should conduct your own research when making a decision.Market data is provided by HitBTC exchange.

Čítaj viac

Price analysis 12/29: BTC, ETH, BNB, SOL, ADA, XRP, LUNA, AVAX, DOT, DOGE

The S&P 500 is trading near its all-time high but Bitcoin (BTC) has plunged about 30% from its all-time high at $69,000. Even after the sharp drop, Bitcoin is up 63%, year-to-date, outperforming the S&P 500, which is up about 30% in 2021.Gold, which is popular as a hedge against inflation, is down roughly 7% this year. Arcane research said in its report that Bitcoin’s outperformance in the high inflationary environment shows that “Bitcoin has proven itself to be an excellent inflation hedge.”Daily cryptocurrency market performance. Source: Coin360Real Vision CEO Raoul Pal said in an interview with Vlad from The Stakeborg Talks that the recent selling in Bitcoin may have been due to institutional investors booking profits but he believes the selling may be coming to an end.However, veteran trader Peter Brandt is of the opinion that panic selling has not yet happened, which is known to signal bottoms.Could Bitcoin extend its decline or stage a strong recovery above $50,000 in the next few days? Let’s study the charts of the top 10 cryptocurrencies to find out.BTC/USDTBitcoin rose above the overhead resistance at $51,936.33 on Dec. 27 but the long wick on the candlestick shows that traders sold this rise with vigor. The selling continued on Dec. 28 and the price broke below the 20-day exponential moving average (EMA) ($49,558).BTC/USDT daily chart. Source: TradingViewThe price broke below the 200-day simple moving average (SMA) ($47,755) on Dec. 29 but the long tail on the candlestick shows that bulls are attempting to arrest the decline. If the price rises and sustains above the 200-day SMA, the bulls will again try to push the BTC/USDT pair toward the overhead resistance at $51,936.33.On the contrary, if the price sustains below the 200-day EMA, the selling could intensify. The 20-day EMA has started to turn down and the relative strength index (RSI) is below 42, indicating that bears are in control. If the $45,456 support cracks, the pair could plunge to the strong support zone at $42,000 to $40,000.ETH/USDTEther’s (ETH) failure to sustain above the 20-day EMA ($4,011) could have attracted selling from short-term traders. The price turned down sharply on Dec. 28 and has dropped close to the strong support at $3,643.73.ETH/USDT daily chart. Source: TradingViewIf the price rebounds off the support, the bulls will make one more attempt to push the ETH/USDT pair above the 20-day EMA. A break and close above $4,200 could signal that the corrective phase may be over. The pair could first rally to $4,488 and then challenge the all-time high at $4,868.However, the downsloping 20-day EMA and the RSI in the negative zone indicate that the path of least resistance is to the downside. If the $3,643.73 support cracks, the pair could decline to the 200-day SMA ($3,353). This level may act as a strong support but if it cracks, the pair could plummet to $2,800.BNB/USDTBinance Coin (BNB) soared above the 20-day EMA ($546) on Dec. 27 but the bulls could not sustain the higher levels. The price turned down and dipped below the 20-day EMA on Dec. 28.BNB/USDT daily chart. Source: TradingViewThe bears will now try to sink the price below the strong support at $500. If they succeed, it could start a down move to the 200-day SMA ($444) where bulls are likely to defend the level aggressively.Contrary to this assumption, if the price turns up from the current level or the strong support at $500, it will suggest that bulls continue to buy on dips. A break and close above $575 will signal that the correction may be over. The pair could first rally to $617 and then to the overhead resistance zone at $669.30 to $691.80.SOL/USDTSolana’s (SOL) recovery stalled at $204.75 on Dec. 27 and the price broke below the 20-day EMA ($185) on Dec. 28. This suggests that bears continue to sell on rallies.SOL/USDT daily chart. Source: TradingViewThe bears will now attempt to build on their advantage and pull the price below $167.88. If this support cracks, the SOL/USDT pair could drop to $148.04. The 20-day EMA is flattish but the RSI has dipped below 44, indicating that bears are attempting to gain the upper hand.This negative view will invalidate in the short term if the price turns up from the current level and rises above $204.75. That will clear the path for a possible rally to the resistance line of the falling wedge pattern. A breakout of the wedge will signal that bulls are back in the driver’s seat.ADA/USDT Cardano (ADA) turned down from $1.59 on Dec. 27 and the price has dipped to the 20-day EMA ($1.39). If the price rebounds off the current level, the bulls will attempt to push the price to the resistance line of the descending channel.ADA/USDT daily chart. Source: TradingViewThe flattish 20-day EMA and the RSI near the midpoint suggest a balance between supply and demand. A break and close above the channel will indicate that the downtrend could be over. The bulls will then try to push the price toward the strong overhead resistance at $2.47. On the other hand, if the price sustains below the 20-day EMA, it will suggest that bears continue to sell on rallies. The ADA/USDT pair could then drop to the strong support zone at $1.18. If this support cracks, the pair could decline to $1.XRP/USDTThe failure of the bulls to push Ripple (XRP) back above the 50-day SMA ($0.94) on Dec. 27 may have attracted selling by short-term traders. That pulled the price below the 20-day EMA ($0.89) and the support at $0.85. XRP/USDT daily chart. Source: TradingViewThe 20-day EMA has turned down and the RSI has dipped into the negative zone, indicating that bears are at a minor advantage. If the price sustains below $0.85, the XRP/USDT pair could decline to the strong support at $0.74.Conversely, if the price turns up from the current level and breaks above the moving averages, it will suggest that lower levels are attracting strong buying from the bulls. The pair may then rise to $1. A break and close above this level could complete an inverse head and shoulders pattern, which has a pattern target at $1.25.LUNA/USDTTerra’s LUNA token turned down from $103.60 on Dec. 27 and the price dipped to the 38.2% Fibonacci retracement level at $83.83. The bulls are likely to attempt to stall the correction in the zone between $83.83 and the 20-day EMA ($80).LUNA/USDT daily chart. Source: TradingViewA strong rebound off this zone will suggest that sentiment remains bullish and traders are not waiting for a deep correction to buy. The bulls will then attempt to push the price to $103.60. A break and close above this resistance could indicate the resumption of the uptrend. The first target on the upside is $135.26 and then $150.This positive view will be negated in the short term if the price turns down and plummets below the 20-day EMA. That could pull the price down to the 61.8% Fibonacci retracement level at $71.61. Related: A fair comparison? Ethereum growth outpaces Bitcoin in 2021AVAX/USDTAvalanche’s (AVAX) bounce off the 20-day EMA ($108) on Dec. 26 fizzled out at $120.96 on Dec. 27. This suggests that bears continue to sell at higher levels. AVAX/USDT daily chart. Source: TradingViewThe AVAX/USDT pair turned down and broke below the 20-day EMA on Dec. 28. If bears sustain the price below this level, the next stop could be $98. A break and close below this support could open the gates for a possible drop to $75.50.Conversely, if bulls push the price back above the 20-day EMA, the pair could rally to the downtrend line. A break and close above this resistance will suggest that the correction may be over. The pair could first rise to $130 and then retest the all-time high at $147.DOT/USDTThe bulls pushed Polkadot (DOT) above the overhead resistance at $31.49 on Dec. 27 but the long wick on the candlestick suggests selling at higher levels.DOT/USDT daily chart. Source: TradingViewThe failed breakout could have acted like a bull trap, catching aggressive buyers on the wrong foot. This may have resulted in long liquidation, pulling the price below the moving averages. Both moving averages are flat and the RSI is just below the midpoint, indicating a balance between supply and demand.If bulls push the price back above the moving averages, the pair could rally to $31.49. A break and close above this level could signal advantage to buyers. The pair could then rally to $39.35 and later to $43.56.On the other hand, a break and close below the $25 to $22.66 support zone will indicate that bears are in command.DOGE/USDTDogecoin (DOGE) turned down from the overhead resistance at $0.19 and plunged back below the 20-day EMA ($0.18) on Dec. 28. This suggests that bears continue to defend the overhead resistance level.DOGE/USDT daily chart. Source: TradingViewThe DOGE/USDT pair could now drop to $0.15, which is a key level for the bulls to defend. If the price rebounds off this support, the pair could remain stuck between $0.15 and $0.19 for the next few days.The bulls will have to push and sustain the price above $0.19 to indicate the start of a strong relief rally.On the contrary, if bears sink and sustain the price below $0.15, it will suggest that the downtrend has resumed. The pair could then drop to $0.13 and later to the psychological support at $0.10. The views and opinions expressed here are solely those of the author and do not necessarily reflect the views of Cointelegraph. Every investment and trading move involves risk. You should conduct your own research when making a decision.Market data is provided by HitBTC exchange.

Čítaj viac

Price analysis 12/27: BTC, ETH, BNB, SOL, ADA, XRP, LUNA, AVAX, DOT, DOGE

Bitcoin (BTC) and most major altcoins have bounced off their immediate support levels, indicating that the sentiment is improving and traders are buying on minor dips.Billionaire and Mexico’s third-richest person Ricardo Salinas Pliego said in his Christmas and New Year message to stay away from fiat money, terming it as “fake money made of paper lies.” Instead, he advised people to “invest in Bitcoin.”Veteran trader Peter Brandt warned that “chart pattern breakouts should be viewed with great suspicion” during the thinly traded holiday period in the last half of December.Daily cryptocurrency market performance. Source: Coin360Analysts remain bullish for 2022. Crypto analyst and pseudonymous Twitter user DecodeJar believes that Bitcoin could surpass $100,000 and reach the conservative price target at $190,000.Could Bitcoin continue its recovery in the next few days and pull altcoins higher? Let’s study the charts of the top 10 cryptocurrencies to find out.BTC/USDTBitcoin successfully held the 20-day exponential moving average (EMA) ($50,033) for the past three days, signaling that bulls are buying on dips. This is likely to attract further buying from the bulls.BTC/USDT daily chart. Source: TradingViewThe 20-day EMA has started to turn up and the relative strength index (RSI) has risen into the positive zone, indicating that bulls are at an advantage. If buyers propel the price above the 38.2% Fibonacci retracement level at $52,314, the prospects of a rally to the stiff overhead resistance at $60,000 increase. The bears are likely to defend this level with vigor.This bullish view will be negated if the price turns down from the current level or the overhead resistance and breaks below the moving averages. That could pull the BTC/USDT pair to the strong support at $45,456.ETH/USDTEther (ETH) broke and closed above the 20-day EMA ($4,065) on Dec. 23 but the bulls have not been able to build upon this advantage. This suggests that the bears have not yet given up and are selling on rallies.ETH/USDT daily chart. Source: TradingViewThe flat 20-day EMA and the RSI near the midpoint indicate a balance between supply and demand. The bullish momentum could pick up if bulls propel and sustain the price above the overhead resistance at $4,200. This could clear the path for a possible rally to $4,488, followed by a retest of the all-time high at $4,868.On the contrary, if the price turns down from the current level and breaks below $3,893.23, it will suggest that bears have gained the upper hand. That could pull the ETH/USDT pair to $3,643.73 and then to the 200-day simple moving average (SMA) ($3,339).BNB/USDTAfter trading close to the 20-day EMA ($549) for the past three days, Binance Coin (BNB) has climbed above the resistance on Dec. 27.BNB/USDT daily chart. Source: TradingViewThe 20-day EMA is flat and the RSI is just above the midpoint, suggesting a status of equilibrium between the bulls and the bears. If the price sustains above the 20-day EMA, it will indicate that bulls have overpowered the bears.The BNB/USDT pair could first rally to $575 and then rise to $617. Alternatively, if the price turns down from the current level, the bears will attempt to pull the pair to $500. This is an important support for the bulls to defend because if it cracks, the decline could extend to the 200-day SMA ($442).SOL/USDTSolana (SOL) broke and closed above the 20-day EMA ($187) on Dec. 23, indicating that the correction may be ending. The bears tried to pull the price back below the 20-day EMA on Dec. 24 but the bulls did not relent.SOL/USDT daily chart. Source: TradingViewThis may have attracted further buying by traders. The SOL/USDT pair could now rise to the resistance line of the falling wedge pattern where the bears are likely to mount stiff resistance. If the price turns down from the resistance line but rebounds off the 20-day EMA, it will suggest that bulls are buying on every minor dip. That will increase the possibility of a break above the wedge, opening the doors for a retest of $259.90.Conversely, if the price turns down and breaks below the 20-day EMA, the pair could slide to $167.88. A break below this support may sink the pair to the 200-day SMA ($125). ADA/USDT The bulls successfully defended the 20-day EMA ($1.39) for the past three days. This indicates that the sentiment has turned positive and traders are buying on dips. Cardano (ADA) resumed its recovery on Dec. 27.ADA/USDT daily chart. Source: TradingViewThe RSI has risen above 58 and the 20-day EMA has started to turn up, indicating that bulls are attempting a comeback. The ADA/USDT pair could rise to $1.76 and then to the stiff overhead resistance at $1.87. This bullish view will invalidate if the price turns down from the current level and breaks below the 20-day EMA. Such a move will suggest that bears are selling on rallies. The bears will then attempt to pull the pair below $1.18. If they do that, the pair could drop to $1.XRP/USDTRipple (XRP) turned down from the psychological resistance at $1 on Dec. 24, indicating that bears are active at higher levels. The sellers pulled the price to the 20-day EMA ($0.90) but a minor positive is that bulls have held this level for the past three days.XRP/USDT daily chart. Source: TradingViewThe price is currently stuck between the moving averages. If buyers push the price above the 200-day SMA ($0.94), the XRP/USDT pair could rally to $1. A breakout and close above this level could complete an inverse head and shoulders pattern, which could open the doors for a possible rally to $1.25.On the contrary, if the price breaks and sustains below the 20-day EMA, the pair could drop to $0.85. If this level also cracks, the decline could reach the critical support at $0.75. A strong rebound off this level could keep the pair range-bound between $0.75 and $1 for a few more days.LUNA/USDTThe bulls repeatedly pushed Terra’s LUNA token above the $100 resistance in the past three days but they have not been able to sustain the higher levels. This suggests that the bears continue to defend this level aggressively.LUNA/USDT daily chart. Source: TradingViewThe LUNA/USDT pair could now correct to the 38.2% Fibonacci retracement level at $83.83 and then to the 50% retracement level at $77.72. This zone is likely to act as strong support. If the price rebounds off this zone, it will suggest that the trend remains bullish and traders are buying on dips. The bulls will then again attempt to push the price above the all-time high at $103.60. If they manage to do that, the pair could rally to $124.65 and then to $150. This positive view will invalidate if the price turns down and breaks below the 61.8% Fibonacci retracement level at $71.61.Related: Bitcoin rises above $51K as the dollar flexes muscles against the euroAVAX/USDTAvalanche (AVAX) once again bounced off the 20-day EMA ($109) on Dec. 26 indicating that bulls are buying on dips. The rising 20-day EMA and the RSI above 57 indicate that bulls have the upper hand.AVAX/USDT daily chart. Source: TradingViewIf the price sustains above the 20-day EMA, the bulls will attempt to clear the overhead resistance zone between the 61.8% Fibonacci retracement level at $119.69 and the 78.6% retracement level at $131.70. If they succeed, the AVAX/USDT pair could rise to the all-time high at $147. On the contrary, if the price turns down from the current level or the overhead zone and plummets below the 20-day EMA, it will suggest that traders are booking profits at higher levels. The pair could then drop to $98 where buyers may attempt to stall the decline.DOT/USDTThe bulls successfully defended the 20-day EMA ($28.91) on Dec. 24 and 25, indicating that the sentiment has turned positive and traders are buying on dips. Sustained buying pushed Polkadot (DOT) above the overhead resistance at $31.49 on Dec. 27.DOT/USDT daily chart. Source: TradingViewThe 20-day EMA has started to turn up gradually and the RSI has jumped into the positive territory, indicating that bulls are in command.If buyers sustain the price above $31.49, the bullish momentum could pick up further and the DOT/USDT pair could start a new up-move. The first target on the upside is $39.35 and if this level is crossed, the next stop could be $43.56.Contrary to this assumption, if the price turns down and breaks below the moving averages, the pair could drop to the strong support zone at $25 to $22.66.DOGE/USDTDogecoin (DOGE) has been trading between the 20-day EMA ($0.18) and the overhead resistance at $0.19 for the past three days. This suggests that both bulls and bears are playing it safe and not making large bets.DOGE/USDT daily chart. Source: TradingViewA break and close above $0.19 will signal that bulls have absorbed the supply. That could start a recovery to $0.22 and if this level is crossed, the DOGE/USDT pair could reach the 200-day SMA ($0.23).The bulls will have to clear this hurdle to signal the start of a sustained up-move. Alternatively, if the price turns down and breaks below the 20-day EMA, it will suggest an advantage to bears. The pair could then slide to the strong support at $0.15. The views and opinions expressed here are solely those of the author and do not necessarily reflect the views of Cointelegraph. Every investment and trading move involves risk. You should conduct your own research when making a decision.Market data is provided by HitBTC exchange.

Čítaj viac

Top 5 cryptocurrencies to watch this week: BTC, MATIC, NEAR, ATOM, HNT

After staying above $50,000 on Christmas day, Bitcoin (BTC) faced selling pressure on Dec. 26. One of the reasons for the possible dip in Bitcoin’s price is the increase in inflows to the Binance exchange. Data analysis account Material Scientist said that Binance’s inflows could be due to “a new player.” Although Bitcoin is almost certain to miss PlanB’s floor model price projection of $135,000 for December, the creator of the stock-to-flow price model remains bullish. He said that Bitcoin’s price at $51,000 remains within one standard deviation of the model, which keeps the forecast of $135,000 for this halving cycle in play.Crypto market data daily view. Source: Coin360Several asset managers have added Bitcoin to their portfolio in 2021 but UK’s ex-Chancellor Lord Hammond warned retail investors to be “extremely cautious” while investing in cryptocurrencies. He said that “it’s almost certainly not suitable for retail investors as a mainstream investment category.”Let’s study the charts of the top-5 cryptocurrencies that may lead the recovery in the crypto sector in the next few days.BTC/USDTBitcoin broke above the 20-day exponential moving average ($49,832) on Dec. 23 but the recovery hit a roadblock at the 38.2% Fibonacci retracement level at $52,314. This indicates that bears have not yet given up and continue to sell on rallies.BTC/USDT daily chart. Source: TradingViewThe BTC/USDT pair formed a Doji candlestick pattern on Dec. 24, indicating uncertainty among the bulls and the bears. This indecision resolved to the downside on Dec. 25 and the price has slipped to the 20-day EMA. The relative strength index (RSI) is just below the midpoint and the 20-day EMA is flattish, indicating a balance between supply and demand.If the price rebounds off the current level and breaks above $52,314, it will suggest that the sentiment has turned positive and traders are viewing the dips as a buying opportunity. The pair could then rise to the 50% retracement level at $55,500 and later to the 61.8% retracement level at $58,686.Conversely, if bears pull the price below the 20-day EMA, the pair could drop to the 200-day simple moving average ($47,569) and then to $45,456. A break and close below this level could open the doors for a possible drop to $42,000.BTC/USDT 4-hour chart. Source: TradingViewThe pair is attempting to form a cup and handle formation which will complete on a breakout and close above the overhead resistance at $51,936.33. This reversal setup has a target objective at $58,313.81.This positive view will invalidate if the price turns down from the current level and breaks below $49,600. That could pull the price down to $47,920.42. If this support also cracks, the decline could extend to $45,558.85.MATIC/USDTPolygon (MATIC) has been in a strong uptrend. Although bears posed a stiff challenge at $2.70, the bulls did not give up much ground and have pushed the price to a new all-time high today.MATIC/USDT daily chart. Source: TradingViewIf bulls sustain MATIC price above $2.70, the MATIC/USDT pair could start the next leg of the uptrend. The pair could first rise to $3.41 and if this level is crossed, the up-move may reach the psychological mark at $5.The upsloping 20-day EMA ($2.30) and the RSI in the positive territory suggest that bulls are in control. If the price turns down and breaks below the 20-day EMA, it will suggest that the current breakout was a bull trap. The pair could then drop to $2 and later to $1.73.MATIC/USDT 4-hour chart. Source: TradingViewAfter struggling to break out and sustain above $2.70 on three occasions, the bulls have finally managed to overcome the resistance. However, the bears are unlikely to give up easily and will again try to stall the up-move at the resistance line of the ascending channel.If the price turns down from the current level and breaks below the 20-EMA, the pair could drop to $2.42. This is an important support for the bulls to defend because if it cracks, the pair could plunge toward the 200-SMA. On the contrary, if bulls drive and sustain the price above the channel, the bullish momentum could pick up further.NEAR/USDTNEAR Protocol’s NEAR token picked up momentum after breaking above the falling wedge pattern on Dec. 23. This carried the price above the strong resistance at $13.23, signaling the resumption of the uptrend.NEAR/USDT daily chart. Source: TradingViewThe bears are unwilling to allow the bulls to have their way and are aggressively defending the $16 level. The NEAR/USDT pair formed an inside-day candlestick pattern on Dec. 25, indicating indecision among the bulls and the bears.If the price breaks below $14, the pair could drop to $13.23 and then to the 20-day EMA ($11.11). A strong rebound off either level will suggest that the sentiment remains positive and traders are buying on dips. If bulls drive the price above $15.93, the pair could rise to $17.95. This bullish view will be negated if bears sink and sustain the price below the 20-day EMA.NEAR/USDT 4-hour chart. Source: TradingViewThe 4-hour chart shows that the pair is consolidating between $14.20 and $15.93, which is a positive sign. The 20-EMA is sloping up and the RSI is in the positive zone, suggesting that bulls have the upper hand.If buyers drive the price above $15.93, the pair could resume the uptrend. On the other hand, if the price breaks below the 20-EMA, the pair could drop to $13.23. This level is likely to act as strong support but if it cracks, the next stop could be $11.50.Related: Binance Turkey fined 8M lira for non-compliance against money launderingATOM/USDTCosmos (ATOM) broke out and closed above the resistance line of the descending channel on Dec. 25, indicating that the downtrend may be over.ATOM/USDT daily chart. Source: TradingViewThe 20-day EMA ($25.91) has started to turn up and the RSI has risen into the positive territory, indicating that bulls have the upper hand. If buyers sustain the price above the channel, the ATOM/USDT pair could rise to $33.60 and thereafter to $38.If the price turns down from the current level or the overhead resistance and breaks below the 20-day EMA, it will suggest that traders continue to sell on rallies. The pair could then drop to the 200-day SMA ($24.12).ATOM/USDT 4-hour chart. Source: TradingViewThe 4-hour chart shows that the pair picked up momentum after breaking and closing above the 200-SMA. The bears tried to stall the up-move at $30 and pull the price down but the bulls successfully defended the 20-EMA.This suggests that the sentiment has turned positive and traders are buying on dips. The pair could rally to the overhead zone at $33.60 to $34.15 where the bears may mount a strong resistance.If the price turns down and breaks below the 20-EMA, it will suggest that supply exceeds demand. That could open the doors for a possible decline to $26.37 and then to the 200-SMA.HNT/USDTHelium’s HNT token bounced off the strong support at $25 and broke above the 20-day EMA ($35.38) on Dec. 16. The bears attempted to pull the price back below the 20-day EMA but the bulls purchased the dip and extended the recovery to $43.40 on Dec. 23. HNT/USDT daily chart. Source: TradingViewThe bears are defending the overhead zone between the 50% Fibonacci retracement level at $42.14 and the 61.8% retracement level at $46.18. This has pulled the price back to the 20-day EMA, which is an important level to watch out for.If the price rebounds off the current level, the buyers will try to push the HNT/USDT pair above the overhead zone. If they succeed, the pair could rise to $51.94.Conversely, if bears sink the price below the 20-day EMA, the pair could drop to $29.94. A break and close below this level could sink the price to $25.HNT/USDT 4-hour chart. Source: TradingViewThe bears are defending the overhead resistance at $42. Although the bulls pushed the price above this resistance, they could not sustain the higher levels. This could have trapped the aggressive bulls, resulting in a correction.The 20-EMA has flattened out and the RSI is near the midpoint, indicating a balance between supply and demand.If bears pull the price below the 200-SMA, the correction could deepen further and the pair may slide to $30. Alternatively, a break and close above $39.50 could push the price to $42. A break and close above this level will suggest the resumption of the uptrend.The views and opinions expressed here are solely those of the author and do not necessarily reflect the views of Cointelegraph. Every investment and trading move involves risk, you should conduct your own research when making a decision.

Čítaj viac

Price analysis 12/24: BTC, ETH, BNB, SOL, ADA, XRP, LUNA, AVAX, DOT, DOGE

Bitcoin (BTC) bounced back above the psychological level at $50,000 and the S&P 500 hit a new all-time closing high on Dec. 23, suggesting that the panic selling caused due to the omicron variant is subsiding and the much-awaited “Santa rally” may have started.Data from on-chain analytics firm Glassnode shows that about 100,000 Bitcoin is going from “liquid” to “illiquid” state every month, which means that the coins are being sent to addresses “with little history of spending.” This suggests accumulation by investors.Daily cryptocurrency market performance. Source: Coin360In another sign that investors are not dumping their coins on small corrections, data from CryptoRank shows that the total Bitcoin on crypto exchanges has dropped from 9.5% of the total Bitcoin supply in October 2020 to 6.3% of the supply in December of this year, which is the lowest level in 2021.Is the current recovery the start of a new uptrend or is this just a dead cat bounce that will be sold into? Let’s study the charts of the top-10 cryptocurrencies to find out.BTC/USDTBitcoin broke and closed above the 20-day exponential moving average ($49,720) on Dec. 23, indicating that the sellers may be losing their grip. The flattening 20-day EMA and the relative strength index (RSI) near the midpoint suggest a possible change in the short-term trend.BTC/USDT daily chart. Source: TradingViewThe recovery could rise to the 38.2% Fibonacci retracement level at $52,314 and then to the 50% retracement level at $55,560. The bears are likely to mount a strong resistance in this zone. If the price turns down from this zone, the bears will again try to resume the downtrend.A break and close below the strong support zone at $45,000 to $42,000 could open the doors for a possible decline to $30,000. On the other hand, if buyers drive the price above $55,560, the BTC/USDT pair could rise to the 61.8% Fibonacci retracement level at $58,686. A break and close above this level will improve the prospects of a retest of the all-time high.ETH/USDTEther (ETH) broke and closed above the descending channel and the 20-day EMA ($4,060) on Dec. 23, which is the first indication that the correction may be ending.ETH/USDT daily chart. Source: TradingViewIf buyers sustain the price above the 20-day EMA, the bullish momentum could pick up and the ETH/USDT pair could rise to $4,488. This level may again act as a strong resistance but if bulls push the price above it, the pair could retest the all-time high at $4,868.The 20-day EMA is flattening out and the RSI is near the midpoint, suggesting that bulls are attempting a comeback.However, if the price turns down and breaks back into the channel, it will suggest that the current breakout was a bull trap. The pair could then drop to $3,643.73. A break and close below this support could result in a decline to the 200-day simple moving average ($3,316).BNB/USDTBinance Coin (BNB) has recovered to the downtrend line, which could act as a strong resistance. If the price turns down from the current level, it will suggest that traders continue to sell on rallies.BNB/USDT daily chart. Source: TradingViewThe bears will now attempt to pull the price down to the strong support zone at $500 to $489.20. If this zone crumbles, the decline could extend to the 200-day SMA ($439) where buyers are likely to step in and provide support.Contrary to this assumption, if bulls drive and sustain the price above the downtrend line, it will suggest that the correction could be over. The buyers will then attempt to resume the up-move, which may face resistance at $575 and later at $617. SOL/USDTAfter trading close to the 20-day EMA ($184) for the past few days, Solana (SOL) broke and closed above the resistance on Dec. 23. The 20-day EMA has flattened out and the RSI is close to the midpoint, suggesting a balance between supply and demand.SOL/USDT daily chart. Source: TradingViewThis balance will tilt in favor of the bulls if the price sustains above the 20-day EMA. Such a move will indicate that the short-term corrective phase may be ending. The SOL/USDT pair could first rise to $204.10 and then to $240.Conversely, if the price turns down and sinks below $168.49, it will suggest that bears continue to sell on rallies. The pair could then drop to $148.04. If this level also cracks, the pair could slump to the 200-day SMA ($123). ADA/USDT Cardano (ADA) jumped above the 20-day EMA ($1.37) on Dec. 23, indicating that buyers are attempting a comeback. However, the bears are unlikely to give up easily and will attempt to pull the price back below the 20-day EMA.ADA/USDT daily chart. Source: TradingViewIf they succeed, it will suggest that the sentiment remains negative and traders are selling on rallies. The ADA/USDT pair could then drop to the strong support at $1.18. A break and close below this level could sink the pair to $1.Alternatively, if the price rebounds off the 20-day EMA, it will suggest that the sentiment has turned bullish and traders are buying on dips. The bulls will then attempt to push the price to the overhead resistance at $1.87.XRP/USDTXRP broke and closed above the 200-day SMA ($0.94) on Dec. 22, indicating that the sellers may be losing their grip. The bears are currently attempting to stall the recovery near the psychological mark at $1.XRP/USDT daily chart. Source: TradingViewIf bulls do not allow the price to slip back below the moving average, it will indicate that traders are buying the dips. That will increase the possibility of a break above $1. If that happens, the XRP/USDT pair could rise to $1.20 and later reach the stiff overhead resistance at $1.41.Contrary to this assumption, if the price breaks back below the moving averages, it will suggest that traders are selling near the stiff overhead resistance level. This could keep the pair stuck inside a large range between $0.75 and $1.LUNA/USDTTerra’s LUNA token turned down from $98.20 on Dec. 22 indicating that bears are defending the psychological resistance at $100. However, the bulls had other plans as they bought the dip and resumed the up-move on Dec. 23.LUNA/USDT daily chart. Source: TradingViewThe rising 20-day EMA ($74) and the RSI in the overbought zone indicate a buyers’ advantage. If bulls sustain the price above $100, the LUNA/USDT pair could start the next leg of the uptrend. The next target objective on the upside is $124.65 and then $150.Alternatively, if the price turns down from the current level, it will suggest that bears continue to pose a stiff challenge at $100. The selling could intensify if the price plummets below the 20-day EMA. The pair could then drop to $50.Related: Bitcoin ‘Santa rally’ pauses at $51.5K as funds bet on a sub-$60K BTC price for January 2022AVAX/USDTAvalanche (AVAX) has been facing resistance in the zone between the 61.8% Fibonacci retracement level at $119.69 and the 78.6% retracement level at $131.70, but a minor positive is that bulls have not given up much ground.AVAX/USDT daily chart. Source: TradingViewThe rising 20-day EMA ($107) and the RSI in the positive territory suggest that the path of least resistance is to the upside. If bulls drive the price above $131.70, the AVAX/USDT pair could retest the all-time high at $147.On the contrary, if the price turns down from the current level or the overhead resistance and breaks below the 20-day EMA, it will suggest that demand dries up at higher levels. The pair could then drop to $98.14. If this level cracks, the next stop could be $75.50.DOT/USDTPolkadot (DOT) rebounded off the strong support zone at $25 to $22.66 on Dec. 20 and the bulls pushed the price above the moving averages on Dec. 23.DOT/USDT daily chart. Source: TradingViewIf buyers sustain the price above the moving averages, the DOT/USDT pair could rise to $31.49 where the bears may mount stiff resistance. If the price turns down from this level but rebounds off the moving averages, it will suggest a change in sentiment from sell on rallies to buy on dips. That could open the doors for a possible rally to $39.35.This positive view will invalidate if the price turns down from the current level and breaks below the 20-day EMA ($28.42). That could pull the pair down to the support zone.DOGE/USDTDogecoin’s (DOGE) rebound off the strong support at $0.15 has risen above the 20-day EMA ($0.18). This suggests that the bears may be losing their grip.DOGE/USDT daily chart. Source: TradingViewThe buyers will now try to propel the price above the overhead resistance at $0.19. If they succeed, the DOGE/USDT pair could rally to $0.22 and then to the 200-day SMA ($0.23). The bears are likely to defend this zone with vigor.On the other hand, if the price turns down from $0.19, the pair could again drop toward $0.15 and remain range-bound between these two levels for a few more days. The bears will have to sink and sustain the price below $0.15 to start the next leg of the downtrend.The views and opinions expressed here are solely those of the author and do not necessarily reflect the views of Cointelegraph. Every investment and trading move involves risk. You should conduct your own research when making a decision.Market data is provided by HitBTC exchange.

Čítaj viac

Získaj BONUS 8 € v Bitcoinoch

nakup bitcoin z karty

Registrácia Binance

Burza Binance

Aktuálne kurzy