Autor Cointelegraph By Rakesh Upadhyay

Price analysis 1/5: BTC, ETH, BNB, SOL, ADA, XRP, LUNA, DOT, AVAX, DOGE

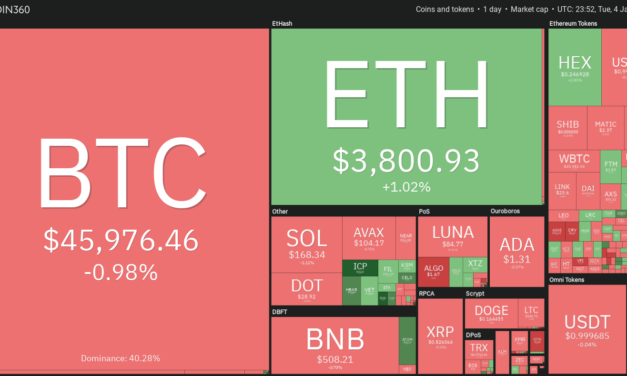
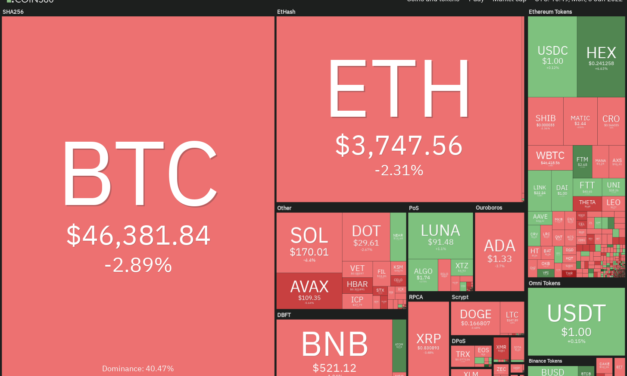
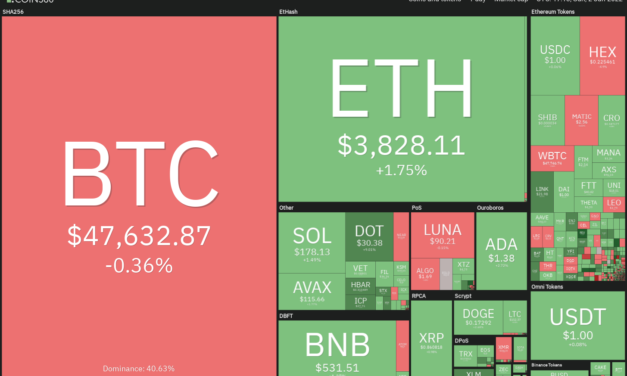
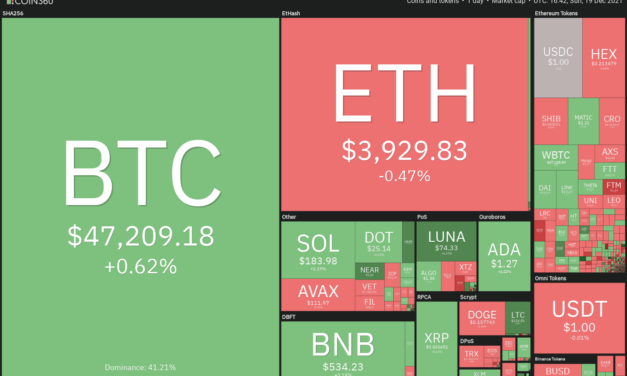
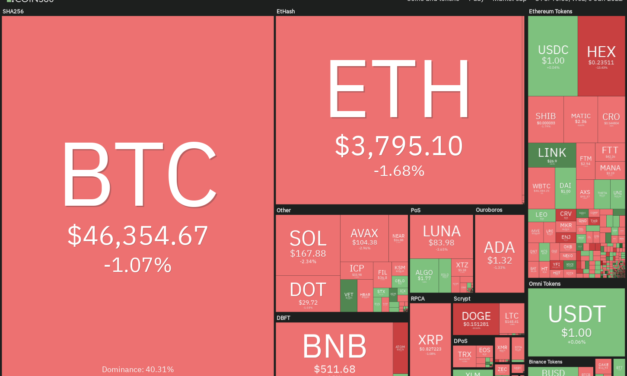
Bitcoin (BTC) and most major altcoins are stuck in a tight range with bulls buying near the support and bears selling at resistance levels. Usually, such tight ranges are followed by an expansion in volatility.Although a few analysts have not ruled out a quick drop to low $40,000s, most traders expect Bitcoin to rebound sharply and move up to $60,000.Goldman Sachs said in a note to investors that if Bitcoin continues to increase its market share over gold as a store of value and crosses the 50% mark, then it could rally to $100,000 over the next five years.Daily cryptocurrency market performance. Source: Coin360On-chain analytics provider Glassnode said in its report on Monday that Bitcoin’s illiquid supply has increased to more than 76% of the total circulating supply. According to Glassnode researchers, the drop in liquid supply suggests that price capitulation looks unlikely in the near future.Could Bitcoin surprise with a sharp move down and pull the major altcoins lower? Let’s study the charts of the top-10 cryptocurrencies to find out.BTC/USDTBitcoin’s price is sandwiched between the 20-day exponential moving average ($48,033) and the critical support at $45,456. Although both moving averages are sloping down, the relative strength index (RSI) is attempting to form a positive divergence. This indicates that the selling pressure could be reducing.BTC/USDT daily chart. Source: TradingViewIf bulls push and sustain the price above the 20-day EMA, the BTC/USDT pair could rise to $51,936.33. This level is likely to act as a stiff resistance. If the price turns down from it, the pair could remain range-bound between $51,936.33 and $45,456 for a few more days.A break and close above $51,936.33 will suggest the start of an up-move that could reach $60,000. On the contrary, if the price turns down and plummets below $45,456, the selling could intensify and the pair could then drop to the $42,000 to $40,000 support zone.ETH/USDTEther (ETH) turned down from the 20-day EMA ($3,881) but the positive sign is that bulls are not giving up much ground. This indicates buying on dips. The bulls will now attempt to push the price back above the 20-day EMA.ETH/USDT daily chart. Source: TradingViewIf they do that, it will indicate that the correction could be ending. The ETH/USDT pair could then rise to the 50-day SMA ($4,086), which could again act as a resistance. A break and close above this level will suggest the start of an up-move to $4,488 and then to the all-time high at $4,888.Contrary to this assumption, if the price turns down from the 20-day EMA, a drop to the $3,643.73 to $3,503.68 support zone is possible. This is an important support for the bulls to defend because a break and close below it could open the doors for a possible decline to $3,270 and then to $2,800.BNB/USDTBinance Coin (BNB) has turned down from the 20-day EMA ($530) and is currently taking support at the psychological level at $500.BNB/USDT daily chart. Source: TradingViewIf bears sink and sustain the price below the $500 to $489.20 support zone, the selling momentum could pick up and the BNB/USDT pair could drop to $435.30. The downsloping moving averages and the RSI in the negative territory indicate advantage to bears.Conversely, if the price rebounds off the current level, it will suggest that bulls continue to defend this support. They will then make one more attempt to push the price above the 20-day EMA. If that happens, that pair could rise to $575. SOL/USDTSolana (SOL) turned down from the 20-day EMA ($178) on Jan. 2, indicating that bears are selling on every minor rally. The bears will now try to pull the price below the strong support at $167.88.SOL/USDT daily chart. Source: TradingViewIf they succeed, the SOL/USDT pair could drop to $148.04 which could act as a strong support. If the bounce off this level fails to rise above $167.99, it will indicate that demand dries up at higher levels.That could intensify the selling and the pair could drop to the critical support at $120. The bulls will have to push and sustain the price above the moving averages to signal that the selling pressure could be reducing. The pair could then rally to $204.75.ADA/USDT Cardano (ADA) has been trading between the 20-day EMA ($1.36) on the upside and $1.28 on the downside. This is a minor positive as it suggest that bulls are not willing to cede ground to the bears.ADA/USDT daily chart. Source: TradingViewThe 20-day EMA is flattening out and the RSI is just below 46, suggesting that the selling pressure could be reducing. If bulls thrust the price above the moving averages, the ADA/USDT pair could rise to $1.60 and then to the resistance line of the channel.A break and close above the channel will signal that the downtrend could be over. This positive view will invalidate if the price turns down and breaks below $1.18. That could pull the price to the crucial support at $1.XRP/USDTXRP turned down from the 20-day EMA ($0.86) on Jan. 3 suggesting that the sentiment remains negative and traders are selling on relief rallies.XRP/USDT daily chart. Source: TradingViewThe long tail on the Jan. 4 candlestick shows strong buying in the $0.77 to $0.75 support zone. The XRP/USDT pair could now consolidate between $0.75 and the 20-day EMA for the next few days.A break and close above the moving averages could clear the path for a rally to $1. If bulls clear this hurdle, the pair could start its journey toward the stiff overhead resistance at $1.41. Alternatively, if the price breaks and closes below $0.75, the pair could drop to $0.60 and then to $0.50.LUNA/USDTTerra’s LUNA token turned down from the overhead resistance at $93.81 on Jan. 3 and has reached the 20-day EMA ($83). This suggests that bears are selling on rallies.LUNA/USDT daily chart. Source: TradingViewIf bears pull the price below $81.11, the selling could intensify as short-term traders may rush to the exit. The LUNA/USDT pair could first drop to $76.72 and then extend the decline to the 50-day SMA ($67).Contrary to this assumption, if the price bounces off $81.11, it will suggest that bulls continue to buy on dips. The bulls will then make one more attempt to clear the overhead barrier at $93.81 and push the pair to the all-time high at $103.60.Related: Bitcoin monthly RSI lowest since September 2020 in fresh ‘oversold’ signalDOT/USDTPolkadot (DOT) has been trading between the 20-day EMA ($28) and the overhead resistance at $31.49 for the past few days. The flat 20-day EMA and the RSI just above the midpoint suggests a balance between supply and demand.DOT/USDT daily chart. Source: TradingViewIf the price breaks and closes above the $31.49 to $32.78 resistance zone, it will indicate that the balance has tilted in favor of the bulls. The DOT/USDT pair could then start its northward march toward $40.Conversely, if the price turns down and breaks below the 20-day EMA, the pair could extend its stay inside the range between $31.49 and $22.66 for a few more days. The bears will have to sink and sustain the price below $22.66 to signal the resumption of the down move.AVAX/USDTAvalanche (AVAX) slipped below the moving averages on Jan. 4, indicating that bears are aggressively defending the downtrend line. The flat 20-day EMA ($107) and the RSI just below the midpoint suggest a state of equilibrium between the bulls and the bears.AVAX/USDT daily chart. Source: TradingViewIf the price sustains below the moving averages, the bears will attempt to sink the AVAX/USDT pair below $98. If they manage to do that, the pair could drop to the strong support at $75.50.On the contrary, if bulls drive the price back above the moving average, the pair could rise to the downtrend line. A break and close above this level will signal a possible change in trend. The pair could first rise to $128 and then retest the all-time high at $147.DOGE/USDTDogecoin (DOGE) has been trading in a tight range between the 20-day EMA ($.0.17) and $0.16 for the past few days. This suggests that both the bulls and the bears are not placing large bets and are playing it safe.DOGE/USDT daily chart. Source: TradingViewUsually, tight ranges are followed by sharp moves. The downsloping moving averages and the RSI in the negative zone suggest the path of least resistance is the downside.If the price breaks below $0.16, the bears will attempt to pull the DOGE/USDT pair below the strong support at $0.15. If they succeed, it could result in a decline to $0.13 and then to $0.10.On the other hand, if the price turns up from the current level and rises above the 20-day EMA, the pair could rally to the stiff overhead resistance at $0.19. The bulls will have to clear this hurdle to signal a possible change in trend.The views and opinions expressed here are solely those of the author and do not necessarily reflect the views of Cointelegraph. Every investment and trading move involves risk. You should conduct your own research when making a decision.Market data is provided by HitBTC exchange.

Čítaj viac

Top 5 cryptocurrencies to watch in 2022: BTC, ETH, BNB, AVAX, MATIC

Bitcoin (BTC) witnessed a roller coaster ride in 2021 and even though BTC has corrected sharply from its all-time high at $69,000, the digital asset is still up by 60% year-to-date. During the same period, gold has dropped more than 5%. With inflation soaring in the United States and several other parts of the world, Bitcoin’s outperformance over gold shows that investors may be considering it to be a better hedge against inflation when compared to gold.During the year, the total crypto market capitalization surged to about $3 trillion, but Bitcoin’s dominance fell from about 70% at the start of the year to 40%. This shows that several altcoins have outperformed Bitcoin by a huge margin.Crypto market data daily view. Source: Coin360As cryptocurrencies gain wider adoption, multiple altcoins are likely to capture investors’ attention. These could produce strong returns for investors over the next year. Technical analysis has been used to arrive at the current list of large-cap cryptocurrencies that could remain in focus in 2022 and benefit from a crypto bull run. Let’s study the charts of the top five cryptocurrencies to calculate their possible target objectives and the support levels to watch out for in 2022.BTC/USDTBitcoin (BTC) broke and closed above the overhead resistance at $64,854 in early November but the long wick on the candlestick shows profit-booking at higher levels. The selling continued in the following week and the price pulled back below $64,854.BTC/USDT weekly chart. Source: TradingViewThe bulls attempted to defend the 20-week exponential moving average (EMA) ($51,999) but could not sustain the rebound. This intensified the selling and pulled the price below the 50-week simple moving average (SMA) ($47,681).The bulls purchased the dip but failed to extend the recovery above the 20-week EMA. This indicates a possible change in sentiment from buy on dips to sell on rallies. The bears are once again attempting to pull and sustain the price below the 50-week SMA.If they succeed, the BTC/USDT pair could drop to the strong support at $39,600. The 20-week EMA has started to turn down and the relative strength index (RSI) has slipped below 50, indicating that bears have the upper hand. A break and close below $39,600 could result in a deeper correction to $28,805. Such a sharp fall may delay the start of the next leg of the uptrend.On the other hand, if bulls successfully defend the 100-week SMA, the pair will make one more attempt to rise above the 20-week EMA. If that happens, the pair will attempt a rally to the overhead zone at $64,854 to $69,000.A break and close above this zone could start the next leg of the uptrend that could push the pair to the psychologically critical level at $100,000.ETH/USDTEther (ETH) is correcting in a strong uptrend. Both moving averages are sloping up and the RSI is in the positive territory, indicating that bulls have the upper hand.ETH/USDT weekly chart. Source: TradingViewAlthough bears have been attempting to pull the price below the 20-week EMA ($3,745), the long tail on the candlesticks of the past few weeks shows that bulls are buying aggressively at lower levels.The bulls will now make one more attempt to clear the overhead hurdle at the psychologically critical level at $5,000. If they succeed, the ETH/USDT pair could start the next leg of the uptrend with the first target at 100% Fibonacci extension level at $5,719.68.If the momentum carries the price above this level, the next target to watch out for is the 138.2% Fibonacci extension level at $6,566.19 and then the 161.8% extension level at $7,089.17.Contrary to this assumption, if the price turns down from the current level or the overhead resistance and breaks below the 20-week EMA, it will signal that traders are selling on rallies. That could open the doors for a possible drop to the strong support at $2,652.This is an important level to watch on the downside because a break below it could pull the pair to $1,700.BNB/USDTBinance Coin (BNB) turned down from $669.30, indicating that bears are aggressively defending the all-time high at $691.80. However, a minor positive is that bulls are buying the dips to the 20-week EMA ($500).BNB/USDT weekly chart. Source: TradingViewThe upsloping moving averages and the RSI is in the positive zone indicate that buyers have the upper hand.If the price rebounds off the current level, the BNB/USDT pair could rise to the overhead zone at $669.30 to $691.80. The bulls will have to clear this barrier to signal the resumption of the uptrend.If that happens, the pair could start the next leg of the up-move to $848.30 and thereafter attempt a rally to $1,171.90.Another possibility is that the price bounces off the 20-week EMA but turns back from the overhead resistance. In such a case, the pair may remain range-bound for a few weeks.A consolidation near the all-time high is a positive sign as it shows that traders are not rushing to the exit. That increases the prospects of the continuation of the up-move.Conversely, if bears sink and sustain the price below the 20-week EMA, it will indicate that supply exceeds demand. That could result in a decline to the 50-week SMA ($379). A break and close below this level could invalidate the bullish assumption.Related: Nexo co-founder targets Bitcoin at $100K by mid-2022AVAX/USDTAvalanche’s (AVAX) sharp rally to the all-time high at $147 had pushed the RSI near the 85 level, indicating that the up-move was overextended in the short term. This may have resulted in profit-booking by short-term traders.AVAX/USDT weekly chart. Source: TradingViewThe bears pulled the price below $81 for three consecutive weeks but they could not sustain the lower levels as seen from the long tail on the candlesticks. This indicates that bulls have flipped the previous resistance at $81 into support.The strong rebound off the 20-EMA ($73) indicates that sentiment remains bullish and traders are buying on dips. The bulls will now attempt to push the price to the all-time high at $147. A break and close above this resistance could start the next leg of the uptrend. The AVAX/USDT pair could then rise to $213.17 and if the momentum sustains, the rally could even extend to $260.This bullish view will invalidate if the price turns down from the current level or the overhead resistance and breaks below $75.50. Such a move will indicate that the sentiment has turned negative and traders are selling on rallies.The pair could then drop to the strong support at $50. Such a deep fall is likely to delay the start of the next leg of the up-move.MATIC/USDTPolygon’s MATIC has been in an uptrend. The bulls attempted to push the price above the all-time high at $2.70 but failed. This suggests that bears are defending the overhead resistance aggressively. MATIC/USDT weekly chart. Source: TradingViewHowever, a positive sign is that bulls are buying the dips to the 20-week EMA ($1.62). This indicates that sentiment remains bullish and traders are accumulating on dips. The rising moving averages and the RSI near the overbought zone indicate that the path of least resistance is to the upside. The bulls will make one more attempt to push the MATIC/USDT pair above $2.70.If they manage to do that, the pair could start the next leg of the uptrend which could reach $3.28. A break and close above this level could extend the rally to $4 and eventually to $4.77.Contrary to this assumption, if the price turns down from the current level or the overhead resistance and plummets below the 20-week EMA, it will suggest that supply exceeds demand.If the price sustains below the 20-week EMA, the selling could pick up momentum and the pair could plummet to the 50-week SMA ($1.04).The views and opinions expressed here are solely those of the author and do not necessarily reflect the views of Cointelegraph. Every investment and trading move involves risk, you should conduct your own research when making a decision.

Čítaj viac

Price analysis 1/3: BTC, ETH, BNB, SOL, ADA, XRP, LUNA, AVAX, DOT, DOGE

Bitcoin’s (BTC) price action has been uneventful in the first few days of the new year and it continues to languish below the psychological level at $50,000. The Crypto Fear and Greed Index is in the fear zone registering a value of 29/100. On-chain analytics resource Ecoinometrics said stages of extreme fear rarely remain for long, which means “there is a limited downside at 30 days.”Bitcoin continues to garner support from various quarters. Wharton School finance professor Jeremy Siegel said in an interview with CNBC that Bitcoin has replaced gold as an inflation hedge in the minds of Millennials.Daily cryptocurrency market performance. Source: Coin360Savvy investors have been turning to Bitcoin to protect their portfolios against the possible debasement of fiat currencies. Hungarian-born billionaire Thomas Peterffy advocated putting 2% to 3% of one’s portfolio in crypto to hedge in case fiat “goes to hell.”Could Bitcoin shed its range-bound action and start a trending move? Let’s study the charts of the top-10 cryptocurrencies to find out.BTC/USDTBitcoin’s failure to rise above the 20-day exponential moving average (EMA) ($48,449) suggests that bears are selling on every minor rally. Both moving averages are sloping down and the relative strength index (RSI) is in the negative zone, indicating advantage to bears.BTC/USDT daily chart. Source: TradingViewThe bears will now try to sink the price below the strong support at $45,456. If they succeed, it will suggest the resumption of the down-move. The BTC/USDT pair could first drop to the Dec. 4 intraday low at $42,000 and if this level cracks, the next stop could be $40,000. The longer the price sustains below the 20-day EMA, the greater the possibility of a move down. Conversely, if the price turns up and breaks above the 20-day EMA, it will suggest that bulls are attempting a comeback. The pair could then rise to the 50-day simple moving average (SMA) ($51,938), which may act as a strong barrier. If bulls thrust the price above this level, it will suggest a possible change in trend. The pair could then start an up-move to $60,000.ETH/USDTEther’s (ETH) rebound off the $3,643.73 to $3,503.68 support zone has reached the 20-day EMA ($3,899) where the bears are mounting a stiff challenge.ETH/USDT daily chart. Source: TradingViewThe gradually downsloping moving averages and the RSI in the negative zone indicate that bears have the upper hand. If the price continues lower, the bears will again try to pull the ETH/USDT pair below the support zone. If they manage to do that, the pair could start its downward journey to $3,270 and then to $2,800. On the contrary, if bulls push the price above the moving averages, it will suggest that the corrective phase could be over. The pair could then rally to $4,488BNB/USDTBinance Coin (BNB) bounced off the strong support at $500 and reached the 20-day EMA ($536) where the recovery is facing resistance. Both moving averages are turning down and the RSI is in the negative zone, suggesting a minor advantage to the bears.BNB/USDT daily chart. Source: TradingViewIf bulls push the price above the 20-day EMA, the BNB/USDT pair could rise to the overhead resistance at $575. This level may again act as a stiff resistance. If the price turns down from this level the pair could extend its stay inside the range between $500 and $575 for a few more days.Conversely, if the price turns down from the 20-day EMA, the bears will again attempt to sink the pair below $500. If they manage to do that, the selling could intensify and the pair could start a new downtrend to $450.SOL/USDTSolana (SOL) has been trading between $167.88 and the 20-day EMA ($180) for the past few days but this tight range trading is unlikely to continue for long.SOL/USDT daily chart. Source: TradingViewBoth moving averages are turning down and the RSI is in the negative zone, indicating that bears are in control. If sellers pull the price below $167.88, the SOL/USDT pair could drop to $148.04 and then to $120.Conversely, if bulls thrust the price above the 20-day EMA, the pair could rise to $204.75. This level may again act as a resistance but if bulls overcome this hurdle, the pair could rise to the resistance line of the falling wedge pattern. ADA/USDT Cardano (ADA) has been trading close to the 20-day EMA ($1.37) for the past few days, which suggests a stalemate between the bulls and the bears.ADA/USDT daily chart. Source: TradingViewIf bulls propel the price above the 20-day EMA, the ADA/USDT pair could rise to the overhead resistance at $1.59. A break and close above this level could push the pair to the resistance line of the descending channel.The bulls will have to push and sustain the price above the channel to indicate that the downtrend could be over. Conversely, if the price turns down from the current level, the bears will again try to pull the pair below $1.18 and retest the critical support at $1.XRP/USDTRipple (XRP) bounced off $0.80 but the bulls are struggling to push the price above the 20-day EMA ($0.87). This suggests that the sentiment remains negative and traders are selling on rallies.XRP/USDT daily chart. Source: TradingViewIf the price continues to slide lower, the bears will try to pull the XRP/USDT pair to the strong support at $0.75. If this level cracks, the pair could start the next leg of the downtrend to $0.60.On the contrary, if the price rises above the moving averages, the pair could rally to $1. This level may act as a strong resistance and if the price turns down from it, the pair could remain range-bound for a few more days.A break and close above $1 could indicate that the downtrend could be over. The pair could then start its march toward $1.41.LUNA/USDTTerra’s LUNA token is in an uptrend. Both moving averages are sloping up and the RSI is in the positive territory, indicating that bulls have the upper hand.LUNA/USDT daily chart. Source: TradingViewThe bulls are attempting to push the price above the minor resistance at $93.81. If the price sustains above this level, the LUNA/USDT pair could retest the all-time high at $103.60. A break and close above this level could signal the resumption of the uptrend.The pair could first rally to $135.26 and then reach $150. Contrary to this assumption, if the price turns down from the current level and breaks below the 20-day EMA ($83), it could signal the start of a deeper correction to the 50-day SMA ($66).Related: Bitcoin dips below $47K as US dollar surge dampens BTC price performanceAVAX/USDTAvalanche (AVAX) bounced off the $98 support and rose above the moving averages on Dec. 31 but the bulls have not been able to clear the downtrend line. This suggests that bears are defending this level with vigor.AVAX/USDT daily chart. Source: TradingViewIf bears pull the price below the moving averages, the AVAX/USDT pair could drop to $98. A break below this level could open the doors for a possible drop to $75.50. On the contrary, if the price rebounds off the moving averages, it will suggest that the sentiment has turned positive and traders are buying on dips. That will improve the prospects of a break above the downtrend line.The pair could then rise to $128. A break and close above this level could complete an inverse head and shoulders pattern, which has a target objective at $177.50.DOT/USDTPolkadot (DOT) rose above the 20-day EMA ($28) on Jan. 2 and the bulls will now attempt to clear the overhead resistance zone at $31.49 to $32.78.DOT/USDT daily chart. Source: TradingViewThe 20-day EMA is flat and the RSI has jumped into the positive territory, indicating that buyers are attempting a comeback. If bulls drive the price above $32.78, the DOT/USDT pair could rise to $40.If the price turns down from the overhead zone, it will suggest that the pair could consolidate between $22.66 and $31.49 for a few more days. The bears will have to pull and sustain the price below $22.66 to start the next leg of the downtrend.DOGE/USDTDogecoin’s (DOGE) bounce to the 20-day EMA ($0.17) is facing strong resistance from the bears. The moving averages continue to slope down and the RSI is in the negative zone, suggesting that bears are in control.DOGE/USDT daily chart. Source: TradingViewThe sellers will now try to pull the price to $0.15. If the price rebounds off this level, the bulls will again try to push the DOGE/USDT pair above the 20-day EMA. If they do that, the pair could rise to the overhead resistance at $0.19.A break and close above $0.19 will be the first sign that bulls are back in the game. The pair could first rally to $0.22 and then to $0.24. Alternatively, if the price plummets below $0.15, the downtrend could resume. The pair could drop to $0.13 and then slide to the psychological level at $0.10.The views and opinions expressed here are solely those of the author and do not necessarily reflect the views of Cointelegraph. Every investment and trading move involves risk. You should conduct your own research when making a decision.Market data is provided by HitBTC exchange.

Čítaj viac

Top 5 cryptocurrencies to watch this week: BTC, LUNA, FTM, ATOM, ONE

Bitcoin (BTC) continues to languish below the psychological level at $50,000 in the first few days of the New Year, indicating a lack of aggressive buying by traders. Former BTCC CEO Bobby Lee said the exodus of the Chinese traders who had until Dec. 31 to exit Chinese exchanges may have kept prices lower into the year-end.However, President Nayib Bukele of El Salvador, the first country to adopt Bitcoin as legal tender, believes that Bitcoin could rally to $100,000 this year. President Bukele also said that two more countries will accept Bitcoin as legal tender in 2022.Crypto market data daily view. Source: Coin360The increased crypto adoption by institutional investors in 2021 is another long-term positive. According to CoinShares, net inflows into crypto funds in 2021 were more than $9.3 billion. A majority of over two-thirds of the crypto inflows were into Bitcoin.Could Bitcoin start a new up-move in January pulling select altcoins higher? Let’s study the charts of the top-5 cryptocurrencies that may remain positive in the short term.BTC/USDTBitcoin has been trading between the 20-day exponential moving average ($48,720) and the strong support at $45,456 for the past few days. This suggests that buying dries up at higher levels.BTC/USDT daily chart. Source: TradingViewBoth moving averages are turning down and the relative strength index (RSI) is in the negative zone, indicating that bears have the upper hand. If the price turns down from the 20-day EMA, the bears will try to sink the price below $45,456. If they manage to do that, the next leg of the downtrend to $42,000 and then to $40,000 could begin.Contrary to this assumption, if the price breaks above the 20-day EMA, the BTC/USDT pair could rise to the 50-day simple moving average ($52,332). A break and close above this level could signal the start of a new up-move that could reach the 61.8% Fibonacci retracement level at $58,686.BTC/USDT 4-hour chart. Source: TradingViewThe 4-hour chart shows that the pair is range-bound between $45,456 and $51,936.33. The price has rebounded off $45,456 and if bulls push the pair above the 50-SMA, it will suggest accumulation at lower levels. That could drive the price toward $51,936.33.Conversely, if the price turns down from the 50-SMA, the bears will make one more attempt to pull the pair below $45,456. If they succeed, the pair could resume the downtrend with the next target objective at $38,975.67.LUNA/USDTTerra’s LUNA token is attempting to resume its uptrend but the bears have other plans, drawing a line near $93.81.LUNA/USDT daily chart. Source: TradingViewThe upsloping moving averages and the RSI in the positive territory suggest a slight edge to the buyers. If the price once again rebounds off the 20-day EMA ($82), it will indicate that bulls continue to accumulate on dips.The LUNA/USDT pair will then try to break above $93.81 and challenge the all-time high at $103.60. A break and close above this resistance could start the next leg of the uptrend to $135.26.Conversely, if the price turns down and breaks below the 20-day EMA, it will signal a change in the short-term trend. The pair could then drop to $65.15.LUNA/USDT 4-hour chart. Source: TradingViewThe bounce off $81.11 is facing selling in the zone between the 50% Fibonacci retracement at $92.35 and the 61.8% retracement level at $95.01. The bears will now try to pull the price below the 20-EMA and the uptrend line.If they do that, the pair could drop to $84 and then to $81.11. A break and close below this support could signal that bears are back in the game.On the contrary, if the price rebounds off the current level or the uptrend line, the buyers will try to drive the pair above $95.01 and retest the overhead resistance at $103.60.FTM/USDTFantom (FTM) has turned down from the overhead resistance at $2.67, which suggests that bears are defending this level with vigor.FTM/USDT daily chart. Source: TradingViewThe FTM/USDT pair could drop to the 20-day EMA which could act as a strong support. A sharp rebound off this support will suggest that buyers are accumulating on dips. The rising 20-day EMA ($2.03) and the RSI above 68 suggest that the path of least resistance is to the upside. A break and close above $2.67 will suggest that bulls are back in the game. The pair could then start its northward march toward $3.17 and then to $3.48. The bears will have to pull and sustain the price below $2 to invalidate the bullish sentiment.FTM/USDT 4-hour chart. Source: TradingViewThe 4-hour chart shows a rounding bottom formation, which will complete on a break and close above the overhead resistance at $2.67. If the price rebounds off the 20-EMA, the bulls will again try to overcome the barrier at $2.67. If that happens, the up-move could begin.Conversely, if the price breaks below the 20-EMA, it will suggest that the short-term bullish momentum could be weakening. The pair could then drop to the 50-SMA and later to the strong support at $2.Related: Three reasons why PlanB’s stock-to-flow model is not reliableATOM/USDTCosmos (ATOM) broke and closed above the overhead resistance at $34 on Jan. 1. The moving averages have completed a bullish crossover, indicating that bulls have the upper hand. ATOM/USDT daily chart. Source: TradingViewIf the price sustains above $34, the bullish momentum could pick up further and the ATOM/USDT pair could rise to $38 and later to $43.28. The moving averages have completed a bullish crossover and the RSI is in the positive zone, indicating that bulls are in control.Contrary to this assumption, if the price breaks and closes below $34, it will suggest that bears are attempting to trap the aggressive bulls. The pair could then drop to the 20-day EMA ($28). If the price rebounds off this level, the bulls will make one more attempt to clear the overhead hurdle but if the pair breaks below the moving averages, the decline could extend to $25.ATOM/USDT 4-hour chart. Source: TradingViewBoth moving averages are sloping up and the RSI is in the positive territory, suggesting that bulls have the upper hand. If the price rebounds off the 20-EMA, it will signal that sentiment remains positive and traders are buying on dips.The up-move could resume on a break and close above $37. Conversely, if bears pull the price below the 20-EMA, it may lead to profit-booking from short-term traders. That may pull the price down to the 50-SMA. ONE/USDTHarmony (ONE) has reached the downtrend line where the bears are likely to mount a stiff resistance. If the price turns down from the current level, the altcoin could dip to the 20-day EMA ($0.24).ONE/USDT daily chart. Source: TradingViewIf the price rebounds off the 20-day EMA, it will suggest that the sentiment remains bullish and traders are accumulating on dips. The bulls will then again attempt to push the price above the downtrend line.If they succeed, it will suggest the start of a new up-move. The first target on the upside is $0.34 and a break above it could result in a retest at $0.38. This positive view will invalidate if the price turns down and breaks below $0.21. ONE/USDT 4-hour chart. Source: TradingViewThe 4-hour chart shows the formation of a cup-and-handle pattern, which will complete on a break and close above $0.29. This reversal setup has a pattern target at $0.38. It is unlikely to be a straight dash to the target objective because bears are likely to mount a strong resistance at $0.34.Conversely, if the price turns down from the current level, it could drop to the moving averages. If this support cracks, the ONE/USDT pair could decline to $0.21. A bounce off this support could keep the pair range-bound between $0.21 and $0.27 for some time.The views and opinions expressed here are solely those of the author and do not necessarily reflect the views of Cointelegraph. Every investment and trading move involves risk, you should conduct your own research when making a decision.

Čítaj viac

Bitcoin price fell short of analysts’ $100K target, but what about 2022?

Bitcoin (BTC) is likely to end 2021 well below analysts’ target projections of $100,000. Kraken CEO Jesse Powell, who had also projected a $100,000 price target for Bitcoin, still remains bullish in the long term, but he does not rule out a sharp drop in the short term. One of the negatives that may add pressure to Bitcoin in the short term is the shift in the United States Federal Reserve’s monetary policy. On Dec. 15, the Fed announced that it would wind down its bond-buying program at a faster pace, and it also projected three interest rate hikes in 2022.Crypto market data daily view. Source: Coin360Sam Stovall, chief investment strategist of CFRA Research, told CNBC that historically, the S&P 500 tends to post negative returns in the 12-month period when the Fed undertakes three or more rate increases.If history repeats, Bitcoin could also struggle to run away due to its strong correlation with the S&P 500 at various stages in 2021. It is difficult to predict with certainty whether investors will continue to buy Bitcoin to hedge their portfolio against rising inflation if a risk-off sentiment will result in profit-booking.With this uncertainty, let’s turn to the charts and conduct a long-term Bitcoin analysis to determine the critical levels to watch out for.BTC/USDBitcoin’s sharp rally in 2017 pushed the relative strength index (RSI) above 96, indicating a state of euphoria among traders. Vertical rallies are rarely sustainable and are usually followed by a sharp correction or a period of consolidation. That is what happened after the bull move ended in 2017.BTC/USD monthly chart. Source: TradingViewThe BTC/USD pair remained stuck below the December 2017 highs until the breakout above $20,000 in December 2020. This shows a large base-building period of about three years.The pair’s sharp rally in 2021 propelled the RSI above 91 in March before profit-booking set in. However, unlike 2017, bulls aggressively defended the 20-month exponential moving average ($37,281).This suggests that sentiment remained positive and traders were using the dips to accumulate. The subsequent rally drove the pair to a new all-time high at $69,000, but bulls could not sustain the higher levels. This shows that traders are booking profits on rallies. The sharp correction has once again pulled the price toward the 20-month exponential moving average (EMA) and the RSI is exhibiting signs of a negative divergence, indicating that the bullish momentum may be weakening.If bears sink and sustain the price below the 20-month EMA, the pair could drop to the critical support at $28,800. This is an important level for the bulls to defend because a break below it could result in a long period of base-building.On the other hand, if the price rises from the current level, the pair could retest $69,000. A break and close above this resistance could signal the resumption of the uptrend.BTC/USD weekly chart. Source: TradingViewThe bulls pushed the price above the $64,899 level on two occasions but could not sustain the higher levels. This could have trapped the aggressive bulls who purchased the breakout, resulting in a long liquidation.The 20-week EMA ($52,016) has started to turn down gradually, and the RSI has dipped into the negative zone, suggesting that bears are attempting a comeback. The bulls attempted to defend the 50-week simple moving average (SMA) ($47,709) but could not drive the price above the 20-week EMA.This could have attracted further selling, and the bears are now trying to sink the price to the next strong support at $39,600. This is an important level for the bulls to defend because if it cracks, the pair could plummet to $28,732.Such a move could delay the start of the next leg of the uptrend and may keep the pair stuck in a range between $28,732 on the downside and $69,000 on the upside.On the contrary, if the price turns up from the current level and breaks above the 20-week EMA, bulls will make one more attempt to clear the $64,899–$69,000 overhead resistance zone.If they succeed, the bullish momentum could pick up, and the pair could start its northward journey toward the $100,000–$109,000 price zone where the rally may face strong headwinds. Alternatively, a break and close below $28,732 could result in a bear market with the next strong support at $20,000. Related: Bitcoin tests yearly moving average as $100K by Christmas needs ‘small miracle’BTC/USD daily chart. Source: TradingViewThe pair has been declining inside a descending channel for the past week. Both moving averages are sloping down and the RSI is in the negative zone, indicating that bears are in control.If the price turns down from the current level or the 20-day EMA ($50,054), it will suggest that sentiment remains bearish and traders are selling on rallies. That could pull the price to the Dec. 4 intraday low at $42,333.This is an important level for bulls to defend because if it cracks, bears will attempt to sink the price below the support line of the channel. If they manage to do that, the selling could intensify further.The zone between $39,600 and $37,300 may act as strong support, but if bulls fail to push the price above the 20-day EMA, the decline may extend to $28,800.Conversely, if the price rises and breaks above the resistance line of the channel, it will signal that the selling pressure could be reducing. The pair could then rise to the 50-day SMA ($56,524), which may again pose a stiff challenge.The bulls will have to push and sustain the price above the 50-day SMA to indicate the start of an up-move to $60,000. This level may act as a strong resistance, but if crossed, the rally could retest the all-time high. The views and opinions expressed here are solely those of the author and do not necessarily reflect the views of Cointelegraph. Every investment and trading move involves risk, you should conduct your own research when making a decision.

Čítaj viac

Získaj BONUS 8 € v Bitcoinoch

nakup bitcoin z karty

Registrácia Binance

Burza Binance

Aktuálne kurzy