Autor Cointelegraph By Rakesh Upadhyay

Price analysis 1/14: BTC, ETH, BNB, SOL, ADA, XRP, LUNA, DOT, AVAX, DOGE

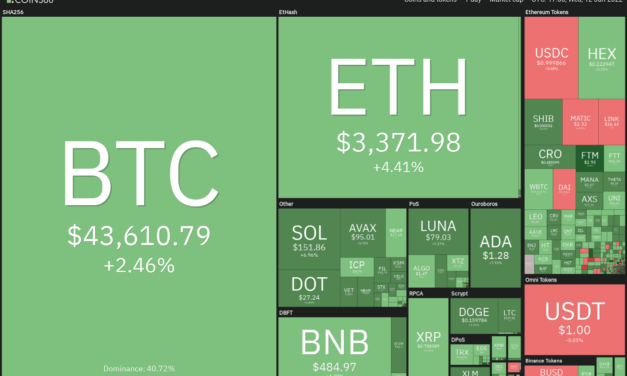
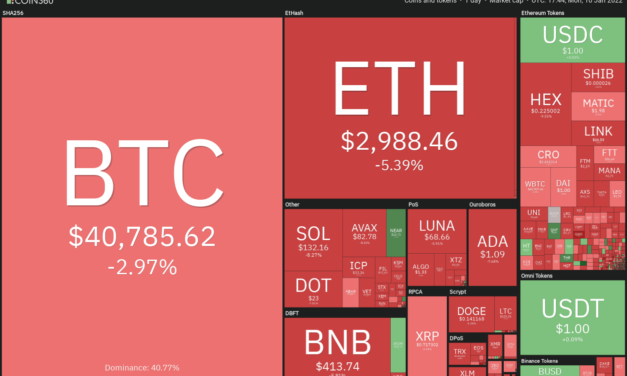
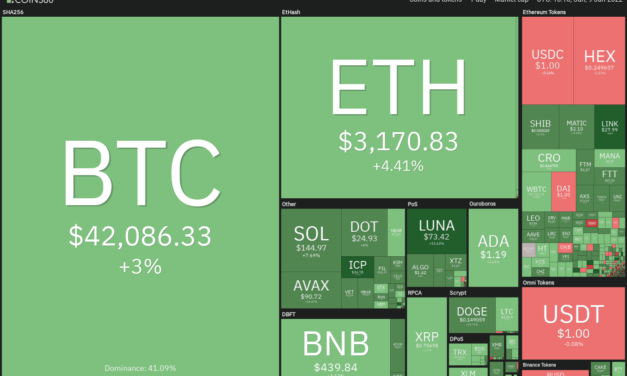
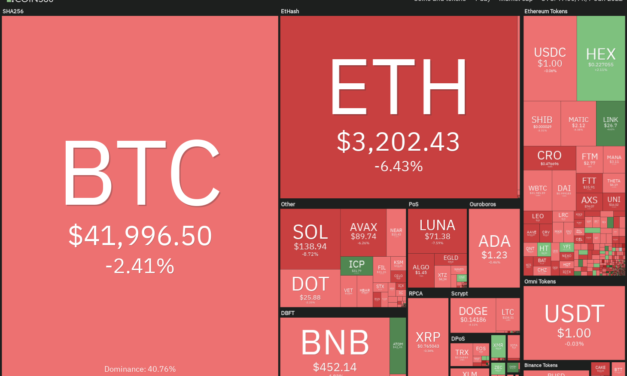
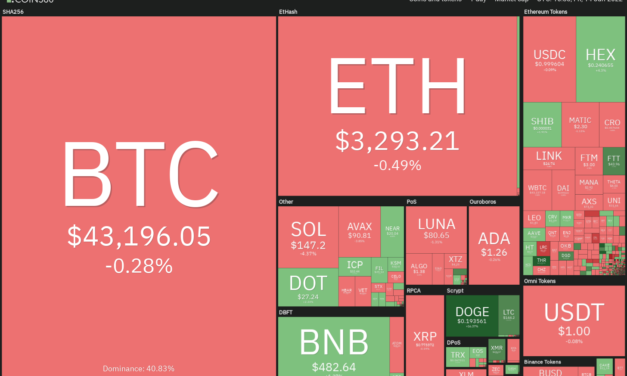
Bitcoin (BTC) and most major altcoins are facing selling at higher levels and buying on dips, indicating the possibility of a range formation. On-chain analysis firm Whalemap said that a “reclaim of $46,500 will look like a trend reversal,” for Bitcoin as the previous accumulation phase of 90,000 BTC was at this level.Fidelity Digital Assets said in its annual report that the “massive “ Bitcoin accumulation by Bitcoin miners suggests that the “Bitcoin cycle is far from over.” The report went on to add that more sovereign nations may “acquire Bitcoin in 2022 and perhaps even see a central bank make an acquisition.” Daily cryptocurrency market performance. Source: Coin360Switzerland-based financial institution SEBA Bank CEO Guido Buehler said in a recent interview that if the right counterparties and necessary regulations are in place, asset pools at SEBA may invest in Bitcoin at the right time. Buehler portrayed a bullish picture for Bitcoin, saying a rally to $75,000 was possible. Will Bitcoin and most major altcoins remain range-bound in the short term? Let’s study the charts of the top-10 cryptocurrencies to find out.BTC/USDTBitcoin turned down from the 20-day exponential moving average ($44,681) on Jan. 13 indicating that bears continue to sell on rallies. The bears will now attempt to pull the price back to the strong support at $39,600.BTC/USDT daily chart. Source: TradingViewBoth moving averages are sloping down and the relative strength index (RSI) is in negative territory, indicating that the path of least resistance is to the downside. If sellers sink and sustain the price below $39,600, the BTC/USDT pair could extend the decline to $30,000.However, the bulls are unlikely to give up easily at $39,600. A strong rebound off the current level or from $39,600 will suggest accumulation at lower levels. The pair could then remain range-bound between $39,600 and $45,456 for a few days. A break and close above $45,456 will be the first indication that the correction may be over. The pair could then start its northward march toward $52,088.ETH/USDTEther’s (ETH) rebound off the support line of the descending channel on Jan. 10 could not even reach the 20-day EMA ($3,485) which suggests that demand dries up at higher levels.ETH/USDT daily chart. Source: TradingViewThe moving averages are sloping down and the RSI is below 40, suggesting that bears are in control. The sellers will now try to pull the price to the zone between the psychological level at $3,000 and the support line of the channel. A break and close below $2,652 will signal the start of the next leg of the downtrend.On the contrary, if the price turns up from the current level, the bulls will make one more attempt to push the ETH/USDT pair above the 20-day EMA. If they succeed, the pair could rise to the resistance line of the channel and later to the 50-day simple moving average ($3,893). The bulls will have to push and sustain the price above this level to signal that the downtrend could be over.BNB/USDTBinance Coin (BNB) is facing strong resistance at the 20-day EMA ($487) but a minor positive is that the bulls have not given up much ground. This suggests that traders are not rushing to the exit. BNB/USDT daily chart. Source: TradingViewIf the price breaks above the 20-day EMA, the bulls will try to clear the overhead hurdle at the downtrend line. If they can pull it off, the BNB/USDT pair will signal a possible change in trend. The pair could then attempt a rally to $617.Conversely, if the price turns down from the 20-day EMA or the downtrend line, it will suggest that bears are selling on rallies. That could keep the pair stuck inside the channel for a few more days. SOL/USDTSolana (SOL) reached the 20-day EMA ($157) on Jan. 13 but the bulls could not clear this overhead hurdle. This suggests that the bears have not yet given up and are selling on rallies.SOL/USDT daily chart. Source: TradingViewThe bears will now attempt to resume the downtrend by pulling the price below the support at $130. If they do that, the SOL/USDT pair could decline to the next important support at $116. The downsloping moving averages and the RSI in the negative territory indicate that the path of least resistance is to the downside.Contrary to this assumption, if the price rises above the 20-day EMA, the pair could rally to the resistance line of the channel. The bulls will have to push the pair above the channel to signal a possible change in trend.ADA/USDT Cardano (ADA) turned down from the 50-day SMA ($1.35) on Jan. 13 but the bulls did not allow the price to break below the $1.18 support. This suggests that bulls are buying on dips. ADA/USDT daily chart. Source: TradingViewThe bulls will now attempt to push and sustain the price above the 50-day SMA. If they manage to do that, the ADA/USDT pair could rally to the resistance line of the descending channel. A break and close above the channel could indicate that the downtrend has ended.Alternatively, if the price turns down from the 50-day SMA, it will suggest that bears continue to sell on rallies. The sellers will then try to sink the pair below $1.18 and pull the price to the critical support at $1.XRP/USDTRipple (XRP) turned down from the 20-day EMA ($0.80) on Jan. 13 but a minor positive is that bulls did not allow the price to dip below the support at $0.75. This indicates accumulation at lower levels.XRP/USDT daily chart. Source: TradingViewIf bulls drive the price above the moving averages, it will suggest that the bears may be losing their grip. The XRP/USDT pair could then rise to the overhead resistance at $1. If the price turns down from this level, the pair could remain range-bound between $1 and $0.75 for a few more days. A break and close above $1 will signal the start of an up-move toward $1.41.Conversely, if the price turns down from the 20-day EMA, the bears will attempt to pull the pair below the $0.75 to $0.69 support zone and resume the downtrend to $0.60.LUNA/USDTTerra’s LUNA token broke and closed above the resistance line of the channel on Jan. 12. The bears tried to pull the price below the 20-day EMA ($78.61) on Jan. 13 but failed. This indicates that bulls are defending the support aggressively.LUNA/USDT daily chart. Source: TradingViewThe buyers are currently attempting to push and sustain the price above the channel and the overhead resistance at $83.86. If they manage to do that, the LUNA/USDT pair could rally to $93.81.The 20-day EMA is trying to turn up and the RSI has risen into the positive territory, indicating that buyers are attempting a comeback.This positive view will invalidate if the price turns down from the current level and breaks below the moving averages. That could pull the price down to the support line of the channel.Related: Bitcoin dips below $42K as new forecast says breakout ‘most probable outcome’ for BTC priceDOT/USDTPolkadot (DOT) turned down from the 20-day EMA ($26.81) on Jan. 13 but the positive sign is that the bulls did not give up much ground. This indicates that bulls are viewing the dips as a buying opportunity.DOT/USDT daily chart. Source: TradingViewThe bulls are currently trying to sustain the price above the moving averages. If they do that, the DOT/USDT pair could rise to the overhead resistance at $32.78. The flat 20-day EMA and the RSI near the midpoint suggest a balance between supply and demand.If the price turns down from $32.78, the pair may extend its stay inside the range for a few more days. The next trending move may start on a break and close above the overhead resistance at $32.78 or on a break below the support at $22.66.AVAX/USDTAvalanche (AVAX) turned down from the 20-day EMA ($96) on Jan. 13, indicating that bears continue to sell on rallies. The price has dipped back to the uptrend line of the symmetrical triangle, which could act as a support.AVAX/USDT daily chart. Source: TradingViewIf the price rebounds off the current level, the buyers will again attempt to propel the price above the moving averages. If they succeed, the AVAX/USDT pair could rally to the downtrend line of the triangle.A break and close above the triangle will suggest that the correction could be over. The pair may then rise to $128.Contrary to this assumption, if the price slips below the uptrend line of the channel, the pair may retest the critical level at $75.50. If this support cracks, the pair could start a decline toward $57 and then $50.DOGE/USDTDogecoin (DOGE) broke and closed above the 20-day EMA ($0.16) on Jan. 13, which was the first indication that the selling pressure may be reducing. That was followed by another sharp move today which pushed the price above the stiff overhead resistance at $0.19.DOGE/USDT daily chart. Source: TradingViewHowever, the long wick on today’s candlestick suggests that bears continue to sell at higher levels. If the price sustains below $0.19, the DOGE/USDT pair could drop to the moving averages and extend its range-bound action for a few more days.Conversely, if the price sustains above $0.19, the bulls will make one more attempt to clear the overhead resistance zone at $0.22 to $0.24. If they manage to do that, the pair could rally toward $0.30.The views and opinions expressed here are solely those of the author and do not necessarily reflect the views of Cointelegraph. Every investment and trading move involves risk. You should conduct your own research when making a decision.Market data is provided by HitBTC exchange.

Čítaj viac

Price analysis 1/12: BTC, ETH, BNB, SOL, ADA, XRP, LUNA, DOT, AVAX, DOGE

Bitcoin (BTC) and most major altcoins appear to have started a relief rally. Glassnode data suggests that Bitcoin addresses with a non-zero balance have risen to about 40 million, indicating increasing adoption by retail traders.Edelman Financial Engines founder Ric Edelman said that the number of Americans owning Bitcoin could rise from 24% currently to one-third by 2022. He expects this to happen as “Bitcoin is becoming more and more mainstream. People are hearing about it everywhere — it isn’t going away.”Daily cryptocurrency market performance. Source: Coin360The investors buying Bitcoin seem to be in it for the long haul, if the outflows from major exchanges are any indication. CryptoQuant data shows outflows of 29,371 BTC on Jan. 11, the highest withdrawals since Sep. 10. Could the recovery in Bitcoin and the major altcoins sustain the higher levels? Let’s study the charts of the top-10 cryptocurrencies to find out.BTC/USDTBitcoin bounced off the $39,600 support on Jan. 10 indicating that bulls are attempting to defend the level with full force. The relief rally could reach the 20-day exponential moving average ($45,058) which is likely to act as a resistance.BTC/USDT daily chart. Source: TradingViewThe downsloping moving averages and the relative strength index (RSI) in the negative zone indicate that bears have the upper hand. If the price turns down from the 20-day EMA, the BTC/USDT pair could again retest the strong support at $39,600.If the level cracks, the pair could witness panic selling, indicating the start of the next leg of the down move.Alternatively, if bulls push and sustain the price above the 20-day EMA, the pair could rise to the 50-simple moving average ($49,031). If this level is crossed, the recovery could reach the stiff overhead resistance at $52,088. ETH/USDTEther (ETH) bounced off the support line of the descending channel on Jan. 10, suggesting that bulls are attempting to defend this level with vigor. The price could reach the overhead zone between the 20-day EMA ($3,536) and the resistance line of the channel.ETH/USDT daily chart. Source: TradingViewBoth moving averages are trending down and the RSI is in the negative zone, indicating that bears have the upper hand. If the price turns down from the overhead zone, it will suggest that sentiment remains negative and traders are selling on rallies. The bears will then attempt to pull the ETH/USDT pair to the support line of the channel. On the other hand, if bulls push the price above the overhead zone, the pair could rise to the 50-day SMA ($3,938). A break and close above this resistance will suggest a possible change in trend.BNB/USDTBinance Coin (BNB) broke below the support line of the descending channel on Jan. 10, but the bears could not achieve a close below it as seen from the long tail on the day’s candlestick.BNB/USDT daily chart. Source: TradingViewThis could have caught the aggressive bears off guard, resulting in a short squeeze on Jan. 11. Follow-up buying today has pushed the price to the 20-day EMA ($489). If bulls clear this hurdle, the BNB/USDT pair could rise to the 50-day SMA ($542).A break and close above this resistance will suggest that the downtrend could be over. The pair could then rise to $617. Conversely, if the price turns down from the 20-day EMA or the downtrend line, the bears will again try to pull the price to the support line of the channel.SOL/USDTSolana (SOL) is attempting a pullback in a downtrend. The price turned up from $130 on Jan. 10 and could now reach the 20-day EMA ($159).SOL/USDT daily chart. Source: TradingViewThe downsloping moving averages and the RSI in the negative zone suggest that bears have the upper hand. If the price turns down from the 20-day EMA, the sellers will attempt to sink the SOL/USDT pair to the strong support at $116.On the contrary, if bulls push the price above the 20-day EMA, the pair could rise to the resistance line of the channel. A break and close above the channel will signal a possible change in trend.ADA/USDT Cardano (ADA) turned up from $1.06 on Jan. 10, indicating that bulls are attempting a relief rally. The buyers have pushed the price to the 20-day EMA ($1.27) today.ADA/USDT daily chart. Source: TradingViewThe RSI is attempting to form a bullish divergence, indicating that the bearish momentum may be weakening. If bulls thrust the price above the moving averages, the ADA/USDT pair could rise to the resistance line of the descending channel.Contrary to this assumption, if the price turns down from the moving averages, it will suggest that the sentiment remains negative and traders are selling on rallies. The bears will then make one more attempt to pull the price down to the critical support at $1.XRP/USDTXRP dropped to $0.69 on Jan. 10 but the long tail on the day’s candlestick suggests that bulls bought this dip aggressively. The buyers pushed the price back above the overhead resistance at $0.75 on Jan. 11.XRP/USDT daily chart. Source: TradingViewThe XRP/USDT pair reached the 20-day EMA ($0.80) today but the long wick on the candlestick indicates that bears continue to defend this level. If the price turns down from the current level, the bears will again try to pull the XRP/USDT pair below $0.69. If they manage to do that, the pair could plummet to the Dec. 4 intraday low at $0.60.Conversely, if bulls push the price above the 20-day EMA, the pair could rise to the 50-day SMA ($0.86). A break and close above this resistance could clear the path for a possible up-move to $1.LUNA/USDTTerra’s LUNA token bounced off the support line of the channel on Jan. 10 and broke above the 50-day SMA ($71.99) on Jan. 11. Follow-up buying has pushed the price to the 20-day EMA ($78.12) today.LUNA/USDT daily chart. Source: TradingViewThe bulls will now try to propel the price above the resistance line of the descending channel. A close above the channel will be the first sign that the downtrend could be over. The LUNA/USDT pair will then attempt a rally to $93.81.On the contrary, if the price turns down from the resistance line, the pair could remain inside the channel for a few more days. A break and close below the support line of the channel could indicate the start of a deeper correction.Related: Bitcoin shoots to $44,000 as US inflation hits 7.8% in DecemberDOT/USDTPolkadot (DOT) bounced off the $22.66 support on Jan. 10, indicating that the bulls are defending the support. The rebound has reached the 20-day EMA ($26.85) which could act as a resistance.DOT/USDT daily chart. Source: TradingViewIf the price turns down from the 20-day EMA, the bears will again try to sink and sustain the DOT/USDT pair below the $22.66 support. If they pull it off, the pair could resume its downtrend. The next level to watch on the downside is $16.81.Conversely, if bulls drive the price above the moving averages, the pair could rally to the resistance of the range at $32.78. The buyers will have to push and sustain the price above this level to signal the start of a new up-move.AVAX/USDTAlthough Avalanche (AVAX) closed below the uptrend line of the symmetrical triangle on Jan. 8 and again on Jan. 10, the bears could not sustain the lower levels. This suggests that the bulls bought the dips.AVAX/USDT daily chart. Source: TradingViewThe bulls pushed the price back into the triangle on Jan. 11 and have followed that with another up-move today. The relief rally is likely to face stiff resistance at the moving averages.If the price turns down from this overhead resistance, the bears will make one more attempt to sink and sustain the AVAX/USDT pair below the triangle and the critical support at $75.50. Conversely, if bulls drive and sustain the price above the moving averages, the bulls will sense an opportunity and try to push the pair above the downtrend line of the triangle. DOGE/USDTThe bears attempted to pull Dogecoin (DOGE) below the Dec. 4 intraday low at $0.13 but the bulls thwarted their attempt on Jan. 10. The buyers pushed the price back above $0.15 on Jan. 11 but hit a roadblock at the 20-day EMA ($0.16). DOGE/USDT daily chart. Source: TradingViewThe downsloping moving averages and the RSI in the negative territory suggest that bears have the upper hand. If the price turns down from the 20-day EMA, the bears will attempt to pull the price below $0.13. If they succeed, the DOGE/USDT pair could slide to the psychological support at $0.10. This negative view will invalidate if bulls drive and sustain the price above the moving averages. That could indicate a possible change in trend. The bullish momentum may pick up on a break and close above $0.19.The views and opinions expressed here are solely those of the author and do not necessarily reflect the views of Cointelegraph. Every investment and trading move involves risk. You should conduct your own research when making a decision.Market data is provided by HitBTC exchange.

Čítaj viac

Price analysis 1/10: BTC, ETH, BNB, SOL, ADA, XRP, LUNA, DOT, AVAX, DOGE

Bitcoin (BTC) dipped below the $40,000 level on Jan. 10 for the first time since September 2021. The crypto markets were not alone as the U.S. equity markets also witnessed strong selling when traders chose to reduce risk and piled into the 10-year Treasury yield which surged to 1.8% from 1.51% at the end of 2021.On Jan. 9, Goldman Sachs chief economist, Jan Hatzius, said that the U.S. Federal Reserve may increase rates by four quarter-percentage points in 2022. Analyst Alex Krüeger also warned that crypto markets may not be able to ignore the Fed if it “decides to go all out wielding a deflationary machete.” He was not alone as ex-BitMEX CEO Arthur Hayes and Pentoshi also projected a bearish picture.Daily cryptocurrency market performance. Source: Coin360Quant analyst Benjamin Cowen gave some hopes to the bulls when he said that levels of “extreme fear” on the Crypto Fear & Greed Index occurred only four times since 2018 and those were followed by bullish reversals resulting in strong returns between 17% to 1,585% in Bitcoin.Could Bitcoin and major altcoins start a sustained recovery or will the support levels give way? Let’s study the charts of the top-10 cryptocurrencies to find out.BTC/USDTBitcoin plunged to $39,650 today when buyers stepped in and bought aggressively as seen from the long tail on the candlestick. If buyers sustain the rebound, the price could attempt to move toward the 20-day exponential moving average ($45,369).BTC/USDT daily chart. Source: TradingViewBoth moving averages are sloping down and the relative strength index (RSI) is in the oversold zone suggesting that bears are in command. If the price turns down from the 20-day EMA, the BTC/USDT pair could again drop to the strong support at $39,600 and remain range-bound between these two levels for a few days.If the support at $39,600 gives way, the selling could intensify further and the pair could start its march toward $30,000.Conversely, if bulls drive the price above the 20-day EMA, the pair could rally to the stiff overhead resistance at $52,088. A break and close above this resistance could signal a possible change in trend.ETH/USDTThe bulls have been defending the support line of the descending channel for the past few days but they have not been able to achieve a strong rebound off it. This suggests that demand dries up at higher levels. Ether (ETH) attempted a recovery on Jan. 9, but it could not rise above the breakdown level at $3,250.ETH/USDT daily chart. Source: TradingViewThe price has turned down again today and the bears are attempting to pull the ETH/USDT pair below the descending channel. If they manage to do that, the selling could intensify and the pair could drop to the next strong support at $2,652.This is an important support for the bulls to defend because if it cracks, the pair could plummet toward the psychological support at $2,000.Conversely, if the price rebounds off the current level, the bulls will make one more attempt to clear the overhead hurdle at $3,250 and push the pair to the resistance line of the channel.BNB/USDTBinance Coin (BNB) slipped below the support line of the descending channel on Jan. 8 but the long tail on the day’s candlestick showed buying at lower levels. The bulls pushed the price back into the channel on Jan. 9 but failed to sustain the price above the breakdown level at $435.30.BNB/USDT daily chart. Source: TradingViewThe price has turned down once again today and the bears are attempting to sustain the BNB/USDT pair below the channel. If they succeed, the pair could decline to $392.20. This is an important support for the bulls to defend because if it cracks, the next stop could be $330.The RSI has dropped into the oversold territory, indicating that the selling may be overdone in the short term. This could result in a minor recovery or a range-bound action in the next few days. A break and close above the 20-day EMA ($492) will be the first sign that the sellers may be losing their grip.SOL/USDTSolana (SOL) attempted a recovery on Jan. 8 but the bulls could not push the price back above $150. This suggests that bears are selling on relief rallies.SOL/USDT daily chart. Source: TradingViewIf bears sustain the price below $133, the SOL/USDT pair could drop to the strong support at $116. Both moving averages are sloping down and the RSI is close to the oversold zone, indicating that bears are in control.If the $116 level cracks, the pair could decline to the support line of the channel. If this support also breaks down, the selling may intensify and the pair could plummet to $82. The first sign of strength will be a break and close above the 20-day EMA ($162).ADA/USDT Cardano (ADA) broke and closed below the $1.18 support on Jan. 9 indicating the resumption of the downtrend. The next support on the downside is the critical level at $1.ADA/USDT daily chart. Source: TradingViewThe bulls are likely to defend this level aggressively as it has not been breached for the past several months. If the price rebounds off $1, the pair could rise to the 50-day SMA ($1.39) where the bears are expected to mount a strong resistance.If the price turns down from the moving averages, the bears will make one more attempt to pull the ADA/USDT pair below $1. If they succeed, the selling could pick up momentum and the pair could drop to the support line of the channel.XRP/USDTXRP closed below the $0.75 support on Jan. 8 but rose back above the level on Jan. 9. This suggests that bulls were attempting to trap the aggressive bears, but the recovery attempt was short-lived.XRP/USDT daily chart. Source: TradingViewThe price has turned back below $0.75 today, indicating that bears are selling on every minor rally. The downsloping moving averages and the RSI near the oversold zone indicate that bears are in command.If the price sustains below $0.75, the XRP/USDT pair could drop to the Dec. 4 intraday low at $0.60. The bulls will have to push and sustain the price above the 50-day SMA ($0.87) to signal the start of a stronger recovery.LUNA/USDTTerra’s LUNA token broke below the descending channel pattern on Dec. 8 but the long tail on the day’s candlestick suggests buying at lower levels. The bulls pushed the price back into the channel and above the 50-day SMA ($70) on Dec. 9.LUNA/USDT daily chart. Source: TradingViewThe relief rally hit a barrier at $75.67 and the price has turned down below the 50-day SMA today. This suggests that bears continue to sell on rallies. The 20-day EMA ($78) is sloping down and the RSI is near 43, indicating that bears are in control.If bears pull the price below $62.46, the selling could intensify and the LUNA/USDT pair could drop to $51.84. This bearish view will be negated if the price turns up from the support line of the channel and breaks above the resistance line.Related: Billionaire investor Bill Miller puts 50% of net worth in BitcoinDOT/USDTPolkadot (DOT) attempted a rebound off the strong support at $22.66 but the bulls have not been able to push the price to the 20-day EMA ($26.95). This suggests that demand dries up at higher levels. DOT/USDT daily chart. Source: TradingViewThe downsloping moving averages and the RSI in the negative zone suggest that bears have the upper hand. If bears sink and sustain the price below $22.66, the DOT/USDT pair could start its downward journey to $16.81.Alternatively, if the price rebounds off the current level, the bulls will again try to push the pair above the 20-day EMA. If they manage to do that, the pair could rise to the 50-day SMA ($29.66) and then to the overhead resistance at $32.78.AVAX/USDTAvalanche (AVAX) slipped below the uptrend line of the symmetrical triangle on Jan. 8 but the bears could not build upon this advantage. The bulls pushed the price back into the triangle on Jan. 9.AVAX/USDT daily chart. Source: TradingViewHowever, the recovery was short-lived as the bears have pulled the price back below the triangle. This indicates that the sentiment remains negative and traders are selling on every minor rally.There is a strong support at $75.50 but if it collapses, the AVAX/USDT pair could tumble to $57.02 and then to $50.On the other hand, if the price rebounds off the current level or the $75.50 support and sustains inside the triangle, it will suggest accumulation at lower levels. The pair could then rise to $98 where bears may mount a strong resistance.A break and close above the moving averages could open the doors for a rally to the downtrend line.DOGE/USDTDogecoin (DOGE) has broken below the critical support at $0.15, signaling the start of the next leg of the downtrend. DOGE/USDT daily chart. Source: TradingViewThe downsloping moving averages and the RSI in the oversold territory suggest that the path of least resistance is to the downside. If bears sustain the price below $0.15, the DOGE/USDT pair could drop to the Dec. 4 intraday low at $0.13.Contrary to this assumption, if the price rebounds off the current level, the bulls will try to push the pair above the moving averages. If they do that, it will bring the $0.19 to $0.15 range into play and the pair could rise to $0.19.The bulls will have to push and sustain the price above this resistance to indicate the start of a new up-move.The views and opinions expressed here are solely those of the author and do not necessarily reflect the views of Cointelegraph. Every investment and trading move involves risk. You should conduct your own research when making a decision.Market data is provided by HitBTC exchange.

Čítaj viac

Top 5 cryptocurrencies to watch this week: BTC, LINK, ICP, LEO, ONE

Bitcoin (BTC) and most major altcoins remain under pressure as supports give way and bears sell at each rally attempt. This negative sentiment pulled the Crypto Fear & Greed Index to 10/100 on Jan. 8, one of its lowest readings ever. In comparison, 2021 had started on a bullish note with the reading hitting levels of 93/100, indicating “extreme greed.”This weak opening in the new year has not unnerved Bloomberg Intelligence analyst Mike McGlone who remains bullish. He said in a recent analysis that Bitcoin may rally to $100,000 and Ether (ETH) to $5,000 this year. Crypto market data daily view. Source: Coin360However, some analysts argue that Bitcoin may struggle to maintain its bullish trend in an environment where interest rates are rising. Holger Zschaepitz questioned whether Bitcoin could hold up without “rock-bottom rates and trillions of dollars in central bank money and government stimmy.”Could Bitcoin bounce off the strong support, attracting buying in select altcoins? Let’s study the charts of the top-5 cryptocurrencies that may remain positive in the short term.BTC/USDTBitcoin’s downtrend has reached the strong support at $39,600. The price formed a Doji candlestick pattern on Jan. 8, indicating indecision among the bulls and the bears.BTC/USDT daily chart. Source: TradingViewBoth moving averages are sloping down and the relative strength index (RSI) is near the oversold zone, indicating that the path of least resistance is to the downside. If bears pull the price below $39,600, the selling could intensify and the BTC/USDT pair could start its journey to the next strong support at $28,805.On the other hand, if the price rises from the current level, the pair could rise to the 20-day exponential moving average ($45,876). If the price turns down from this level, it will suggest that the sentiment remains negative and traders are selling on rallies. That will increase the likelihood of a break below $39,600 I .The bulls will have to push and sustain the price above the moving averages to indicate a possible change in trend.BTC/USDT 4-hour chart. Source: TradingViewThe 4-hour chart shows that the selling momentum picked up on a break and close below $45,456. The bulls are attempting to arrest the decline at $40,501 but the recovery attempt is likely to face strong selling near the 20-EMA.If the price turns down from the 20-EMA, the bears will attempt to sink the pair below $39,600 and extend the downtrend.Alternatively, a break and close above the 20-EMA could push the pair to the 50-simple moving average. If bulls push the price above this resistance, it will suggest that bears may be losing their grip.LINK/USDTChainlink (LINK) has been trading in a large range between $15 and $35.33 for the past few months. The bulls have pushed the price above the moving averages and the RSI has risen close to the overbought zone, indicating that buyers have the upper hand in the short term.LINK/USDT daily chart. Source: TradingViewThe bears posed a strong challenge near $27.61 for the past few days but the bulls did not allow the price to dip below the 20-day EMA ($23.23). This indicates that the sentiment has changed from sell on rallies to buy on dips.If bulls maintain the price above $27.61, the LINK/USDT pair could rise to 30 and thereafter to the overhead resistance at $35.33. This bullish view will invalidate if the price turns down from the current level and breaks below the moving averages. The pair could then drop to $18.LINK/USDT 4-hour chart. Source: TradingViewThe 4-hour chart shows that the price has broken above the overhead resistance at $27.61. The bears will now attempt to stall the up-move at $30. If the subsequent correction does not break below $27.61, it will increase the possibility of a rally to $35.33.On the contrary, if the price turns down from the current level, it will suggest that the break above $27.61 may have been a bull trap. The bears will then try to pull the price below the 50-SMA. If they do that, the next stop could be $22.ICP/USDTInternet Computer (ICP) broke and closed above the downtrend line on Jan. 4 which was the first indication that the downtrend could be ending. The bears tried to trap the aggressive bulls and pull the price back below the 20-day EMA ($29) but failed.ICP/USDT daily chart. Source: TradingViewThe bulls again pushed and closed the price above the downtrend line on Jan. 8. The moving averages are on the verge of a bullish crossover and the RSI has jumped into the positive zone, indicating that bulls are attempting a comeback.If buyers push and sustain the price above $38.02, the ICP/USDT pair could rally to $45.79. This level may again act as a stiff hurdle but if crossed, the up-move may reach $58.30.Contrary to this assumption, if the price turns down from the current level and breaks below the 20-day EMA, it will indicate that the breakout above the downtrend line may have been a bull trap.ICP/USDT 4-hour chart. Source: TradingViewThe 4-hour chart shows that bulls have pushed the price above $33.29 but are struggling to clear the hurdle at $38.02. This suggests that bears continue to sell near the overhead resistance. This has kept the pair sandwiched between the two levels.If bulls push and sustain the price above $38.02, the pair could extend its up-move. On the contrary, if the price turns down from the overhead resistance, the bears will attempt to pull the pair below $33.29. If they manage to do that, the pair could drop to the 50-SMA.Related: Even after the pullback, this crypto trading algo’s $100 bag is now worth $20,673LEO/USDUNUS SED LEO (LEO) has been trading in a gradual uptrend for the past several weeks where the 50-day SMA ($3.55) has been acting as a strong support. LEO/USD daily chart. Source: TradingViewThe bears attempted to pull the price below the 50-day SMA on Jan. 7 but the bulls did not relent. This resulted in a strong rebound on Jan. 8 which pushed the LEO/USD pair back above the 20-day EMA ($3.69).The bulls will now attempt to drive the price above the all-time high at $3.92. If they succeed, the pair may resume its uptrend and reach $4.25. This positive view will invalidate if the price turns down and plummets below the 50-day SMA. That could start a correction to $3.40.LEO/USD 4-hour chart. Source: TradingViewThe pair has been trading inside an ascending channel pattern. The bears mounted a strong resistance near $3.85, which may have attracted profit-booking from short-term traders. That pulled the pair down to the support line of the channel where buyers stepped in and arrested the decline.The bulls are again attempting to push and sustain the price above $3.85. If they manage to do that, the pair could start its journey toward the resistance line of the channel. The bears will have to sink and sustain the price below the channel to invalidate the bullish view. ONE/USDTHarmony (ONE) has been trading between the 20-day EMA ($0.27) and $0.33 for the past few days. This suggests that bulls are buying on dips and bears are selling on rallies.ONE/USDT daily chart. Source: TradingViewThe rising 20-day EMA and the RSI in the positive territory suggest advantage to buyers. If bulls drive the price above $0.33, the up-move could resume. The ONE/USDT pair could then attempt to rise to $0.38.Contrary to the assumption, if the price breaks below the 20-day EMA, it will suggest that bears have overpowered the bulls. That could pull the pair down to the 50-day SMA ($0.24) and later to $0.21.ONE/USDT 4-hour chart. Source: TradingViewThe 4-hour chart has been rising inside an ascending channel pattern. Although bulls pushed the price above the channel, they could not sustain the higher levels. This suggests that bears tried to trap the aggressive bulls.The price dipped back into the channel but a minor positive is that it bounced off the 50-SMA. This indicates that sentiment remains positive and bulls are buying on dips.If the price rises above the 20-EMA, the pair could again rally to the resistance line of the channel. A break and close above this level could signal a pick up in momentum. Conversely, a break and close below the 50-SMA could pull the pair down to the support line of the channel.The views and opinions expressed here are solely those of the author and do not necessarily reflect the views of Cointelegraph. Every investment and trading move involves risk, you should conduct your own research when making a decision.

Čítaj viac

Price analysis 1/7: BTC, ETH, BNB, SOL, ADA, XRP, LUNA, DOT, AVAX, DOGE

Bitcoin (BTC) and the U.S. equity markets fell sharply on Jan. 5, reacting negatively to the minutes from the Federal Reserve’s December FOMC meeting, which showed that the members expect the balance sheet reduction to start after the Fed begins hiking interest rates in early 2022.Adding to the negative sentiment was the shutdown of the world’s second-biggest Bitcoin mining hub in Kazakhstan, where the internet has been shut down following massive protests by citizens. This caused a dip of about 13.4% in the Bitcoin network’s overall hash rate from 205,000 petahash per second (PH/s) to 177,330 PH/s.Daily cryptocurrency market performance. Source: Coin360According to Galaxy Digital Holdings CEO Mike Novogratz, the current decline was with low volumes and he believes that the markets will be volatile in the next few days. Novogratz suggests that a huge amount of “institutional demand” was waiting on the sidelines and he expects Bitcoin to bottom out in the $38,000 to $40,000 zone.Could Bitcoin and major altcoins continue to face selling or will they bounce off strong support levels? Let’s study the charts of the top 10 cryptocurrencies to find out.BTC/USDTThe range-bound action in Bitcoin resolved to the downside on Jan. 5 when bears pulled the price below the strong support at $45,456. This suggests that supply exceeds demand.BTC/USDT daily chart. Source: TradingViewThere was a meek attempt to defend the $42,500 support on Jan. 6 but sustained selling has pulled the price close to the next support at $39,600. This leg down has invalidated the positive divergence that was forming on the relative strength index (RSI). The downsloping moving averages and the RSI near the oversold zone suggest that bears are in control. If bears sink and sustain the price below $39,600, the BTC/USDT pair could nosedive to $30,000.On the contrary, if the price rebounds off $39,600, the bulls will again try to push the pair above the 20-day exponential moving average (EMA) ($46,811). Such a move will be the first indication that the downtrend could be ending.The bullish momentum could pick up on a break and close above the 50-day simple moving average (SMA) ($50,610).ETH/USDTEther (ETH) turned down from the 20-day EMA ($3,756) on Jan. 5 and plunged below the Dec. 4 intraday low at $3,503.68. This suggests that bears have reasserted their supremacy. ETH/USDT daily chart. Source: TradingViewThe downsloping moving averages and the RSI in the oversold zone suggest that bears are in command. If bears sustain the price below $3,250, the decline could extend to the support line of the channel.The bulls will attempt to defend this level and push the price to the resistance line of the channel. A break and close above the channel will signal a change in trend.Alternatively, if bears sink the price below the channel, the ETH/USDT pair could decline to the strong support at $2,652. BNB/USDTBinance Coin (BNB) broke below the strong psychological support at $500 on Jan. 5. Follow-up selling has pulled the price to the next support at $435.30.BNB/USDT daily chart. Source: TradingViewIf the price bounces off the current level, the BNB/USDT pair could rally to $500 where the bears are likely to mount a stiff resistance. The downsloping moving averages and the RSI in the oversold zone suggest that bears are in control.If the $435.30 support gives way, the pair could extend its decline to $392.20 and later to $320. This negative view will be negated if the price breaks and sustains above the channel. Such a move could open the doors for a possible move to $575. SOL/USDTSolana (SOL) plummeted below $167.88 and the Dec. 13 intraday low at $148.04 on Jan. 5. This indicated that bears have reasserted their dominance. SOL/USDT daily chart. Source: TradingViewThe selling has continued and the bears will now try to pull the SOL/USDT pair to the strong support at $116. This level could attract strong buying from the bulls but the relief rally is likely to face selling near the 20-day EMA ($170).Such a move will indicate that the sentiment remains negative and traders are selling on rallies. That could increase the likelihood of a break below $116. The next stop may be the support line of the channel.The buyers will have to push and sustain the pair above the resistance line of the channel to signal that the downtrend could be ending.ADA/USDT Cardano (ADA) turned down from the 20-day EMA ($1.33) on Jan. 5 and dropped to the strong support at $1.18. The bulls have successfully defended this level but have failed to push the price above the 20-day EMA.ADA/USDT daily chart. Source: TradingViewIf bears pull the price below $1.18, the ADA/USDT pair could drop to the critical support at $1. This is an important support to watch out for because if it cracks, the selling momentum could pick up and the pair could slide to $0.68.On the contrary, if bulls drive the price above the moving averages, the pair could rise to the resistance line of the channel. A break and close above the channel will signal a possible change in trend. The pair could then rally to $1.87.XRP/USDTRipple (XRP) broke below the $0.75 support on Jan. 5 but the long tail on the candlestick suggests that bulls purchased this dip. However, a minor negative is that the buyers have not been able to build upon the rebound.XRP/USDT daily chart. Source: TradingViewThe XRP/USDT pair formed a Doji candlestick pattern on Jan. 8 and the bulls are currently attempting to sink the price below $0.75. If that happens, the downtrend could resume and the pair may drop to $0.60.The downsloping moving averages and the RSI in the negative zone indicate that bears are in command. Contrary to this assumption, if the price rebounds off the current level, the bulls will attempt to push the pair above the moving averages.If they succeed, it will suggest that the selling pressure may be reducing. The pair could then rise to $1.LUNA/USDTTerra’s LUNA token plummeted below the 20-day EMA ($81) on Jan. 5, indicating that short-term traders may have booked profits after bulls failed to clear the hurdle at $93.81.LUNA/USDT daily chart. Source: TradingViewThe bears have pulled the price to the 50-day SMA ($69), which may act as a strong support. If the price rebounds off the current level, the bulls will try to push the LUNA/USDT pair to the downtrend line of the descending channel.A break and close above the channel will indicate that the correction may be over. The bulls will then try to push the price to $93.81. On the contrary, a break and close below the 50-day SMA could intensify selling and the pair may drop to the psychological support at $50.Related: Bitcoin and Ether heading $100K and $5K in 2022: Bloomberg IntelligenceDOT/USDTPolkadot (DOT) is range-bound in a downtrend. The price has been oscillating between $22.66 and $32.78 for the past few days. DOT/USDT daily chart. Source: TradingViewThe 20-day EMA ($28) has started to turn down and the RSI has dipped into the negative territory, suggesting that bears have the upper hand. If sellers sink and sustain the price below $22.66, the DOT/USDT pair could plunge to $16.81.Contrary to this assumption, if the price rebounds off $22.66, the bulls will try to push the pair to $32.78. A break and close above this level could signal a possible change in trend. The pair could first rise to $40 and later to $44.AVAX/USDTAvalanche (AVAX) broke below the $98 support on Jan. 5 and dropped to the uptrend line of the symmetrical triangle on Jan. 7. The bulls will attempt to defend this level and push the price back to the downtrend line.AVAX/USDT daily chart. Source: TradingViewThe 20-day EMA ($104) has turned down and the RSI is below 38, indicating that rallies are likely to be sold into. If the bounce off the current level turns down either from $98 or from the 20-day EMA, the possibility of a break below the triangle increases.The AVAX/USDT pair could then decline to the $75.50 support where the bulls will try to arrest the decline. This negative view will invalidate if the price turns up and breaks above the triangle. The pair could then rise to $128.DOGE/USDTDogecoin (DOGE) dipped below the $0.15 support on Jan. 5 but the long tail on the candlestick shows that bulls defended this level. That was followed by a Doji candlestick pattern on Jan. 6, indicating indecision among the bulls and the bears.DOGE/USDT daily chart. Source: TradingViewThe bears tried to resolve the uncertainty to the downside on Jan. 7 but the bulls are not willing to relent. However, unless buyers quickly push the DOGE/USDT pair above the 20-day EMA ($0.17), the risk of a break and close below $0.15 increases.If that happens, the pair could slide to $0.13 and then to $0.10. Alternatively, if bulls push the price above the 20-day EMA, it will suggest that buyers are attempting a comeback. The pair could then rise to $0.19 and if bulls clear this hurdle, the rally may extend to $0.22.The views and opinions expressed here are solely those of the author and do not necessarily reflect the views of Cointelegraph. Every investment and trading move involves risk. You should conduct your own research when making a decision.Market data is provided by HitBTC exchange.

Čítaj viac

Získaj BONUS 8 € v Bitcoinoch

nakup bitcoin z karty

Registrácia Binance

Burza Binance

Aktuálne kurzy