Autor Cointelegraph By Rakesh Upadhyay

Top 5 cryptocurrencies to watch this week: BTC, LUNA, ATOM, ACH*, FTM

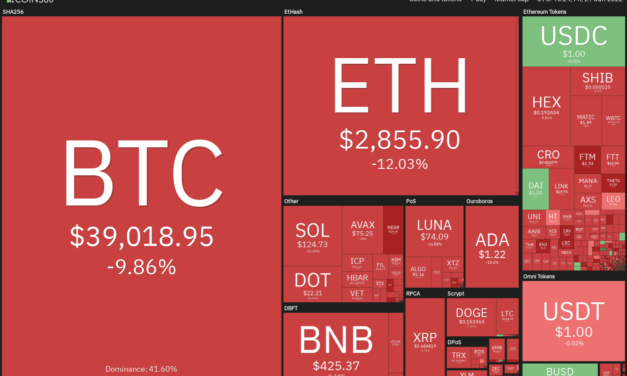
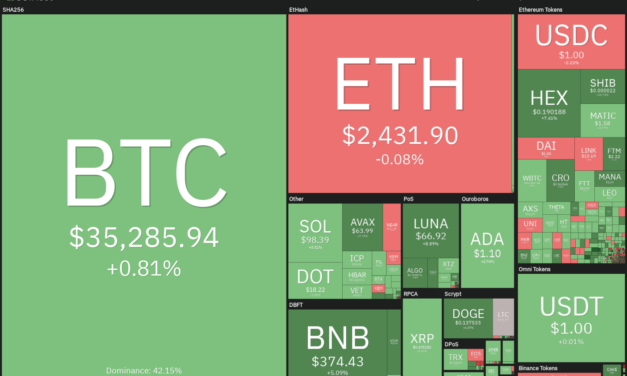
Bitcoin (BTC) fell close to $34,000 on Jan. 21, which reflects a 50% decline from the $69,000 all-time high made on Nov. 10, 2021. Altcoins also could not buck the trend and faced intense selling pressure, which pulled the total crypto market capitalization to $1.6 trillion, a 46% decline from its November 2021 all-time high near $3 trillion.It is not only the crypto markets that are facing selling by investors. The S&P 500 has also plummeted 8% year-to-date. However, gold has outperformed and risen about 1.76% during the period, cementing its billing as a safe haven asset.Crypto market data daily view. Source: Coin360Several retail traders who purchased Bitcoin near its all-time high are voicing their concerns on social media. However, El Salvador’s President Nayib Bukele does not seem to be worried by the recent fall as he recently announced a purchase of 410 Bitcoin at an average price of roughly $36,585 per coin.Could Bitcoin and altcoins witness a bounce after the recent carnage? Let’s study the charts of the top-5 cryptocurrencies that may outperform if a relief rally starts.BTC/USDTBitcoin plunged below the $39,600 to $37,332. support zone on Jan. 21, indicating panic selling. The selling continued on Jan. 22 and the price dipped to $34,008.BTC/USDT daily chart. Source: TradingViewThe sharp fall of the past few days has pulled the relative strength index (RSI) near the 20 level, suggesting that the selling may have been overdone in the short term. Usually, such oversold levels are followed by a consolidation or relief rally.Recovery attempts are likely to face strong resistance in the overhead zone. If the $37,332 to $39,600 zone flips into resistance, it will signal that the sentiment remains negative and traders are selling on rallies.The bears will then attempt to resume the downtrend and sink the BTC/USDT pair to the major support at $30,000. A break and close above the 20-day exponential moving average ($41,427) will be the first indication that bears may be losing their grip.BTC/USDT 4-hour chart. Source: TradingViewThe 4-hour chart shows that the pair is trading inside a descending channel pattern. The bears pulled the price below the channel but have not been able to sustain the lower levels. This suggests strong buying by the bulls who have pushed the price back into the channel.The pair could rise to the 20-EMA where the bears may again pose a stiff challenge. If the price turns down from this resistance and plummets below $34,008, the selling could intensify. Conversely, a break above the 20-EMA could open the doors for a possible rise to the resistance line of the channel.LUNA/USDTTerra’s LUNA token has been trading inside a descending channel for the past few days. The price dropped to the support line of the channel on Jan. 22 but the bulls purchased this dip aggressively as seen from the long tail on the day’s candlestick.LUNA/USDT daily chart. Source: TradingViewThe LUNA/USDT pair could attempt a pullback to the moving averages and then to the downtrend line of the channel. If bulls propel the price above the channel, the pair could rise toward $87.90 and later to $93.81.Contrary to this assumption, if the price turns down from the current level or the moving averages, it will suggest that bears are selling on every minor rally. The pair could then retest the support line of the channel. A break below this support could accelerate the selling.LUNA/USDT 4-hour chart. Source: TradingViewThe 4-hour chart shows that the relief rally has reached the 20-EMA which is an important level to watch out for. The marginally downsloping 20-EMA and RSI just below the midpoint indicate a minor advantage to bears.If bulls drive the price above the 20-EMA, the pair could attempt a rally toward the downtrend line of the channel. Alternatively, if the price turns down from the current level, the bears will fancy their chances and strive to pull the pair to the support line of the channel. ATOM/USDTCosmos (ATOM) turned down from the overhead resistance at $40 on Jan. 17 and plummeted to the 200-day simple moving average ($27.57) on Jan. 22. ATOM/USDT daily chart. Source: TradingViewThe ATOM/USDT pair has rebounded sharply off the 200-day SMA, suggesting that bulls are defending this level aggressively. The buyers will now try to push the price to the 20-day EMA ($35.91). A break and close above this level could indicate that the correction may be over. The pair could then rally to the critical overhead resistance at $44.80. This positive view will invalidate if the price turns down from the current level or the 20-day EMA and breaks below the 200-day SMA. Such a move could open the door for a possible drop to $20.ATOM/USDT 4-hour chart. Source: TradingViewThe 4-hour chart shows a double top formation, which completed on a break and close below $34. This topping out pattern has a target objective of $23.20 and the pair plunged to an intraday low at $27.31.The relief rally from the lower levels is facing stiff resistance at the breakdown level at $34. If bulls push and sustain the price above this resistance, the pair could rise to the downtrend line. A break and close above this line will suggest a possible change in trend. Related: How to pick or analyze altcoins?ACH/USDTAlchemy Pay (ACH) aims to bridge the gap between the crypto and fiat world by achieving seamless transactions between the two economies. Its recent partnership with MEXC Global will provide users with several payment options in Japan, Korea, and Indonesia.Alchemy Pay also teamed up with Algorand and Avalanche to bring direct fiat payment channels such as Visa, Mastercard, PayPal and several local payment channels to their network.A new partnership with NIUM will help Alchemy Pay lower costs for its clients in the 190+ countries where NIUM operates. NIUM’s licences in financially important regions such as the United Kingdom, Europe, U.S., Singapore, Hong Kong and Australia, will assist Alchemy Pay in penetrating these markets.The network added support to Dai after a new collaboration with MakerDAO and also announced a partnership with IoTeX (IOTX). The integration enables IOTX to be used for business-to-business (B2B) or customer-to-business (C2B) payments in several parts of the world.The project’s multiple partnerships have helped it to expand its support to more than 70 countries with 300 payment channels reaching more than 2 million merchants. ACH was also listed on Binance exchange on Jan. 10, making it easier for a larger pool of traders to transact the coin ACH has been steadily declining since hitting an all-time high in August 2021. This suggests that traders have been booking profits on rallies.ACH/USDT daily chart. Source: TradingViewTHE ACH/USDT pair plunged below the strong support zone at $0.056 to $0.045 on Jan. 21, but a minor positive is that bears could not build upon this advantage. This indicates strong demand at lower levels.If buyers push the price back above the overhead zone, several aggressive bears who may have sold recently may get trapped. This could result in a short squeeze which may push the pair to the downtrend line of the descending triangle. The bullish momentum could pick up on a break and close above the triangle. On the other hand, if the price turns down from the overhead zone, it will suggest a change in sentiment from buy on dips to sell on rallies. The bears will then attempt to sink the price below $0.03 and resume the downtrend. FTM/USDTFantom (FTM) broke above the $3.17 overhead resistance on Jan. 16 but could not clear the next hurdle at $3.48. This may have attracted profit-booking by traders, resulting in a sharp pullback. FTM/USDT daily chart. Source: TradingViewThe bears pulled the price below the 50-day SMA ($2.14) on Jan. 22 but could not sink the FTM/USDT pair to the 200-day SMA ($1.57). Strong buying by the bulls has pushed the pair back above the 50-day SMA.The bulls will now try to push and sustain the price above the 20-day EMA. If they manage to do that, the pair could retest the overhead zone. Conversely, if the price turns down from the current level or the 20-day EMA, it will suggest that traders are selling on rallies. The bears will then try to pull the pair below the 200-day SMA.FTM/USDT 4-hour chart. Source: TradingViewThe 4-hour chart shows the formation of a head-and-shoulders pattern, which had a target objective at $1.70. The pair bounced from $1.77 and has reached the 20-EMA, which is acting as a stiff resistance.If the price turns down from the current level, the bears will try to resume the downtrend and sink the pair to $1.30. Conversely, if the price rises and sustains above the 20-EMA, the pair could rally to the neckline of the bearish setup and then rise to $3.00.LEO/USDUNUS SED LEO (LEO) plunged and closed below the ascending channel pattern on Jan.21 but a minor positive is that bulls bought at lower levels and are attempting to push the price back above the moving averages.LEO/USD daily chart. Source: TradingViewIf they succeed, the LEO/USD pair could retest the overhead resistance at $3.92. A break and close above this level could indicate the resumption of the uptrend. The pair could then rise to the resistance line of the channel. If bulls thrust the price above the channel, the pair could pick up momentum. This positive view will invalidate if the price turns down from the current level and breaks below $3.37. The pair could then drop to the strong support at the 200-day SMA ($3.19).LEO/USD 4-hour chart. Source: TradingViewThe 4-hour chart shows that bulls repeatedly attempted to push and sustain the price above the overhead resistance at $3.85 but failed. This may have attracted profit-booking, resulting in a decline to the strong support at $3.40.The sharp rebound off $3.40 indicates aggressive buying at the level. The bulls will now try to push the price to $3.85. If bulls clear the overhead zone between $3.85 to $3.92, the uptrend could resume. This positive view will invalidate on a break and close below $3.40.The views and opinions expressed here are solely those of the author and do not necessarily reflect the views of Cointelegraph. Every investment and trading move involves risk, you should conduct your own research when making a decision.*Disclaimer: ACH is a featured cryptocurrency from one of Cointelegraph’s sponsors, its inclusion did not affect this price analysis.

Čítaj viac

Price analysis 1/21: BTC, ETH, BNB, ADA, SOL, XRP, LUNA, DOT, AVAX, DOGE

Bitcoin (BTC) and most major altcoins continue to witness a bloodbath on Jan. 21 and the result of the most recent downturn has been a $200 billion reduction in market capitalization. A new report by Huobi Research, in collaboration with Blockchain Association Singapore, forecast Bitcoin to enter a bear market in 2022. The liquidity tightening measures undertaken by the U.S. Federal Reserve and other central banks across the world and the regulatory action by authorities could play spoilsport and keep crypto prices under check.Daily cryptocurrency market performance. Source: Coin360The calls for a bear market have not shaken up the resolve of MicroStrategy CEO Michael Saylor who is determined to hold on to the company’s Bitcoin holdings. Saylor said in a recent interview with Bloomberg that the firm’s strategy is to acquire and hold Bitcoin and not sell.Could Bitcoin and most major altcoins start a relief rally from their strong support levels? Let’s study the charts of the top-10 cryptocurrencies to find out.BTC/USDTBitcoin attempted a recovery on Jan. 20 when bulls pushed the price to the 20-day exponential moving average ($43,041). However, the bears had other plans as they sold this rise and pushed the price lower as seen by the long wick on the day’s candlestick.BTC/USDT daily chart. Source: TradingViewThe selling continued today and the BTC/USDT pair has broken below the strong support at $39,600. There is a minor support at $37,332.70. The bulls are likely to defend this support zone with all their might. The oversold level on the relative strength index (RSI) also points to a possible consolidation or a rebound. If the subsequent relief rally rises above the 50-day simple moving average (SMA), it will indicate that the downtrend may be over.Conversely, if the price plummets below the support zone, the bearish momentum could pick up and the pair may slide to $30,000.ETH/USDTEther’s (ETH) long wick on the Jan. 20 candlestick indicates that the trend remains negative and traders are selling on relief rallies to strong resistance levels. ETH/USDT daily chart. Source: TradingViewThe selling has continued today and bears have pulled the price below the immediate support at $2,928.83. This opens up the doors for a possible drop to $2,652 where buyers are anticipated to mount a strong defense.If the price bounces off $2,652, the bulls will again try to push the ETH/USDT pair above the 20-day EMA and the resistance line of the channel. If that happens, the pair could signal a change in trend.Conversely, if bears sink and sustain the price below $2,652, the selling could accelerate and the pair may drop to $2,000.BNB/USDTBinance Coin (BNB) turned down from the 20-day EMA ($474) on Jan. 20, indicating that bears are defending this resistance aggressively. The sellers will now try to pull the price below the Jan. 10 intraday low at $405.60.BNB/USDT daily chart. Source: TradingViewThe downsloping moving averages and the RSI in the negative territory indicate advantage to bears. If the price sustains below $405.60 and the descending channel, the selling could intensify and the pair may drop to $325.Conversely, if the price rebounds off $405.60 or the support line of the channel, the bulls will again attempt to push the BNB/USDT pair above the 20-day EMA and the resistance line of the channel. If they do that, it will signal a possible change in trend.ADA/USDT Cardano (ADA) broke and closed below the moving averages on Jan. 20. The long wick on the day’s candlestick showed that bears continue to sell on rallies.ADA/USDT daily chart. Source: TradingViewIf bears sustain the price below the moving averages, the ADA/USDT pair could drop to the critical support at $1. This is an important support to watch out for because it has not been breached on a closing basis for about ten months.If the price turns up from the current level and breaks above the moving averages, it will indicate that traders are accumulating on dips. The buyers will have to push and sustain the pair above the descending channel to signal a possible change in trend.SOL/USDTSolana (SOL) formed an outside day candlestick pattern on Jan. 20. Traders sold aggressively at higher levels and pulled the price below the immediate support at $130.SOL/USDT daily chart. Source: TradingViewThe SOL/USDT pair has dropped to the strong support at $116. If this level also fails to provide support, the decline could extend to the support line of the descending channel. The downsloping moving averages and the RSI in the oversold zone, suggest the path of least resistance is to the downside.Alternatively, if the price turns up from $116, the bulls will again try to overcome the barrier at the 20-day EMA ($146). If they manage to do that, the pair could rise to the resistance line. A break and close above the channel could signal a change in trend.XRP/USDTRipple (XRP) broke and closed below the $0.75 support on Jan. 19. The bulls tried to reclaim the level on Jan. 20 but the long wick on the candlestick shows that bears continue to sell on rallies.XRP/USDT daily chart. Source: TradingViewThe XRP/USDT pair has broken below the support at $0.69. If bears sustain the lower levels, the pair could extend its decline to $0.60. The downsloping moving averages and the RSI near the oversold territory indicate that sellers are in control.This negative view will invalidate if the price turns up from the current level and breaks above the moving averages. Such a move could suggest accumulation at lower levels. The pair could then start its up-move toward $1.LUNA/USDTTerra’s LUNA token once again turned down from the downtrend line on Jan. 20, indicating that bears continue to defend this level with vigor. LUNA/USDT daily chart. Source: TradingViewAlthough the 20-day ($79) is flattish, the RSI has slipped below 46, indicating that bears have a slight advantage. If the price sustains below $73.95, the LUNA/USDT pair could start its decline toward the critical support at $62.46.Contrary to this assumption, if the price rebounds off the current level, the bulls will again try to push the pair above the downtrend line. If they succeed, it will indicate that the correction may be over. The pair could rally to $93.81.Related: 3 wildest theories explaining $500B crypto market crashDOT/USDTPolkadot (DOT) has dipped below the critical support at $22.66, which is an important level to keep an eye on because it has not been breached on a closing basis since mid-August of last year.DOT/USDT daily chart. Source: TradingViewIf the price rebounds off the current level, the bulls will again attempt to clear the overhead hurdle at the moving averages. A break and close above the 50-day SMA ($27.08) will be the first indication that the selling pressure may be reducing. The bulls will have to push and sustain the price above $32.78 to signal a possible change in trend.Conversely, if the DOT/USDT pair sustains below $22.66, it will suggest that supply exceeds demand and traders are rushing to the exit. The pair could then drop to the next support at $16.81.AVAX/USDTAvalanche (AVAX) turned down from close to the 20-day EMA ($90) on Jan. 20 and broke below the strong support at $75.50 today.AVAX/USDT daily chart. Source: TradingViewThe downsloping moving averages and the RSI in the negative zone indicate that bears are in command. A close below $75.50 will complete a descending triangle pattern, signaling that a top may be in place. The AVAX/USDT pair could then start its decline toward $50.However, the bulls are unlikely to surrender without putting up a strong fight. If the price rebounds off the current level, the pair could recover to the 20-day EMA and later to the downtrend line. The bulls will have to clear this hurdle to signal a possible end to the corrective phase.DOGE/USDTThe bulls tried to push Dogecoin (DOGE) back above the moving averages on Jan. 20 but failed. This suggests that sentiment remains negative and bears are selling near resistance levels.DOGE/USDT daily chart. Source: TradingViewThe DOGE/USDT pair could now gradually drop toward the strong support at $0.13 where the buyers may step in to arrest the decline. If the price rebounds off this level and rises above the moving averages, it will suggest that the range-bound action may continue for a few more days.The critical level to watch on the upside is $0.19 and $0.13 on the downside. The next trending move could start after the price breaks out of either level. Until then, volatile random moves inside the range may continue.The views and opinions expressed here are solely those of the author and do not necessarily reflect the views of Cointelegraph. Every investment and trading move involves risk. You should conduct your own research when making a decision.Market data is provided by HitBTC exchange.

Čítaj viac

Price analysis 1/19: BTC, ETH, BNB, ADA, SOL, XRP, LUNA, DOT, AVAX, DOGE

Bitcoin (BTC) and select altcoins are showing signs of some buying near support levels. According to Arcane Research, the seven-day average real Bitcoin trading volume has dropped to the lowest level since July 2021. During the previous instance, the sharp drop in volume marked a bottom and led to a strong rally from August to October 2021.However, Bloomberg Intelligence senior commodity strategist McGlone warned in a recent podcast that risk assets may correct as the United States Federal Reserve increases rates and reduces asset purchases. After the corrective phase is over, McGlone expects Bitcoin to transition from a “risk-on to a risk-off asset” and “come out better off.” Daily cryptocurrency market performance. Source: Coin360In the short term, analysts at Decentrader, a crypto market intelligence firm, expect Bitcoin to stay range-bound between “$44,000 and potentially $38,000 before an eventual breakout.”While analysts are divided on their forecasts for Bitcoin, let’s study the charts of the top-10 cryptocurrencies to find the path of least resistance.BTC/USDTThe bears are attempting to pull Bitcoin toward the strong support at $39,600 but the long tail on the candlesticks of the past two days shows that bulls have other plans. The buyers are buying on dips but a minor negative is that they have not been able to push the price above the 20-day exponential moving average ($43,804).BTC/USDT daily chart. Source: TradingViewBoth moving averages are sloping down and the relative strength index (RSI) remains in the negative zone, indicating that bears have the upper hand. If the price turns down from the current level or the 20-day EMA, the bears will again attempt to sink the BTC/USDT pair to $39,600. This is a key level to keep an eye on in the short term.If this level cracks, the bearish momentum could pick up as several stop-losses could be triggered. That may result in a decline to $30,000.Alternatively, if the price rebounds off the current level or the $39,600 support, the buyers will attempt to push the pair above the moving averages. If the price sustains above the 50-day simple moving average ($47,070), the negative view will invalidate and the pair could rally to the stiff overhead resistance at $52,088.ETH/USDTEther (ETH) has continued its down move and is close to the support at $2,928.83. The bulls may attempt to defend this level and start a relief rally.ETH/USDT daily chart. Source: TradingViewIf that happens, the ETH/USDT pair could rise to the 20-day EMA ($3,381). This is a key resistance to watch out for because a break above it will be the first indication that the bears may be losing steam.A break and close above the channel will signal a possible change in trend. The pair could then start its upward march toward $4,200.On the contrary, if the price turns down from the current level or the 20-day EMA, it will increase the possibility of a break below $2,928.83. If that happens, the pair could slide to the strong support at $2,652.BNB/USDTBinance Coin (BNB) continues to trade inside the descending channel pattern. The 20-day EMA ($485) has started to turn down and the RSI has dipped below 43, suggesting that bears are at an advantage.BNB/USDT daily chart. Source: TradingViewThe bulls are attempting to defend the minor support at $450. If the price rebounds off this level, the buyers will make one more attempt to clear the overhead hurdle at $500. If they succeed, it will indicate a possible change in trend.The BNB/USDT pair could then start its northward march toward $572 and later to $617. Alternatively, if the price breaks below $450, the bears will try to pull the BNB/USDT pair to the support line of the channel. ADA/USDT Cardano (ADA) rallied to the resistance line of the descending channel on Jan. 18 but the bulls could not push the price above the channel. This suggests that bears are defending the resistance line aggressively.ADA/USDT daily chart. Source: TradingViewThe ADA/USDT pair has dipped to the moving averages, which could act as a strong support. The moving averages are on the verge of a bullish crossover and the RSI is in the positive territory, indicating advantage to buyers.If the price rebounds off the current level, the bulls will again try to drive the price above the channel and the developing neckline of a possible inverse head and shoulders pattern. If that happens, the pair could start a new uptrend.This positive view will invalidate if the price breaks and sustains below the moving averages. Such a move could pull the pair down to $1.06.SOL/USDTSolana (SOL) has reached near the minor support at $130. The bulls had defended this level on Jan. 10 and may again try to do so during the current decline.SOL/USDT daily chart. Source: TradingViewIf the price rebounds off the support, the bulls will again attempt to push the SOL/USDT pair above the 20-day EMA ($151). If they succeed, the pair could rally to the resistance line of the descending channel. This is an important level to watch out for because a break and close above it will signal the possible start of a new up-move.On the contrary, if the $130 support cracks, the pair could drop to the critical support at $116. A break below this level could pull the price to the support line of the channel.XRP/USDTRipple (XRP) had been stuck between the 20-day EMA ($0.78) and the $0.75 support for the past few days, which has resolved to the downside today. This indicates that bears have overpowered the buyers.XRP/USDT daily chart. Source: TradingViewThe downsloping moving averages and the RSI in the negative territory indicate that the path of least resistance is to the downside. If the price sustains below $0.75, the bears will try to build upon their advantage and sink the XRP/USDT pair to $0.69. Contrary to this assumption, if the price turns up from the current level and rises above the moving averages, it will indicate that bulls are accumulating on dips. That could start a relief rally which could reach the overhead resistance at $1. LUNA/USDTTerra’s LUNA token dipped below the 50-day SMA ($76) on Jan. 18 but the bulls bought the dip and pushed the price back above the 20-day EMA ($80). This is a positive sign as it shows traders are buying on dips.LUNA/USDT daily chart. Source: TradingViewIf the bulls maintain the price above the 20-day EMA, the LUNA/USDT pair could rise to the downtrend line. A break and close above this level will suggest that the selling pressure could be reducing. The pair could then rise to the 61.8% Fibonacci retracement level at $87.88 and later to $93.81.This positive view will invalidate if the price turns down and breaks below $73.95. Such a move will suggest that supply exceeds demand. The pair could then decline to $68.33 and later to $62.46.Related: 43% of Bitcoin trading volume during US market hours: Arcane ResearchDOT/USDTPolkadot (DOT) continues to drift down toward the strong support at $22.66 where the bulls will try to halt the decline. The strength of the rebound off this level could indicate whether the decline is over or not.DOT/USDT daily chart. Source: TradingViewIf the bounce rises above the moving averages, it will suggest accumulation at lower levels. The DOT/USDT pair could then rise to the overhead resistance at $32.78. A break and close above this level will suggest the start of a new uptrend.Conversely, if the price turns down from the moving averages, it will indicate that sentiment remains negative and traders are selling on rallies. That will increase the prospects of a break and close below $22.66. If that happens, the pair could drop to $16.81.AVAX/USDTAvalanche (AVAX) continues to slide toward the strong support at $75.50. The price action of the past few days has formed a descending triangle pattern that will complete on a break and close below $75.50.AVAX/USDT daily chart. Source: TradingViewBoth moving averages are sloping down and the RSI is in the negative territory, indicating that bears have the upper hand. The sellers will have to sink and sustain the price below $75.50 to indicate the start of a new downtrend.The bulls are unlikely to surrender the $75.50 level easily. If the price rebounds off this support, the AVAX/USDT pair could reach the moving averages. If buyers push the price above the moving averages, the pair could rise to the downtrend line. The bulls will have to propel the price above this resistance to indicate a change in trend.DOGE/USDTDogecoin (DOGE) dipped below both moving averages on Jan. 18 which brings the $0.19 to $0.13 range into play. The flattish 20-day EMA ($0.16) and the RSI just below the midpoint suggest a balance between supply and demand.DOGE/USDT daily chart. Source: TradingViewIf the price sustains below the moving averages, the DOGE/USDT pair could gradually drop to $0.15 and if this level also cracks, the decline could extend to $0.13. A break and close below $0.13 will indicate the resumption of the downtrend.Alternatively, if the price turns up and breaks above the moving averages, it will suggest that bulls are buying on dips. The buyers will then attempt to clear the overhead hurdle at $0.19 and push the pair to $0.22.The views and opinions expressed here are solely those of the author and do not necessarily reflect the views of Cointelegraph. Every investment and trading move involves risk. You should conduct your own research when making a decision.Market data is provided by HitBTC exchange.

Čítaj viac

Price analysis 1/17: BTC, ETH, BNB, ADA, SOL, XRP, LUNA, DOT, AVAX, DOGE

Bitcoin’s (BTC) volatility has been shrinking in the past few days. The standard deviation of daily Bitcoin returns for the last 30 and 60 days as calculated by the Bitcoin Volatility Index is at 2.63%, the least volatile it has been since November 2020.Generally, tight ranges are followed by strong price expansions. In 2020, the low volatility period in November was followed by a sharp rally in mid-December, which resulted in a supercycle that carried the price all the way to $64,854 on April 14, 2021.Daily cryptocurrency market performance. Source: Coin360However, there is no certainty that the volatility expansion will happen only to the upside. The price could break out in either direction. Commentator Vince Prince warned that the high leverage ratio of Bitcoin could trigger a big chunk of stop-losses if the $40,000 support breaks down.Could Bitcoin start a new up-move or will bears pull the price below the support levels, triggering a sell-off in altcoins? Let’s study the charts of the top 10 cryptocurrencies to find out.BTC/USDTBitcoin has been trading near the 20-day exponential moving average (EMA) ($44,181) for the past few days. Although bulls have not been able to push the price above this resistance, a minor positive is that they have not given up much ground.BTC/USDT daily chart. Source: TradingViewIf the price turns up from the current level or $41,725.95, the bulls will make one more attempt to clear the overhead resistance at the 20-day EMA and the horizontal resistance at $45,456.If they do that, the pair could rise to the 50-day simple moving average (SMA) ($47,680) where the bulls may again encounter stiff resistance from the bears. A break and close above this resistance could push the pair to $52,088.Conversely, if the price breaks below $41,725.95, the BTC/USDT pair could drop to the strong support at $39,600. This is an important level for the bulls to defend because if it breaks down, the selling could intensify and the pair may plummet toward $30,000.ETH/USDTEther’s (ETH) recovery off the support line of the descending channel fizzled out near the 20-day EMA ($3,439), which suggests that the sentiment remains negative and traders are selling on rallies.ETH/USDT daily chart. Source: TradingViewThe bears will now try to pull the price below $3,188. If they manage to do that, the ETH/USDT pair could drop to $2,928.83. This is an important support to watch out for because if it collapses, the decline could extend to $2,652.Contrary to this assumption, if the price turns up from the current level and breaks above the 20-day EMA, the bulls will try to push the pair above the resistance line of the channel. If that happens, the pair could rise to $4,200. BNB/USDTBinance Coin (BNB) failed to break above the resistance line of the descending channel pattern on Jan. 16. This may have sparked selling by short-term traders, pulling the price below the 20-day EMA ($488).BNB/USDT daily chart. Source: TradingViewIf bears pull the price below $466.50, the BNB/USDT pair could decline toward the support line of the channel. The flat moving averages and the RSI just below the midpoint, indicate equilibrium between the bulls and bears.If the price rebounds off $466.50, the bulls will again try to thrust the price above the channel and the 50-day SMA ($530). If they succeed, it will signal a possible change in trend. The pair could then rally to $572.ADA/USDT Cardano (ADA) broke and closed above the 50-day SMA ($1.34) on Jan. 16, indicating that bulls are attempting a comeback. The price could now reach the resistance line of the descending channel.ADA/USDT daily chart. Source: TradingViewThe moving averages are on the verge of a bullish crossover and the RSI has jumped into the positive zone, indicating that bulls have the upper hand in the short term. If buyers propel and sustain the price above the channel, it will signal a change in trend.The ADA/USDT pair could first rally to $1.87 and if this level is crossed, the next move could be to $2.47. On the other hand, if the price turns down from the resistance line, the pair could again drop to the moving averages.SOL/USDTSolana (SOL) continues to trade inside the descending channel pattern. The bulls attempted to push the price above the 20-day EMA ($154) on Jan. 13 but failed. This suggests that bears are selling on every minor rally.SOL/USDT daily chart. Source: TradingViewThe bears will now attempt to pull the price below the support at $130. If they succeed, the SOL/USDT pair could drop to the strong support at $116. This is an important level for the bulls to defend because a break below it could sink the pair to the support line of the channel.Contrary to this assumption, if the price turns up from the current level and breaks above the 20-day EMA, the pair could rise to the resistance line of the channel. A break and close above the channel will signal a possible change in trend. XRP/USDTRipple (XRP) has been trading between the 20-day EMA ($0.79) and the support at $0.75. This squeeze is soon likely to end in a range expansion.XRP/USDT daily chart. Source: TradingViewIf the price breaks below $0.75, the XRP/USDT pair could resume its downtrend and drop to $0.69 followed by a decline to $0.60. The downsloping moving averages and the RSI in the negative territory indicate advantage to bears.Contrary to this assumption, if the price turns up from $0.75 and breaks above the moving averages, it will suggest accumulation at lower levels. The pair could then start its northward march toward the stiff overhead resistance at $1.LUNA/USDTTerra’s LUNA token could not rise and sustain above the 61.8% Fibonacci retracement level at $87.88 on Jan. 15 and 16. This may have triggered profit-booking by short-term bulls.LUNA/USDT daily chart. Source: TradingViewThe price has turned down to the 20-day EMA ($80.17), which could act as a support. If the price turns up from the current level, the bulls will again try to propel and sustain the LUNA/USDT pair above $87.88. If they succeed, the pair could rally to the 78.6% Fibonacci retracement level at $94.80. Alternatively, if the price slips below both moving averages, it will suggest that traders are rushing to the exit. The pair could then drop to $68.33.Related: Propy rallies 227% as real estate NFTs become reality and PRO lists at CoinbaseDOT/USDTPolkadot (DOT) rose above the 20-day EMA ($26.90) on Jan. 12 but the bulls could not push the price above the 50-day SMA ($28.15). This may have attracted profit-booking from the short-term traders.DOT/USDT daily chart. Source: TradingViewThe bears pulled the price back below the 20-day EMA on Jan. 17. If sellers sink the price below $25.45, the DOT/USDT pair could drop to the strong support at $22.66. The 20-day EMA is flat and the RSI is just below the midpoint, indicating a balance between supply and demand. This suggests that the pair could remain range-bound between $22.66 and $32.78 for a few more days.If the price turns up from the current level and rises above the 50-day SMA, the pair could rally to $32.78. The bulls will have to clear this hurdle to signal the start of a new up-move.AVAX/USDTAvalanche (AVAX) turned down from the 20-day EMA ($95) on Jan. 16, indicating that bears continue to defend this level aggressively. If the price sustains below the uptrend line of the symmetrical triangle, the next stop could be $75.50.AVAX/USDT daily chart. Source: TradingViewThe downsloping moving averages and the RSI in the negative zone indicate that bears have the upper hand. A close and below $75.50 could complete a descending triangle pattern, which could signal the start of a new downtrend.The AVAX/USDT pair could drop to $57.02 and then to $50. This negative view will be invalidated if the price turns up from the current level and breaks above the downtrend line. The pair could then rally to $128.DOGE/USDTDogecoin’s (DOGE) failure to rise and sustain above the $0.19 overhead resistance on Jan. 15 may have attracted profit-booking from short-term traders. This has pulled the price to the 20-day EMA ($0.16).DOGE/USDT daily chart. Source: TradingViewThe flattening 20-day EMA and the RSI just below the midpoint signal a consolidation in the near term. If bears sink and sustain the price below the moving averages, the DOGE/USDT pair could drop to $0.13.Conversely, if the price rebounds off the current level, the bulls will make one more attempt to push and sustain the pair above $0.19. If they manage to do that, it will indicate the start of a new up-move. The views and opinions expressed here are solely those of the author and do not necessarily reflect the views of Cointelegraph. Every investment and trading move involves risk. You should conduct your own research when making a decision.Market data is provided by HitBTC exchange.

Čítaj viac

Top 5 cryptocurrencies to watch this week: BTC, NEAR, ATOM, FTM, FTT

Bitcoin (BTC) has stopped its decline and is attempting a recovery along with select altcoins. Some traders have been fearing a massive sell-off in Bitcoin but Capriole CEO Charles Edwards said that Bitcoin’s worst crashes have happened “due to miner capitulation (December 2018 and March 2020), when BTC fell below production costs.” However, the current production cost of Bitcoin was $34,000, which is well below the current price.In a sign that institutional investors remain bullish on the crypto sector even after the recent fall, Cathie Wood’s Ark Invest bought 6.93 million shares of the special purchase acquisition company that will merge with Circle, the principal operator of USD Coin (USDC) and the second-largest stablecoin in terms of market capitalization.Crypto market data daily view. Source: Coin360Another sign that the crypto markets are maturing is the fact that nonfungible tokens (NFTs) have not responded negatively to the fall in crypto prices. A recent report by DappRadar said that NFT trading in the first ten days of 2022 generated $11.90 billion compared to $10.7 billion in Q3 2021.Could Bitcoin continue its recovery and pull select altcoins higher? Let’s study the charts of the top-5 cryptocurrencies to find out.BTC/USDTThe bulls are struggling to propel Bitcoin above the 20-day exponential moving average ($44,415) for the past few days but a minor positive is that buyers have not given up much ground. This suggests that bulls are buying on every minor dip.BTC/USDT daily chart. Source: TradingViewIf buyers push and sustain the price above the 20-day EMA, it will signal a possible change in trend. The BTC/USDT pair could then rally to the 50-day simple moving average ($47,987) where the bears may again mount a stiff resistance. A break and close above this resistance could clear the path for a rally to $52,088.Contrary to this assumption, if the price fails to rise above the 20-day EMA, it will suggest that the sentiment remains negative and traders are selling on rallies. The bears will then attempt to sink the price below the critical support at $39,600. If they succeed, the pair could extend its downtrend.BTC/USDT 4-hour chart. Source: TradingViewThe moving averages have flattened out and the relative strength index (RSI) is just above the midpoint on the 4-hour chart. This suggests a range-bound action in the short term. The pair could remain stuck between $39,600 and $45,456.A break and close above $45,456 could tilt the advantage in favor of the bulls, signaling the start of a possible rally to $52,088. Alternatively, a break and close below $39,600 could indicate the resumption of the downtrend.NEAR/USDTNEAR Protocol’s NEAR token is in a strong uptrend. The price broke above the previous all-time high at $17.95 on Jan. 11, signaling the resumption of the up-move. The bears pulled the price back below $17.95 on Jan. 12 but the bulls bought this dip and reclaimed the level on Jan. 13.NEAR/USDT daily chart. Source: TradingViewBoth moving averages are sloping up and the RSI is in the positive territory, indicating that the path of least resistance is to the upside. If bulls do not allow the price to dip below the breakout level at $17.95, the NEAR/USDT pair could rally to $25.44.Alternatively, if bears pull the price below $17.95, the pair could drop to the 20-day EMA ($16.42). A bounce off this level could keep the uptrend intact but a break and close below it will suggest that traders are rushing to the exit. The pair could then decline to $13.NEAR/USDT 4-hour chart. Source: TradingViewThe 4-hour chart shows that the price has been taking support at the 20-EMA. The upsloping moving averages and the RSI in the positive territory indicate that the short-term trend favors the buyers.If bulls propel the price above $20.59, the uptrend could begin. The pair could then rise to $22 and later to $25.Contrary to this assumption, if the price drops below the 20-EMA, it will indicate that short-term traders may be booking profits. The pair could then drop to the 50-SMA. A break and close below this support will indicate the start of a deeper correction.ATOM/USDTCosmos (ATOM) is attempting to form an inverse head and shoulders pattern, which will complete on a breakout and close above the overhead resistance at $44.80.ATOM/USDT daily chart. Source: TradingViewThe rising moving averages and the RSI in the overbought territory indicate that the path of least resistance is to the upside. A close above $44.80 could open the gates for a rally to the psychological level at $50 and then toward the pattern target at $69.42.Alternatively, if the price turns down from the overhead resistance, the ATOM/USDT pair could drop to the 20-day EMA ($36). This is a key level for the bulls to defend. If the price rebounds off this level, the bulls will again attempt to drive the pair above the overhead resistance and resume the uptrend.A break and close below the 20-day EMA will be the first sign that the up-move could be losing steam. The pair could then drop to $32.90.ATOM/USDT 4-hour chart. Source: TradingViewThe 4-hour chart shows that the price has broken out of the symmetrical triangle pattern, indicating that the uncertainty has resolved in favor of the buyers. The bears may attempt to defend the overhead resistance at $44.80 but if they fail, the pair could rally to the pattern target at $51.19.Alternatively, if the bears successfully defend the resistance at $44.80, the pair could drop to the 20-EMA. If the price rebounds off this support, the bulls will again try to clear the overhead hurdle. This positive view will be negated on a break and close below the 50-SMA.Related: Dogecoin leaps 25% after Musk announces DOGE payments for Tesla merchFTM/USDTFantom (FTM) is in a strong uptrend. The price action of the past few days has formed an inverse (IH&S) which will complete on a break and close above $3.17. FTM/USDT daily chart. Source: TradingViewThe bears may attempt to stall the rally at $3.48 but if bulls push the price above this level, the next leg of the uptrend could begin. The up-move could first reach $4 and later continue its journey toward the pattern target at $5.11.Contrary to this assumption, if the price turns down from the overhead resistance, the bears will attempt to pull the FTM/USDT pair to the 20-day EMA ($2.62). If the price turns up from this level, it will suggest that the sentiment remains positive and traders are buying the dips.However, a break and close below this support will signal the start of a deeper correction to the 50-day SMA ($2.07).FTM/USDT 4-hour chart. Source: TradingViewThe bears attempted to stall the up-move at $3.17 but the bulls had other plans. They bought the dip to the 20-EMA and have pushed the price above the overhead barrier. If bulls sustain the price above the breakout level, it will signal the resumption of the uptrend.On the other hand, if bears pull the price below $3.17, the pair could drop to the 20-EMA. This is an important level to watch out for because a break and close below it could indicate that the current breakout may have been a bull trap. The pair could then drop to $2.80 and later to the 50-SMA.FTT/USDTFTX Token (FTT) has been in a strong corrective phase for the past several weeks. The bulls pushed the price above the downtrend line on Jan. 14, signaling a possible change in trend.FTT/USDT daily chart. Source: TradingViewThe moving averages are on the verge of a bullish crossover and the RSI has risen above 64 after forming a positive divergence. This suggests that bulls are attempting a comeback. If the price sustains above the downtrend line, the FTT/USDT pair could rise to $53.50.Contrary to this assumption, if the price turns down from the current level and breaks below the moving averages, it will suggest that the breakout was a bull trap. That could pull the price down to $33.76. A break and close below this support could open the doors for a possible drop to $24.FTT/USDT 4-hour chart. Source: TradingViewThe 4-hour chart shows the formation of a falling wedge pattern. The buyers pushed the price above this pattern and have also cleared the horizontal resistance at $45.07. Both moving averages are sloping up and the RSI is in the overbought zone, indicating that bulls have the upper hand. If bulls maintain the price above $45.07, the pair could start its march toward the psychological resistance at $50.This positive view will invalidate if the price turns down and re-enters the wedge. Such a move will indicate that demand dries up at higher levels.The views and opinions expressed here are solely those of the author and do not necessarily reflect the views of Cointelegraph. Every investment and trading move involves risk, you should conduct your own research when making a decision.

Čítaj viac

Získaj BONUS 8 € v Bitcoinoch

nakup bitcoin z karty

Registrácia Binance

Burza Binance

Aktuálne kurzy