Autor Cointelegraph By Rakesh Upadhyay

Price analysis 1/31: BTC, ETH, BNB, ADA, SOL, XRP, LUNA, DOGE, DOT, AVAX

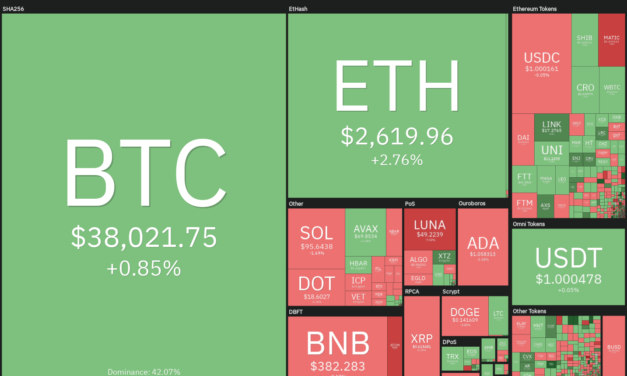
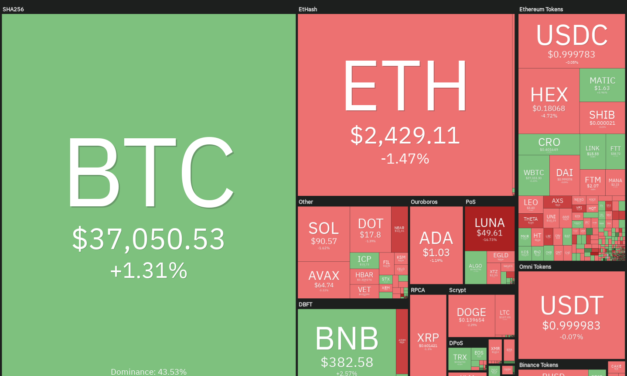
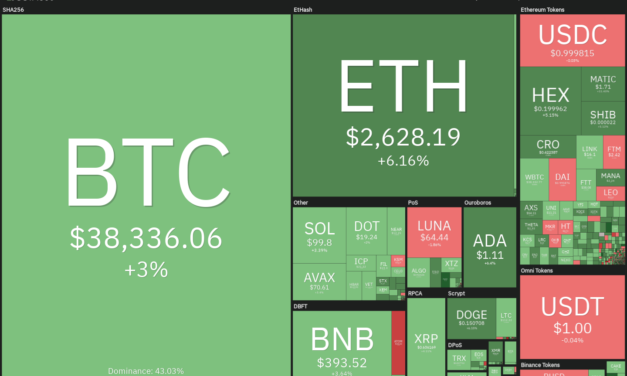
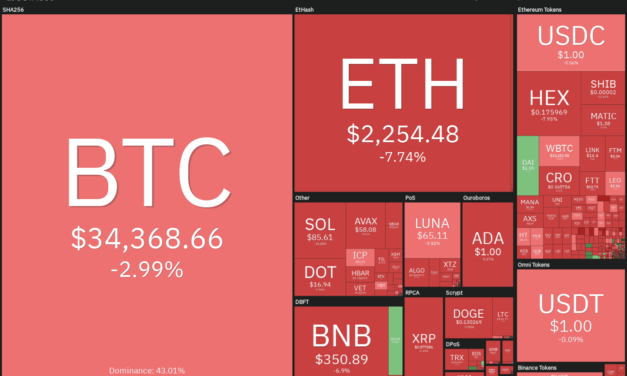
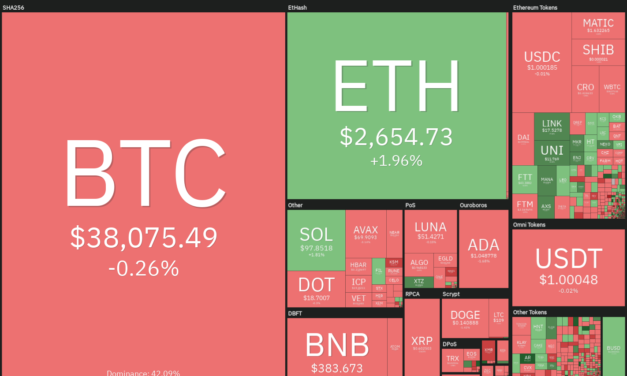
Bitcoin (BTC) started the 2022 on a losing note, dropping about 20% to its worst performance in January since 2018 when the price plunged 26.61%, according to on-chain analytics resource Coinglass.Now, all eyes turn to February, which has historically favored the bulls. The only two negative closes in February were in 2020 and 2014. One positive sign during the recent price decline has been that the long-term hodlers have not panicked. Glassnode data shows that the number of coins that last moved between five and seven years ago surged to a new all-time high.Daily cryptocurrency market performance. Source: Coin360El Salvador’s President Nayib Bukele projected a “gigantic price increase” for Bitcoin. Bukele’s prediction is based on the fact that if the millionaires of the world, who are more than 50 million in number, want to buy at least one Bitcoin, there isn’t enough supply to fulfill that demand.Could Bitcoin and the major altcoins end the month on a strong note? Let’s study the charts of the top-10 cryptocurrencies to find out.BTC/USDTBitcoin has pulled back in a strong downtrend. In a sliding market, the sentiment is to sell on rallies rather than buy the dips as traders make more money on the downside.BTC/USDT daily chart. Source: TradingViewThe first sign of a change in sentiment will be a break and close above the 20-day exponential moving average ($39,318). Such a move will indicate that demand exceeds the supply near the 20-day EMA resistance. The BTC/USDT pair could then march toward the 50-day simple moving average ($43,791). Conversely, if the price turns down from the current level or the 20-day EMA, it will suggest that bears are defending this level aggressively. The pair could then dip to $35,507.01. If this support cracks, the selling could pick up and the price could retest the Jan. 24 low at $32,917.17. This is an important level for the bulls to defend because if it cracks, the pair could plummet to the strong support at $30,000.ETH/USDTEther (ETH) is facing resistance near the breakdown level at $2,652 but a minor positive is that bulls have not given up much ground. This suggests that traders are buying the dips as seen from the long tail on today’s candlestick.ETH/USDT daily chart. Source: TradingViewThe bulls will now again try to push the price above $2,652 and the critical resistance at the 20-day EMA ($2,802). If they succeed, it will suggest that the selling pressure could be reducing. The bulls will then see an opening and attempt to push the pair to the resistance line of the channel.Contrary to this assumption, if the price turns down from the current level or the 20-day EMA, the bears will attempt to pull the ETH/USDT pair to the $2,300 to $2,159 support zone. The bears will have to sink and sustain the price below this zone to clear the path for a further decline to $1,700.BNB/USDTBinance Coin (BNB) re-entered the channel on Jan. 25, but the recovery faltered near $400. This suggests that the bears have not yet given up and are selling on rallies.BNB/USDT daily chart. Source: TradingViewIf bears sink and sustain the price below the channel, the BNB/USDT pair could again retest the critical support zone at $330 to $320. The downsloping moving averages and the RSI in the negative territory indicate that sellers hold the edge.The pair could plummet to $250 if the $320 support gives way as several traders are likely to panic and rush to the exit. This negative view will invalidate in the short-term on a break and close above the 20-day EMA. The pair could then rise to the resistance line of the channel.ADA/USDT The failure of the bulls to secure a meaningful rebound off the psychological support at $1 indicates a lack of aggressive buying at this level. The bears will now attempt to build upon their advantage and sink Cardano (ADA) below $1.ADA/USDT daily chart. Source: TradingViewBoth moving averages are sloping down and the RSI is in the negative zone, indicating that the bears are in command. A break and close below $1 could signal the start of the next leg of the downtrend.The ADA/USDT pair could first drop to $0.80 and then to the support line of the channel. The bulls will have to push and sustain the price above the resistance line of the channel to signal a change in trend.SOL/USDTSolana (SOL) has been consolidating in a tight range between $80.83 and $104.82 for the past few days. The bulls tried to push the price above the range but failed and now the bears will try to grab the opportunity and attempt to pull the altcoin below $80.83.SOL/USDT daily chart. Source: TradingViewIf they succeed, the SOL/USDT pair could resume its downtrend. The pair could first drop to the support line of the channel where the bulls may attempt to arrest the decline. If they fail in their endeavor, the pair could plunge to $66.03.On the contrary, if the price rebounds off $80.83, the pair may extend its stay inside the range for a few more days. The buyers may gain strength if they push and sustain the pair above the breakdown level at $116.XRP/USDTRipple (XRP) has been consolidating between $0.54 and $0.65 for the past few days. After failing to cross above the overhead resistance, the price could now drop to the support of the range. XRP/USDT daily chart. Source: TradingViewThe downsloping moving averages and the RSI in the oversold territory indicate advantage to bears. The critical level to watch on the downside is $0.54 because if it cracks, the XRP/USDT pair could drop to $0.50.This level is likely to act as a strong support as a break and close below it could lead to panic selling. On the upside, a break and close above the 20-day EMA ($0.66) will be the first sign that bulls are on a comeback.LUNA/USDTTerra’s LUNA token is struggling to sustain the rebound off the support line of the descending channel. This indicates that sentiment is negative and demand dries up at higher levels.LUNA/USDT daily chart. Source: TradingViewIf the bounce again fails to sustain the higher levels, the sellers may smell an opportunity and try to sink the LUNA/USDT pair below the channel. If they succeed, the pair could drop to $37.50 which may act as a strong support.If the current rebound sustains, the bulls will try to start a relief rally, which could reach the 20-day EMA ($63). If the price turns down from this resistance, the pair could again turn toward $37.50. Alternatively, if bulls push the pair above the 20-day EMA, the rally could reach the downtrend line of the channel.Related: Ethereum price risks dropping to $2K on ‘bear flag’ setupDOGE/USDTDogecoin (DOGE) has been consolidating between $0.13 and $0.15 for the past few days. This suggests that bulls are buying near the support but have not succeeded in pushing the price above the overhead resistance.DOGE/USDT daily chart. Source: TradingViewA minor positive is that the RSI has formed a bullish divergence indicating that the selling pressure may be reducing. However, if buyers fail to drive the price above $0.15, the bears may regroup and again attempt to pull the DOGE/USDT pair below the support. A close below $0.13 could result in further selling, driving the pair to the psychological level at $0.10. The bulls will have to push and sustain the price above the 50-day SMA ($0.16) to ward off the short-term threat from the bears.DOT/USDTPolkadot’s (DOT) weak rebound off the strong support at $16.81 indicates a lack of buying at current levels. The downsloping moving averages and the RSI near the oversold territory indicate the path of least resistance is to the downside.DOT/USDT daily chart. Source: TradingViewIf bears sink and sustain the price below the $16.81 to $15.83 support zone, it will indicate the resumption of the downtrend. The DOT/USDT pair could then drop toward the strong support at $10.37.Contrary to this assumption, if the price rises from the current level, the bulls will make one more effort to propel the pair above the 20-day EMA ($20.98). If they succeed, the pair could rise to the breakout level at $22.66 where the bears may pose a strong challenge. AVAX/USDTAvalanche (AVAX) is facing stiff resistance at the breakdown level at $75.50, which suggests that the sentiment remains negative and bears are selling on rallies. The downsloping moving averages and the RSI in the negative territory indicate that bears have the upper hand.AVAX/USDT daily chart. Source: TradingViewThe sellers will now try to sink the price below the immediate support at $61.06. If they manage to do that, the AVAX/USDT pair could drop to the strong support zone at $51.04 to $47.66. The bulls are likely to defend this zone with vigor.A strong bounce off the support zone could brighten the prospects of a bottoming formation with the price remaining stuck between $47.66 and $75.50 for a few days.The first sign of strength will be a break and close above $75.50. Alternatively, a drop below $47.66 could signal the resumption of the downtrend.The views and opinions expressed here are solely those of the author and do not necessarily reflect the views of Cointelegraph. Every investment and trading move involves risk. You should conduct your own research when making a decision.Market data is provided by HitBTC exchange.

Čítaj viac

Top 5 cryptocurrencies to watch this week: BTC, LINK, HNT, FLOW, ONE

Bitcoin’s (BTC) relief rally rose above $38,500 on Jan. 29, but the bulls are struggling to sustain the higher levels. For the past few days, Bitcoin’s sentiment has closely followed the U.S. equity markets. Hence, analysts warned traders to be careful and not to read much into any possible weekend rallies when traditional markets are closed because it could be a trap.However, analysts at trading suite Decentrader said in a recent report that a “near-term relief bounce” is possible. The report also highlighted that “meaningful buyers” were stepping in and that could result in “a potential change in the higher time frame trend from bearish to bullish.”Crypto market data daily view. Source: Coin360The recent downturn in Bitcoin seems to have turned the JPMorgan analysts bearish as they believe the increased volatility could “hinder further institutional adoption.” In a note, the strategists have reduced their long-term theoretical Bitcoin price target from $150,000 to $38,000. If Bitcoin extends its recovery, select altcoins could attract buying from the aggressive bulls. Let’s study the charts of the top-5 cryptocurrencies that could extend the recovery in the short term.BTC/USDTBitcoin’s relief rally has reached the stiff resistance zone between $37,332.70 and $39,600. The 20-day exponential moving average ($39,475) is also present in this zone making this important for the bears to defend. BTC/USDT daily chart. Source: TradingViewThe downsloping 20-day EMA and the relative strength index (RSI) in the negative zone indicate advantage to bears. If the sellers pull the price back below $37,332.70, the BTC/USDT pair could gradually drop to $35,507.01 and later retest the Jan. 24 intraday low at $32,917.17. A break and close below this support could clear the path for a possible drop to $30,000.Alternatively, if the price turns up from the current level and breaks above $39,600, it will suggest a possible change in the short-term trend. The pair could then rally to $43,505 and later retest the 200-day simple moving average ($48,833).BTC/USDT 4-hour chart. Source: TradingViewThe 4-hour chart shows that the 20-EMA has started to turn up gradually and the RSI has risen into the positive zone. This indicates that bulls are trying to make a comeback. If buyers drive the price above $39,600, the pair could reach the 200-SMA, which may act as a resistance.On the other hand, if the price turns down from the current level and slips below $37,312.70, it will indicate that bears have not yet given up. The sellers will then try to pull the price to $35,507.01, which is an important support for the bulls to defend. If the price rebounds off this level, it will suggest that traders are buying on dips. That may increase the possibility of a break above $39,600.LINK/USDTChainlink (LINK) has been range-bound between $15 and $36 for the past several months. Several attempts to escape the range have failed, indicating that bulls are buying at the support and bears are selling at the resistance.LINK/USDT daily chart. Source: TradingViewThe bears pulled the price below $15 on several occasions in the past few days but they could not sustain the lower levels. This may have attracted buying from aggressive traders who are attempting to push the price above the 20-day EMA ($18.91).If they succeed, the LINK/USDT pair could rise to the 200-day SMA ($24.75). Contrary to this assumption, if the price turns down from the 20-day EMA, the bears will again try to pull the pair below $15 and start a new downtrend. LINK/USDT 4-hour chart. Source: TradingViewThe 4-hour chart shows that bulls have pushed the price above the $16.88 overhead resistance. The 20-EMA is turning up and the RSI is in the positive territory, indicating that bulls have a slight edge.If buyers sustain the price above $16.88, the pair could start an up-move to $20 and then to $23. Conversely, if the price turns down and plummets below $16.88, it will indicate that bears continue to sell on rallies. The pair could then drop to $14.HNT/USDTHelium (HNT) plunged below the 200-day SMA ($26.67) on Jan. 21, but the bears could not sustain the lower levels. The bulls aggressively purchased the dip to $20 and pushed the price back above the 200-day SMA on Jan. 26.HNT/USDT daily chart. Source: TradingViewThe recovery hit a wall at the 20-day EMA ($28.84) and turned down but the bulls did not allow the price to dip below the 200-day SMA. The price has been trading between the moving averages for the past three days.This tight-range trading is unlikely to continue for long. If bulls drive and sustain the price above the 20-day EMA, the HNT/USDT pair could rally to $36 and then to the downtrend line. This positive view will invalidate if the price turns down and plummets below the 200-day SMA. That may pull the pair down to $20.HNT/USDT 4-hour chart. Source: TradingViewThe price broke out of the downtrend line, indicating that the bears may be losing their grip. The bears tried to sink the price back below the 20-EMA but the bulls are attempting to defend the support.The up-move may pick up momentum after bulls drive the price above $31 as that could signal a 1-2-3 bottom. There is a minor resistance at the 200-SMA but once that is cleared, the pair could start its march toward $40. Conversely, if the price turns down and plummets below $26, the pair could drop to $24.Related: Bitcoin miners believe global hash rate to grow ‘aggressively’FLOW/USDTFlow (FLOW) has been in a strong downtrend for the past few months. The bears pulled the price below the strong support at $6 on Jan. 22 but have not been able to build upon their advantage. This indicates accumulation at lower levels. FLOW/USDT daily chart. Source: TradingViewThe bulls have pushed the price back above the breakdown level and the 20-day EMA ($6.41) today. If they sustain the price above the resistance level, it will signal a possible change in trend. The 20-day EMA is flattening out and the RSI has recovered into the positive territory, indicating that bulls are on a comeback.This positive view will invalidate if the price turns down from the current level and plummets below the $6 support. Such a move will indicate that bears continue to sell aggressively at higher levels.FLOW/USDT 4-hour chart. Source: TradingViewThe 4-hour chart shows the price is facing resistance at the 200-SMA. This is a critical level to watch out for because the previous recovery had faltered at this resistance. If the price turns down from the current level, the FLOW/USDT pair could drop to the 20-EMA.If the price rebounds off this level with strength, it will indicate that bulls are buying on dips. The buyers will then make one more attempt to push the pair above the 200-SMA. If they manage to do that, the pair could rally to the overhead resistance zone at $9.27 to $9.70.ONE/USDTHarmony (ONE) is trading inside a large range between $0.16 and $0.36. The bears recently tried to sink the price below the range but the bulls firmly held their ground.ONE/USDT daily chart. Source: TradingViewThe price has rebounded off the support and the bulls will now try to push the ONE/USDT pair above the 200-day SMA ($0.19). If they succeed, the pair could rise to the 20-day EMA ($0.23) where the bears may again mount a stiff resistance.A break and close above the 20-day EMA could clear the path for a possible rally to $0.28. Conversely, if the price turns down from the current level, the bears will attempt to pull the pair below $0.16. If they can pull it off, it will signal the possible start of a new downtrend.ONE/USDT 4-hour chart. Source: TradingViewThe 4-hour chart shows the formation of a symmetrical triangle pattern. The 20-EMA has flattened out and the RSI is just below the midpoint indicating a balance between supply and demand.This indecision could tilt in favor of the bulls if the price rises and sustains above the triangle. That could suggest a possible trend reversal and the pair may rise to $0.22 and later to $0.26. This positive view will invalidate if the price turns down and plummets below the support line. Such a move will indicate that the triangle acted as a continuation pattern.The views and opinions expressed here are solely those of the author and do not necessarily reflect the views of Cointelegraph. Every investment and trading move involves risk, you should conduct your own research when making a decision.

Čítaj viac

Price analysis 1/28: BTC, ETH, BNB, ADA, SOL, XRP, LUNA, DOGE, DOT, AVAX

Bitcoin (BTC) and most major altcoins are turning down from overhead resistance levels, indicating that the sentiment remains negative and traders are selling on every available opportunity.Decentrader analyst Philip Swift said that the on-chain spent profit output ratio (SOPR) metric, which aggregates the price of purchase versus price sold during a given period, indicates that traders are selling their Bitcoin holdings for a loss.Another metric that is worrying traders is the funding rates, which has further slipped into the negative territory following comments by the U.S. Federal Reserve. Crypto research firm Delph Digital expects Bitcoin to “make a lower low after recently testing the $34K level.”Daily cryptocurrency market performance. Source: Coin360Among several bearish projections, there was an uber bullish long-term forecast by Cathy Wood’s Ark Invest. The report projected Bitcoin’s price to cross $1 million by 2030 and Ether to reach between $170,000 to $180,000 during the same period.Could Bitcoin and most major altcoins bottom out near current levels? Let’s study the charts of the top-10 cryptocurrencies to find out.BTC/USDTBitcoin is facing stiff resistance in the overhead zone between $37,332.70 to $39,600. This suggests that bears are unwilling to let go of their advantage and are selling on rallies.BTC/USDT daily chart. Source: TradingViewThe pullback of the past few days has resolved the oversold levels in the relative strength index (RSI). The bears will now attempt to resume the downtrend by pulling the BTC/USDT pair below $32,917.17. If they succeed, the next stop could be $30,000.Alternatively, if the price turns up from the current level and rises above $37,332.70, it will suggest accumulation at lower levels. The buyers will then attempt to push the price above the 20-day exponential moving average ($39,714) and challenge the 50-day simple moving average ($44,428). A break and close above this resistance will signal that the downtrend could be over.ETH/USDTEther (ETH) surged above the overhead resistance at $2,652 on Jan. 26 but the bears sold aggressively at higher levels and pulled the price back below the channel.ETH/USDT daily chart. Source: TradingViewSince then, buyers have struggled to push the price back inside the channel. The bears will now try to resume the downtrend by pulling the price below the Jan. 24 intraday low at $2,159. If they succeed, the ETH/USDT pair could drop to $2,000 and then to $1,700.The RSI is stuck inside the oversold zone for the past few days, suggesting that the selling may have been overdone in the near term. Therefore, the bulls may again attempt a relief rally, which could reach the 20-day EMA ($2,856). This is an important hurdle for the bulls to cross because the previous three relief rallies had turned down from the 20-day EMA.BNB/USDTBinance Coin (BNB) rebounded off the $330 support and re-entered the descending channel on Jan. 25 but the bulls are struggling to push the price toward the 20-day EMA ($424). This suggests a lack of demand at higher levels.BNB/USDT daily chart. Source: TradingViewThe bears will sense an opportunity and try to pull the price back toward the strong support zone at $330 to $320. This is an important zone for the bulls to defend because if it cracks, the BNB/USDT pair could plummet to $250.Contrary to this assumption, if the price rises from the current level, the bulls will try to thrust the pair above the 20-day EMA. If they succeed, the pair could rally to the resistance line of the channel. A break and close above the channel will signal that the downtrend could be over.ADA/USDT Cardano (ADA) has been trading near the psychological support at $1 for the past few days. This suggests that bulls are defending the support but have failed to push the price higher.ADA/USDT daily chart. Source: TradingViewThe downsloping moving averages and the RSI in the negative territory suggest that the path of least resistance is to the downside. If bears sink and sustain the price below $1, the ADA/USDT pair could drop to $0.80.This negative view will invalidate in the short term if the price bounces off the current level and breaks above the moving averages. The pair could then test the resistance line of the channel. The bulls will have to clear this barrier to signal a possible change in trend.SOL/USDTSolana (SOL) has been trading close to the support line of the descending channel for the past few days. This suggests that bulls are defending the support line but haven’t been able to achieve a strong rebound off it.SOL/USDT daily chart. Source: TradingViewThe RSI has been trading in the oversold territory for the past few days, signaling that the correction may have been overdone in the short term. This indicates the possibility of a consolidation or minor pullback in the next few days.If that happens, the SOL/USDT pair could rise to the 20-day EMA ($118). A break and close above this level could clear the path for a possible rally to the resistance line of the channel.This short-term positive view will invalidate if the price turns down and dives below the channel. The pair could then drop to $66.XRP/USDTThe bulls attempted to push Ripple (XRP) above the overhead resistance at $0.65 but the long wick on the day’s candlestick suggests that bears are in no mood to relent.XRP/USDT daily chart. Source: TradingViewBoth moving averages are sloping down and the RSI is in the oversold territory, indicating that bears are in command. The sellers will now attempt to sink the XRP/USDT pair below $0.54 and challenge the psychological support at $0.50.This negative view will invalidate if bulls push and sustain the price above the 20-day EMA ($0.68). Such a move will be the first sign that the selling pressure could be reducing. The pair may then rally to the overhead resistance at $0.75.LUNA/USDTTerra’s LUNA token has again slipped to the support line of the descending channel. This suggests that traders continue to sell on rallies.LUNA/USDT daily chart. Source: TradingViewThe downsloping 20-day EMA ($68.8) and the RSI near the oversold territory indicate that bears have the upper hand. If bears sink the price below the support line of the channel, the selling could intensify and the LUNA/USDT pair may plummet to $37.82.Contrary to this assumption, if the price rebounds off the current level, the bulls will make one more attempt to push the pair to the 20-day EMA. This level is again likely to act as a stiff resistance but if the bulls overcome it, the pair may rally to the downtrend line.Related: Defying the bear market, this automated strategy is up 15% so far in 2022DOGE/USDTDogecoin (DOGE) turned down from the 20-day EMA ($0.15) on Jan. 26, indicating that bears are selling near this overhead resistance. The price is back inside the tight range at $0.15 to $0.13.DOGE/USDT daily chart. Source: TradingViewWhile the downsloping 20-day EMA indicates advantage to bears, the bullish divergence on the RSI suggests that the selling pressure could be reducing. This state of uncertainty is unlikely to continue for long.If bulls push and sustain the price above the 20-day EMA, the DOGE/USDT pair could rise toward the overhead resistance at $0.19. Conversely, if the price slips and closes below $0.13, the pair could drop to the psychological support at $0.10. DOT/USDTPolkadot (DOT) has been trading near the strong support at $16.81 for the past few days but a minor negative is that the bulls have not been able to achieve a powerful rebound off it. This indicates a lack of demand at higher levels.DOT/USDT daily chart. Source: TradingViewThe bears will now try to pull and sustain the price below $16.81. If they manage to do that, the selling could intensify and the DOT/USDT pair may drop toward the next major support at $10.37. The downsloping moving averages and the RSI in the oversold zone suggest the path of least resistance is to the downside.Conversely, if bulls drive the price above $20.16, it will suggest a pick-up in demand. The pair may then rise to the 50-day SMA ($25.44). This is an important level to watch out for because a break above it will signal a possible change in trend.AVAX/USDTThe long wick on Avalanche’s (AVAX) Jan. 26 candlestick shows that bears are defending the breakdown level at $75.50. The bears will now try to pull the price to the strong support at $51.04. AVAX/USDT daily chart. Source: TradingViewIf the price rebounds off $51.04, it will suggest that bulls are buying on dips to this level. That could keep the AVAX/USDT pair range-bound between $75.50 and $51.04 for a few days. A break and close above $75.50 will be the first indication that the correction could be over. The pair could then rise to the downtrend line. Alternatively, if the price breaks below $47.66, the next leg of the downtrend could begin. Until then, the pair could remain volatile inside the range.The views and opinions expressed here are solely those of the author and do not necessarily reflect the views of Cointelegraph. Every investment and trading move involves risk. You should conduct your own research when making a decision.Market data is provided by HitBTC exchange.

Čítaj viac

Price analysis 1/26: BTC, ETH, BNB, ADA, SOL, XRP, LUNA, DOGE, DOT, AVAX

Bitcoin (BTC) and most major altcoins have bounced off their strong support levels but could the rally sustain to the extent that traders feel confident that a bottom in place? Bloomberg Intelligence senior commodity strategist Mike McGlone said that Bitcoin’s price is “about 30% below its 20-week moving average,” roughly at the same position, which had led to bottom formations in March 2020 and July 2021.Although Bitcoin has corrected sharply in January, the exchanges’ balances dropped from 2.428 million Bitcoin on December 28 to 2.366 million Bitcoin on Jan. 24, according to data from CryptoQuant. This indicates that investors may be stashing away their recent purchases safely.Daily cryptocurrency market performance. Source: Coin360However, it may not be a V-shaped recovery for Bitcoin as volatility is likely to remain high. Traders will keenly watch the U.S. Federal Reserve’s decision following the conclusion of its two-day policy meeting on Jan. 26. Could Bitcoin and most major altcoins extend their relief rally? Let’s study the charts of the top-10 cryptocurrencies to find out.BTC/USDTThe long tail on Bitcoin’s Jan. 24 candlestick shows aggressive buying at lower levels. Sustained buying by the bulls has propelled the price above the immediate resistance at $37,332.70.BTC/USDT daily chart. Source: TradingViewThe BTC/USDT pair could now reach the 20-day exponential moving average ($40,438), which has been acting as a strong resistance during relief rallies. If the price turns down from this resistance, the bears will try to pull the pair below $32,917.17. If they succeed, the pair could drop to the strong support at $30,000.Conversely, if the price breaks above the 20-day EMA, the pair could rally to the 50-day simple moving average ($44,935). A break and close above this resistance will be the first sign that the corrective phase could be over. The pair could then challenge the 200-day SMA ($48,750).ETH/USDTEther (ETH) sharply bounced off $2,159 on Jan. 24, as seen from the long tail on the day’s candlestick. This suggests that bulls are aggressively buying at lower levels.ETH/USDT daily chart. Source: TradingViewSustained buying has pushed the price back into the channel today. This is the first sign of strength. The buyers will now attempt to push and sustain the price above the overhead resistance at $2,652.If they manage to do that, the ETH/USDT pair could rise to the 20-day EMA ($2,966). The bears are likely to mount a strong defense of this level.If the price turns down from the 20-day EMA, it will suggest that sentiment remains negative and traders are selling on rallies. The bears will then again try to resume the downtrend by pulling the pair below $2,159.BNB/USDTBinance Coin (BNB) rebounded sharply off the $330 support on Jan. 24 as seen from the long tail on the day’s candlestick. This suggests that buyers are aggressively accumulating near $330.BNB/USDT daily chart. Source: TradingViewThe bulls pushed the price back inside the channel on Jan. 25 and will now attempt to drive the BNB/USDT pair to the 20-day EMA ($435). If this hurdle is overcome, the pair could rally to the resistance line of the channel.On the contrary, if the price turns down from the current level or the 20-day EMA, it will suggest that traders continue to sell on rallies. The bears will then again try to sink the pair below the strong support zone at $330 to $320.ADA/USDT Cardano (ADA) is attempting to bounce off the strong support at $1, indicating that bulls are buying on dips to this level. The relief rally could now reach the 50-day SMA ($1.28).ADA/USDT daily chart. Source: TradingViewIf bulls thrust the price above the 50-day SMA, the ADA/USDT pair could rally to the resistance line of the descending channel. A break and close above the channel will signal a possible change in trend.Conversely, if the price turns down from the moving averages, it will suggest that bears continue to sell on rallies to strong resistance levels. The bears will then again attempt to sink and sustain the price below $1. If they succeed, the pair could decline to $0.80.SOL/USDTThe bulls again successfully defended the support line of the descending channel on Jan. 24 as seen from the long tail on the day’s candlestick. If bulls push the price above $104.82, Solana (SOL) could reach the 20-day EMA ($125).SOL/USDT daily chart. Source: TradingViewA break and close above the 20-day EMA will be the first sign that the selling pressure could be reducing. The SOL/USDT pair could then rise to the resistance line of the descending channel. The bulls will have to push the price above the channel to signal a change in trend.Conversely, if the price turns down from the 20-day EMA, it will suggest that bears continue to sell on rallies. The bears will then again try to sink the pair below the channel. If they succeed, the bearish momentum could pick up and the pair could drop to the psychological support at $50.XRP/USDTRipple (XRP) has been trading inside a tight range between $0.65 and $0.54 for the past few days. This suggests that both bulls and bears are playing it safe and not waging large bets.XRP/USDT daily chart. Source: TradingViewThe downsloping 20-day EMA ($0.70) and the relative strength index (RSI) near the oversold territory indicate that bears have the upper hand. If the price turns down from $0.64, the XRP/USDT pair could plummet to the psychological support at $0.50.Contrary to this assumption, if bulls drive the price above $0.64, the pair could challenge the 20-day EMA. A break and close above this resistance could open the gates for a rise to the 50-day SMA ($0.79). The bulls will have to clear this hurdle to signal a possible change in trend.LUNA/USDTTerra’s LUNA token continues to trade inside the descending channel pattern. The downsloping 20-day EMA ($73) and the RSI in the negative zone indicating advantage to sellers.LUNA/USDT daily chart. Source: TradingViewIf bears pull the price below $59.13, the LUNA/USDT pair could again drop to the support line of the channel. This level has held during the previous two declines, hence the bulls will again try to defend it.If they do, the pair could rise to the 20-day EMA and then rally toward the downtrend line of the channel. A break and close above the channel will be the first sign that the downtrend could be over. Related: Can DeFi and CeFi coexist? Three takeaways from experts panelDOGE/USDTThe buyers once again purchased the dip below $0.13 on Jan. 24 as seen from the long tail on the day’s candlestick. This started a relief rally, pushing Dogecoin (DOGE) to the 20-day EMA ($0.15).DOGE/USDT daily chart. Source: TradingViewIf bulls drive the price above the moving averages, the DOGE/USDT pair could rally to the critical overhead resistance at $0.19. If the price turns down from this resistance, the pair could extend its stay inside the $0.19 to $0.13 range for the next few days.Contrary to this assumption, if the price turns down from the moving averages, it will suggest that demand dries up at higher levels. The bears will then try to pull and sustain the price below $0.13. If they do that, the pair could resume its decline to the psychological support at $0.10.DOT/USDTThe bulls have successfully held Polkadot (DOT) above the critical support at $16.81 for the past few days. This could attract further buying by short-term traders propelling the price toward the breakdown level at $22.66.DOT/USDT daily chart. Source: TradingViewThe 20-day EMA ($22.77) is sloping down and the RSI is in the negative zone, indicating that bears have the upper hand. The DOT/USDT pair is likely to face stiff resistance at this level. If the price turns down from the 20-day EMA, the bears will again try to pull the pair to $16.81. If this support holds, the pair could remain range-bound for a few days.A break and close below $16.81 could start the next leg of the downtrend while a break above the 50-day SMA ($25.88) may open the doors for a possible rally to $32.78.AVAX/USDTThe failure of the bears to sink Avalanche (AVAX) below the $51.04 to $47.66 support zone may have attracted buying from aggressive bulls who have pushed the price above the 200-day SMA ($65).AVAX/USDT daily chart. Source: TradingViewThe AVAX/USDT pair could now rise to the breakdown level at $75.50 where the bears may mount a stiff resistance. This is an important level to watch out for as the 20-day EMA ($80) is placed just above it.If the price turns down from the breakdown level, the bears will try to pull the pair below the 200-day SMA. If they succeed, the pair could again drop to $51.04. Alternatively, a break and close above the 20-day EMA could open the gates for a possible rally to the downtrend line.The views and opinions expressed here are solely those of the author and do not necessarily reflect the views of Cointelegraph. Every investment and trading move involves risk. You should conduct your own research when making a decision.Market data is provided by HitBTC exchange.

Čítaj viac

Price analysis 1/24: BTC, ETH, BNB, ADA, SOL, XRP, LUNA, DOGE, DOT, AVAX

Bitcoin (BTC) and most major altcoins are struggling to find a bottom, indicating that traders are dumping their positions out of fear. The big question on everyone’s mind is whether the selling is over or could the decline continue?UTXO Management senior analyst Dylan LeClair highlighted that the network cost basis, the average price at which Bitcoin was last moved by various investors, is $24,000 and historically, the ratio of cost basis to price has bottomed out below 1.0. If history were to repeat itself, Bitcoin may have to fall some more to make it an attractive buy according to the metric.Daily cryptocurrency market performance. Source: Coin360Long-term investors don’t seem to be perturbed by the recent correction in Bitcoin. Glassnode data suggests that investors continue to withdraw their coins to cold storage. “Bitcoin illiquid supply is going up relentlessly,” said Lex Moskovski, chief investment officer of Moskovski Capital.Bitcoin and most major altcoins are nearing strong support levels. Could investors use their opportunity to buy or will the bears prevail? Let’s study the charts of the top-10 cryptocurrencies to find out.BTC/USDTBitcoin has been trading below the $39,600 to $37,332.70 zone for the past two days. The buyers attempted a relief rally on Jan. 23 but could not even challenge the overhead resistance at $37,332.70. This indicates weak demand at higher levels.BTC/USDT daily chart. Source: TradingViewThe selling renewed today and the bears pulled the BTC/USDT pair below the Jan. 22 intraday low at $34,008. The next support on the downside is the critical zone between $30,000 and $28,805.The oversold level on the relative strength index (RSI) suggests that the selling may be overdone in the short term. This could attract buying from traders near the support zone. If the price rebounds off this zone, the bulls will try to push the pair above $39,600.A break and close above the 20-day exponential moving average ($40,835) will be the first indication that the bears may be losing their grip. A trend change may be signaled after the price rises and sustains above the 50-day simple moving average ($45,404).ETH/USDTEther (ETH) plummeted and closed below the descending channel on Jan. 21, indicating an increase in selling pressure. The bulls tried to push the price back into the channel on Jan. 23 but failed.ETH/USDT daily chart. Source: TradingViewThis renewed the selling pressure today and bears have pulled the price below the Jan. 22 intraday low at $2,300. The ETH/USDT pair could now decline to the psychological level at $2,000 where the buyers may provide support.If the price rebounds off this level, the bulls will again try to push the price back into the channel. If they succeed, the pair could rise to the breakdown level at $2,652. Conversely, if the price breaks below $2,000, the pair could slide to the next major support at $1,700.BNB/USDTBinance Coin (BNB) plummeted below the support line of the descending channel on Jan. 21 and follow-up selling on Jan. 22 pulled the price toward the strong support zone at $330 to $320.BNB/USDT daily chart. Source: TradingViewThe buyers attempted a relief rally on Jan. 23 but the bears did not allow the price to re-enter into the channel. This indicates that bears are defending the support line of the channel. The selling resumed today and the bears will try to sink the price below the support zone.If the price sustains below $320, the BNB/USDT pair could slide to $254.50 and then to the next support at $225.40. The first sign of strength will be a break and close inside the channel. The pair could then attempt a rally to the 20-day EMA ($443).ADA/USDT Cardano (ADA) broke below the strong support at $1 on Jan. 22 but the long tail on the candlestick shows that bulls purchased the dip and defended the level successfully.ADA/USDT daily chart. Source: TradingViewHowever, a minor negative is that the bounce off $1 could not even reach the 20-day EMA ($1.24). This suggests that bears are pouncing on minor relief rallies and not waiting for higher levels to sell.The bears again pulled the price below $1 today. If they sustain the ADA/USDT pair below this level, the selling momentum could pick up. The pair could then decline to $0.80 and later to the support line of the channel. SOL/USDTSolana (SOL) nosedived below the $116 support on Jan. 21 and the price reached the support line of the descending channel on Jan. 22. Although bulls defended this level, they could not push the price to the breakdown level at $116. This indicates that buying dries up at higher levels.SOL/USDT daily chart. Source: TradingViewThe bears resumed their selling today and are attempting to sink the SOL/USDT pair below the support line of the channel. If they succeed, the selling could pick up momentum and the pair may drop to $66 and later to $58.The incessant selling of the past few days has pushed the RSI below 22. This indicates that selling may have been overdone in the short term and a relief rally is possible. The first level to watch on the upside is $116 and then the 20-day EMA ($131).XRP/USDTRipple (XRP) broke below the Dec. 4 intraday low at $0.60 on Jan. 22. There was an attempt by the bulls to start a relief rally on Jan. 23 but it did not find any takers at higher levels.XRP/USDT daily chart. Source: TradingViewThe selling resumed today and the bears are trying to pull the price to the psychological level at $0.50. This is an important support for the bulls to defend because if it cracks, the XRP/USDT pair could slide to $0.39.Contrary to this assumption, if the price rebounds off the $0.50 support, the bulls will attempt to push the pair to the 20-day EMA ($0.72). A break and close above this resistance could signal that the selling pressure may be reducing.LUNA/USDTTerra’s LUNA token rebounded off the support line of the descending channel on Jan. 22 but the recovery hit a wall at $70.22 on Jan. 23. This suggests that bears have not given up and are actively selling at higher levels.LUNA/USDT daily chart. Source: TradingViewThe moving averages have completed a bearish crossover and the RSI is in the negative territory, indicating that bears have the upper hand. The sellers will now try to pull the price to the support line.If the price rebounds off this line once again, the possibility of a move back to the downtrend line increases. Alternatively, if bears sink and sustain the price below the channel, the selling could intensify and the pair may plummet to $37.82.Related: Bitcoin ‘enters value zone’ as BTC price floor metric goes green againDOGE/USDTDogecoin (DOGE) plummeted below the strong support at $0.13 on Jan. 22 but the long tail on the candlestick shows buying at lower levels. The buyers attempted to start a recovery on Jan. 23 but higher levels attracted selling.DOGE/USDT daily chart. Source: TradingViewThe price has turned down today and the bears are attempting to pull and sustain the DOGE/USDT pair below the $0.13 support. If they succeed, the pair could start its slide toward the psychological level at $0.10.Contrary to this assumption, if the price turns up from the current level, the bulls will again try to push the pair to the 20-day EMA ($0.15). A break and close above the 50-day SMA ($0.16) could keep the $0.13 to $0.19 range into play.DOT/USDTPolkadot (DOT) plummeted below the critical support at $22.66 on Jan. 21 and reached the next support at $16.81 on Jan. 22. Although bulls defended this level, they could not extend the relief rally on Jan. 23. This indicates a lack of demand at higher levels.DOT/USDT daily chart. Source: TradingViewThe bears have resumed their selling today and are attempting to sustain the DOT/USDT pair below $16.81. If they do that, the pair could extend its decline to the next major support at $10.37.The sharp selling of the past few days has pushed the RSI into the oversold territory. This suggests that the selling may have been overdone in the short term and a relief rally could be possible. If the price turns up from the current level and rises above $19.20, the pair could rally to $22.66.AVAX/USDTAvalanche (AVAX) plunged and closed below the $75.50 support on Jan. 21, completing a bearish descending triangle pattern. The bulls defended the $51.04 support on Jan. 22 but could not push and sustain the price above the 200-day SMA ($65) on Jan. 23.AVAX/USDT daily chart. Source: TradingViewThis suggests that bears continue to sell on minor rallies. The bears have resumed their selling today and will try to pull the AVAX/USDT pair below the strong support zone at $51.04 to $47.66. If they succeed, the pair could plummet to $32.23.Conversely, if the price rebounds off the support zone, it will indicate accumulation at lower levels. The bulls will then attempt to push the pair to the breakdown level at $75.50, which is an important level to watch out for.The views and opinions expressed here are solely those of the author and do not necessarily reflect the views of Cointelegraph. Every investment and trading move involves risk. You should conduct your own research when making a decision.Market data is provided by HitBTC exchange.

Čítaj viac

Získaj BONUS 8 € v Bitcoinoch

nakup bitcoin z karty

Registrácia Binance

Burza Binance

Aktuálne kurzy