Autor Cointelegraph By Rakesh Upadhyay

Price analysis 2/18: BTC, ETH, BNB, XRP, ADA, SOL, AVAX, LUNA, DOGE, DOT

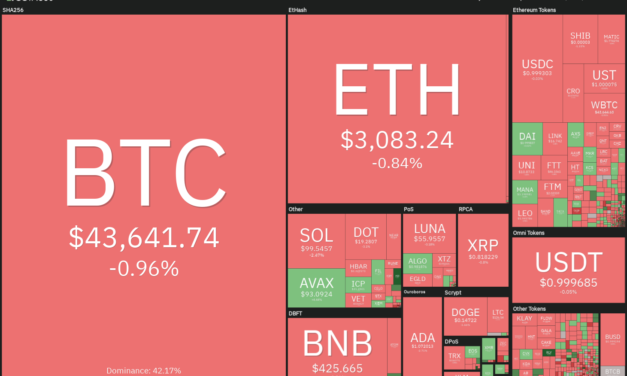
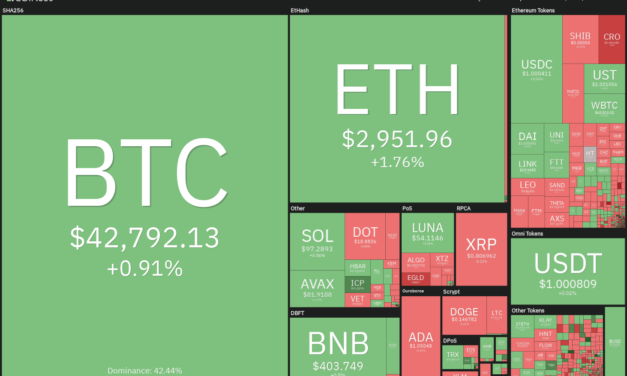
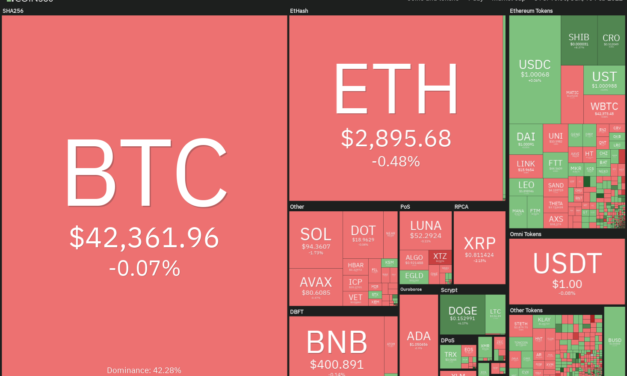
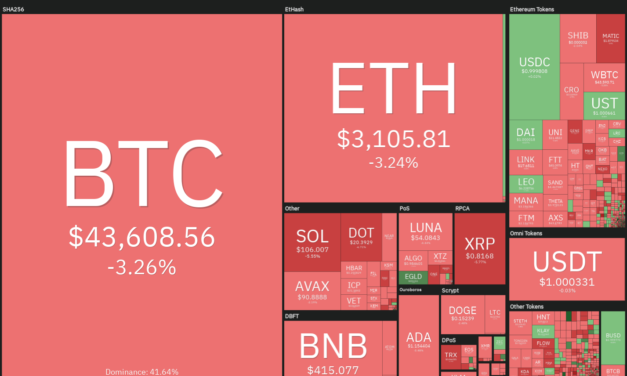
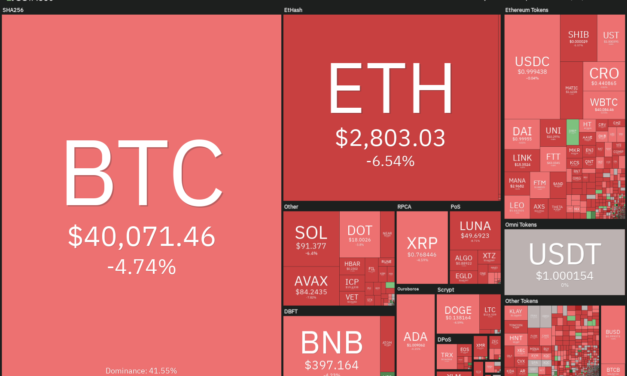
Bitcoin (BTC) sold off along with the U.S. equity markets on Feb. 17 on reports that Russia expelled Bart Gorman, the second highest-ranking American official from the U.S. Embassy in Moscow and U.S. President Joe Biden cautioned that the threat of a Ukrainian invasion by Russia remains “very high.”Although the near-term correlation between Bitcoin and the U.S. equity markets remains high, Pantera Capital CEO Dan Morehead said in a recent newsletter that the “markets will decouple soon.” Morehead mentioned that the U.S. Federal Reserve’s rate hikes will be negative for bonds, stocks and real estate and cryptocurrencies may be the “best place” to park capital.Daily cryptocurrency market performance. Source: Coin360While traders are fixated on the near-term price action, Jurrien Timmer, the director of Global Macro at Fidelity Investments, dismissed it as noise. Timmer highlighted the similarities in the growth of Bitcoin and Apple networks and concluded that Bitcoin could rally above $100,000 in the long term. Bitcoin and several major altcoins are at a critical juncture. Could bulls hold the key support levels? Let’s analyze the charts of the top-10 cryptocurrencies to find out.BTC/USDTBitcoin plunged below the moving averages on Feb. 17, indicating that bears are in no mood to relent and are selling on rallies. The price is near $39,600, which is an important level for the bulls to defend.BTC/USDT daily chart. Source: TradingViewThe relative strength index (RSI) has slipped into the negative territory and the 20-day exponential moving average ($41,635) has started to turn down. This suggests that bears are attempting to gain the upper hand.A break and close below $39,600 could increase the selling pressure and the BTC/USDT pair may drop to $36,250.If the price rebounds off the current level, the bulls will again try to push the pair above the moving averages. If they succeed, the pair could gradually rally toward $45,821 but buyers will have to clear this hurdle to signal a possible change in trend.ETH/USDTEther (ETH) turned down from close to the neckline of the developing inverse head and shoulders pattern on Feb. 16. This suggests that bears are trying their best to invalidate the possible reversal setup.ETH/USDT daily chart. Source: TradingViewThe ETH/USDT pair could now drop to the strong support at $2,652. This is an important level for the bulls to defend because a break below it could open the doors for a further downside to $3,476.Contrary to this assumption, if the price rebounds off the current level, the bulls will again attempt to push and sustain the price above the neckline. If that happens, it will suggest the start of a new up-move. However, the prospects of such a move look bleak at the moment.BNB/USDTBinance Coin (BNB) turned down from the 50-day simple moving average ($430) on Feb. 16 and broke below the 20-day EMA ($408) on Feb. 17. BNB/USDT daily chart. Source: TradingViewThe BNB/USDT pair has been consolidating between $390.50 and $445.40 for the past few days. The flattish 20-day EMA and the RSI just below the midpoint suggest a balance between supply and demand.This balance will tilt in favor of the bears if the price breaks and sustains below $390.50. That could open the doors for a possible drop to $357.40. Conversely, a break and close above $445.40 could open the doors for a possible rally to $500. Until then, the range-bound action is likely to continue.XRP/USDTThe failure of the bulls to sustain Ripple (XRP) above $0.85 may have led to profit-booking by short-term traders. That pulled the price down to the strong support at $0.75.XRP/USDT daily chart. Source: TradingViewThe buyers are likely to defend the zone between the moving averages. If the price bounces off this support zone, the XRP/USDT pair could rise to $0.85. A break and close above this level could challenge the resistance at $0.91. The gradually rising 20-day EMA and the RSI near the midpoint suggest a minor advantage to buyers.This positive view will invalidate if the bears pull the price below the 50-day SMA ($0.73). Such a move could trigger several stop-losses, resulting in a possible decline to $0.65 and then $0.60.ADA/USDT Cardano (ADA) has been sandwiched between the 20-day EMA ($1.09) and the psychological support at $1 for the past few days. This tight-range trading is likely to result in a strong directional move within the next few days.ADA/USDT daily chart. Source: TradingViewThe downsloping moving averages and the RSI in the negative zone indicate that the path of least resistance is to the downside. If the bears sink and sustain the price below $1, the ADA/USDT pair could resume its downtrend. The pair could then decline to $0.80 and later to $0.68.Contrary to this assumption, if the price rises from the current level, the bulls will try to drive the pair above the moving averages. If they do that, the pair could rally to the resistance line of the channel.SOL/USDTSolana (SOL) turned down from the 20-day EMA ($103) on Feb. 16 and the bears will now try to pull the price below the minor support at $90.72. If that happens, the decline could extend to the strong support at $80.83.SOL/USDT daily chart. Source: TradingViewThe gradually downsloping 20-day EMA and the RSI in the negative territory indicate that bears have the upper hand. A break and close below $80.83 could signal the resumption of the downtrend. The SOL/USDT pair could then drop to the support line of the channel.On the contrary, if the price rebounds off the current level, the buyers will try to propel the pair above the 20-day EMA and challenge the resistance line of the descending channel. A break and close above this level will signal that the downtrend could be over.AVAX/USDTAvalanche (AVAX) broke and closed above the downtrend line on Feb.16 but the bulls could not build upon this advantage. Strong selling by the bears at higher levels has pulled the price back below the downtrend line.AVAX/USDT daily chart. Source: TradingViewThe bulls are attempting to defend the moving averages. If the price rebounds off the current level, the buyers will try to push and sustain the AVAX/USDT pair above the downtrend line and $98.77. Such a move will suggest a rally to $117.53.Conversely, if the price breaks below the moving averages, the uptrend line will be tested. A break and close below this support could accelerate selling and the pair may drop to $76.14 followed by a decline to $65.Related: XRP ‘mega whales’ scoop up over $700M in second-biggest accumulation spree in historyLUNA/USDTTerra’s LUNA token broke and closed above the 20-day EMA ($55) on Feb. 15, but the bulls could not sustain the higher levels. This may have attracted selling by the short-term traders, which has pulled the price back below the 20-day EMA. LUNA/USDT daily chart. Source: TradingViewBoth moving averages are sloping down and the RSI is in the negative zone, indicating that bears have the upper hand. If the sellers pull the price below $49, the LUNA/USDT pair could drop to the strong support at $43.44. The buyers are expected to defend the zone between $43.44 and $37.50 aggressively.Alternatively, if the price rebounds off the current level, the bulls will make one more attempt to push the pair above the 20-day EMA. If they succeed, the pair could rally to the downtrend line of the channel. DOGE/USDTDogecoin (DOGE) turned down from the 50-day SMA ($0.15) on Feb. 16, suggesting that bears are selling on relief rallies to this resistance.DOGE/USDT daily chart. Source: TradingViewThere is a minor support at $0.13. If the price bounces off this level, the bulls will again try to push the DOGE/USDT pair above the 50-day SMA. If they succeed, the pair could rise to the overhead resistance at $0.17.The flattish 20-day EMA ($0.14) and the RSI in the negative zone indicate a minor advantage to sellers. If the price slips below $0.13, the pair could drop to the strong support at $0.12 where the buyers are likely to step in to arrest the decline.DOT/USDTPolkadot (DOT) turned down from the 20-day EMA ($19.82) on Feb. 17, indicating that the sentiment remains negative and traders are defending the overhead resistance levels.DOT/USDT daily chart. Source: TradingViewThe bears will now try to pull the price to $16.81 which is an important support to watch out for. If the price rebounds off this level, the bulls will again attempt to drive the DOT/USDT pair above the downtrend line. If they succeed, the pair could rise to $23.19.Alternatively, if bears pull the price below $16.81, the selling could intensify and the pair could extend its decline toward the next support at $10.37. The downsloping moving averages and the RSI in the negative territory indicate the path of least resistance is to the downside.The views and opinions expressed here are solely those of the author and do not necessarily reflect the views of Cointelegraph. Every investment and trading move involves risk. You should conduct your own research when making a decision.Market data is provided by HitBTC exchange.

Čítaj viac

Price analysis 2/16: BTC, ETH, BNB, XRP, ADA, SOL, AVAX, LUNA, DOGE, DOT

Bitcoin (BTC) and the U.S. equity markets are facing selling on Feb. 16 as traders seem to be trimming positions in assets perceived to be risky on the accusation by NATO that Russia continues to build troops near the Ukrainian border. This is contrary to claims by Moscow that Russian troops are returning to their permanent deployments after completion of the exercise. This geopolitical uncertainty could result in increased volatility in the near term.However, the longer-term fundamentals continue to strengthen. PwC Luxembourg, in a recent report, said that 61% of 123 Luxembourg-based financial players have either started or plan to start their “crypto journey” soon. Daily cryptocurrency market performance. Source: Coin360JPMorgan has opened a virtual lounge in Decentraland’s Metajuku Mall, taking the first step into the metaverse, which the bank believes will present a $1-trillion opportunity. Even Warren Buffet, who has been a vocal critic of Bitcoin until now, seems to be warming up to the fintech sector. Berkshire Hathaway’s security filing shows that the firm has increased its holdings in Nubank, the largest fintech bank in Brazil and reduced exposure in Visa and Mastercard stock. Let’s study the charts of the top-10 cryptocurrencies to determine the near-term price action.BTC/USDTBitcoin bounced off the 20-day exponential moving average (EMA) ($41,938) on Feb. 14 but the bulls could not push the price to the overhead resistance at $45,821. This suggests that higher levels continue to attract selling.BTC/USDT daily chart. Source: TradingViewThe moving averages have completed a bullish crossover and the relative strength index (RSI) is in the positive territory, indicating that the sentiment is positive. The bulls are likely to buy the dips to the 20-day EMA.If the price turns up from the current level or rebounds off the 20-day EMA, the buyers will attempt to drive the price above the neckline of the inverse head and shoulders (H&S) pattern. If they succeed, the bullish setup will complete, signaling a possible reversal.Contrary to this assumption, if the price breaks below the 20-day EMA, the BTC/USDT pair could drop to $39,600. This is a critical level for the bulls to defend because a break below it could intensify selling.ETH/USDTEther (ETH) broke and closed above the moving averages on Feb. 15, but the bulls are struggling to sustain the price above the 50-day simple moving average (SMA) ($3,068). This indicates that bears continue to sell on rallies.ETH/USDT daily chart. Source: TradingViewThe sellers will now try to pull the price back below the moving averages. If they succeed, the ETH/USDT pair could drop to the strong support at $2,652.Conversely, if the price rebounds off the moving averages, it will suggest that traders are accumulating on dips. The bulls will then again attempt to drive the price above $3,283.66. A close above this level will complete an inverse H&S pattern, which will indicate the start of a possible up-move. The pair could then rally to $4,000.BNB/USDTBinance Coin (BNB) soared above the 20-day EMA ($410) and the downtrend line on Feb. 15 but the bulls could not clear the hurdle at the 50-day SMA ($434). BNB/USDT daily chart. Source: TradingViewThe bears are trying to defend the 50-day SMA and pull the price back below the 20-day EMA. If they manage to do that, the aggressive bulls could get trapped and the BNB/USDT pair may drop to $390.60.On the other hand, if the price rebounds off the 20-day EMA, it will suggest that the sentiment has turned from sell on rallies to buy on dips. That could increase the possibility of a break above the 50-day SMA. If that happens, the pair may start a rally to the overhead resistance at $500.XRP/USDTRipple (XRP) is facing stiff resistance near $0.85 for the past few days. The bears will now try to pull the price to the breakout level at $0.75.XRP/USDT daily chart. Source: TradingViewThe moving averages have completed a bullish crossover and the RSI is in the positive zone, indicating that bulls have a slight edge. The buyers are likely to defend the 20-day EMA ($0.76) aggressively. If the price rebounds off this level, the bulls will again attempt to clear the overhead barrier at $0.85. If that happens, the XRP/USDT pair could rise to $0.91 and later to the psychological level at $1. This positive view will invalidate if bears sink and sustain the price below $0.75.ADA/USDT Cardano (ADA) bounced off the $1 support on Feb. 14 and reached the 20-day EMA ($1.11) on Feb. 15. The bears are unwilling to let go of their advantage and are defending this level aggressively.ADA/USDT daily chart. Source: TradingViewIf the price remains below the 20-day EMA, the sellers will make one more attempt to sink and sustain the ADA/USDT pair below the critical support at $1. Frequent retests of a support level tend to weaken it. If the support cracks, the selling could intensify and the pair could plummet to $0.80. Conversely, if the price turns up from the current level or $1 and breaks above the moving averages, the pair could reach the resistance line of the channel. The bulls will have to clear this hurdle to signal the start of a new trend.SOL/USDTSolana (SOL) bounced on Feb. 14 and reached the 20-day EMA ($105) on Feb. 15 but the bulls are facing stiff resistance from the bears at this level. This indicates that the sentiment remains negative and traders are selling on rallies.SOL/USDT daily chart. Source: TradingViewThe 20-day EMA has started to turn down and the RSI is below 43, suggesting that bears have the upper hand. If the selling pressure continues, the SOL/USDT pair could drop to the strong support at $80.83.The bulls are likely to defend this support with vigor. If the price rebounds off this level, the pair could consolidate between $80.83 and $116 for a few days. If the price turns up from the current level and breaks above the 20-day EMA, the pair could rally to the resistance line of the channel. A break and close above the channel will indicate that the downtrend could be over.AVAX/USDTAvalanche (AVAX) bounced off the uptrend line on Feb. 14 and surged to the downtrend line on Feb. 15. The bulls pushed the price above the downtrend line on Feb. 16 but the long wick on the candlestick shows that bears are selling at higher levels.AVAX/USDT daily chart. Source: TradingViewThe moving averages are close to completing a bullish crossover and the RSI is knocking on the overhead resistance near 62. This suggests that bulls have the upper hand. If buyers sustain the price above the downtrend line, the AVAX/USDT pair could start a rally to $117.53.Conversely, if the price turns down and breaks below the downtrend line, it will suggest that the current breakout may have been a bear trap. The pair could then again drop to the moving averages. The trend could turn in favor of the bears on a break and close below the uptrend line.Related: Bitcoin dips before Fed rate hike cues amid warning over $9T balance sheetLUNA/USDTTerra’s LUNA token broke and closed above the 20-day EMA ($56) on Feb. 15, but the bulls are struggling to sustain the higher levels. This suggests that bears continue to sell on rallies.LUNA/USDT daily chart. Source: TradingViewThe bears have pulled the price back below the 20-day EMA and will now attempt to break the support at $54.20. If that happens, the LUNA/USDT pair could decline to $49.39. If this support also cracks, the next stop could be $43.44.Conversely, if the price rebounds off $54.20, the pair could resume its relief rally to the downtrend line of the descending channel. The bulls will have to push and sustain the price above this resistance to indicate that the downtrend may be over.DOGE/USDTDogecoin (DOGE) broke and closed above the 20-day EMA ($0.14) on Feb. 15 but the recovery is again facing strong selling at the 50-day SMA ($0.15).DOGE/USDT daily chart. Source: TradingViewThe 20-day EMA has flattened out and the RSI is just below the midpoint, indicating a balance between supply and demand. If bulls push and close the price above the 50-day SMA, the DOGE/USDT pair could challenge the overhead resistance at $0.17. If bulls clear this hurdle, the pair could pick up momentum and rally to $0.22. On the other hand, if the price turns down from the current level and plummets below $0.14, the pair could drop to $0.13 and later to the critical support at $0.12.DOT/USDTThe long tail on Polkadot’s (DOT) Feb. 14 candlestick shows that bulls are buying on dips near the strong support level at $16.81. The recovery reached the 20-day EMA ($20.16) on Feb. 15 but the bulls could not clear this hurdle.DOT/USDT daily chart. Source: TradingViewThis indicates that bears have not yet given up and are mounting a strong defense in the zone between the 20-day EMA and the downtrend line. If the price continues lower, the bears will try to pull the DOT/USDT pair below $16.81 and resume the downtrend.Alternatively, if the price rebounds off $16.81, the pair will again attempt to break above the overhead zone and reach $23.19. A break and close above this resistance will signal a possible change in trend.The views and opinions expressed here are solely those of the author and do not necessarily reflect the views of Cointelegraph. Every investment and trading move involves risk. You should conduct your own research when making a decision.Market data is provided by HitBTC exchange.

Čítaj viac

Price analysis 2/14: BTC, ETH, BNB, XRP, ADA, SOL, LUNA, DOGE, AVAX, DOT

Bitcoin (BTC) is attempting to form a higher low as investors take advantage of lower levels to accumulate. Twitter user PlanC recently highlighted that the balance of addresses having at least two significant incoming transactions but no outgoing transactions has soared to a 57 month high.However, not everyone is bullish on the future prospects of Bitcoin. Popular analyst Ari Rudd presented three long-term technical setups, which point to further downside in Bitcoin. Rudd believes that Bitcoin could offer a buying opportunity in the $24,000 to $27,000 range.Daily cryptocurrency market performance. Source: Coin360Data compiled by Bloomberg shows that Bitcoin price has been calmer compared to the Nasdaq 100 index in 2022. There have been only five occasions this year when Bitcoin has moved more than one standard deviation from its average in either direction, while the Nasdaq 100 has seen 12 such moves.Generally, periods of low volatility are followed by range expansion. Hence, traders may remain cautious because a sharp drop in the Nasdaq 100 could accelerate selling in Bitcoin.Let’s study the charts of the top-10 cryptocurrencies to spot the critical support and resistance levels.BTC/USDTBitcoin is attempting to rebound off the 20-day exponential moving average ($41,493), indicating that the sentiment has turned positive and traders are buying on dips.BTC/USDT daily chart. Source: TradingViewThe bulls will attempt to push and sustain the price above the overhead resistance at $45,821. If they manage to do that, the BTC/USDT pair will complete a bullish inverse head and shoulders pattern. The pair could first rally to the psychological level at $50,000 and if this level is crossed, the rally may reach the stiff overhead resistance at $52,088.Contrary to this assumption, if the price turns down from the current level or the overhead resistance, it will suggest that bears continue to sell on rallies. The pair could then drop to $39,600. The bears will have to pull the price below this support to gain the upper hand.ETH/USDTEther (ETH) plunged below the 20-day EMA ($2,934) and re-entered the descending channel on Feb. 11, indicating selling at higher levels. A minor positive is that the price has been clinging to the 20-day EMA in the past two days. ETH/USDT daily chart. Source: TradingViewThe flattish 20-day EMA and the relative strength index (RSI) just below the midpoint suggest a balance between supply and demand. If the price breaks and sustains above the 20-day EMA, the buyers will make one more attempt to push the ETH/USDT pair above the overhead resistance zone at $3,283.66 to $3,411.43.If they succeed, the pair will complete an inverted H&S pattern. This reversal setup has a target objective at $4,408.On the other hand, if the price once again turns down from the overhead resistance, it will suggest that bears continue to sell on rallies. That will increase the prospects of a drop to the strong support at $2,652.BNB/USDTBinance Coin (BNB) broke and closed below the 20-day EMA ($407) on Feb. 11, indicating that traders who bought at lower levels may be booking profits.BNB/USDT daily chart. Source: TradingViewHowever, a minor positive is that the bulls have not allowed the bears to have their way and are buying the dips below $400. The 20-day EMA is flat but the RSI has dropped near 47, suggesting a minor edge to the bears.If the price sustains below $400, the possibility of a drop to $347.40 increases. This negative view will invalidate if the BNB/USDT pair turns up from the current level and breaks above the 50-day simple moving average ($439). The pair could then start its journey toward the psychological level at $500.XRP/USDTRipple’s (XRP) sharp rebound off the breakout level at $0.75 turned down from $0.85, indicating that bears are selling on rallies. The bears will now attempt to pull the price below $0.75.XRP/USDT daily chart. Source: TradingViewIf they manage to do that, the selling could intensify as traders who bought at lower levels or on a break above $0.75 may rush to the exit. That could pull the XRP/USDT pair to $0.65 and then to $0.60.On the other hand, if the price rises from the current level or rebounds off $0.75, it will suggest that bulls are accumulating near the breakout level. The buyers will then make one more attempt to resume the up-move by pushing the price above the $0.85 to $0.91 resistance zone.ADA/USDT Cardano (ADA) broke below the 20-day EMA ($1.11) on Feb. 11 and has reached the strong support at $1. The repeated retest of a support level tends to weaken it.ADA/USDT daily chart. Source: TradingViewThe downsloping moving averages and the RSI in the negative territory indicate that bears are in control. A break and close below $1 could signal the resumption of the downtrend. The ADA/USDT pair could then drop to $0.80.Contrary to this assumption, if bulls once again manage to defend the $1 support, the pair will attempt to rally above the moving averages. The buyers will have to push and sustain the price above the channel to indicate a possible change in trend.SOL/USDTSolana (SOL) continues to trade inside the descending channel pattern and is gradually correcting toward the strong support at $80.83. The 20-day EMA ($106) has started to turn down once again and the RSI is in the negative territory, indicating that bears have the upper hand.SOL/USDT daily chart. Source: TradingViewThe SOL/USDT pair could now slide to the strong support at $80.83. This is an important level to watch out for because if it cracks, the selling could intensify and the pair could drop to the support line of the channel.On the contrary, if the price turns up from the current level or rebounds off $80.83, the bulls will try to push the pair to the resistance line of the channel. A break and close above this level will be the first sign that the downtrend could be over.LUNA/USDTTerra’s LUNA token has been trading below $54.20 for the past three days but a minor positive is that the bulls have not allowed the price to break and sustain below the psychological level at $50.LUNA/USDT daily chart. Source: TradingViewThe first sign of strength will be a break and close above the 20-day EMA ($56) which will indicate that the bears may be losing their grip. The bulls will then attempt to push the price to the downtrend line of the descending channel where the bears may again pose a stiff challenge.Conversely, if bulls fail to push the price above the 20-day EMA within the next few days, the selling could intensify and the LUNA/USDT pair could slide toward the strong support at $43.44. The downsloping moving averages and the RSI in the negative territory indicate that bears have a slight advantage.Related: Bitcoin kisses 50-day moving average as trader predicts fresh BTC price volatilityDOGE/USDTDogecoin (DOGE) broke and closed below the 20-day EMA ($0.14) on Feb. 11. Attempts by the bulls to reclaim the level failed on Feb. 12 as the price turned down from the 50-day SMA ($0.15).DOGE/USDT daily chart. Source: TradingViewThe 20-day EMA is flattish but the RSI has dipped below 47, indicating that bears are attempting to gain the upper hand. If sellers sink the price below $0.14, the DOGE/USDT pair may decline to the critical support at $0.12.Contrary to this assumption, if the price turns up from the current level and breaks above the moving averages, it will suggest that bulls are accumulating on dips. The buyers will then try to push the pair above $0.17 and extend the up-move to $0.22.AVAX/USDTAvalanche (AVAX) turned down from the downtrend line on Feb. 10 and has dipped to the uptrend line, indicating that the traders who bought at lower levels may be exiting their positions.AVAX/USDT daily chart. Source: TradingViewThe 20-day EMA ($79) is flat and the RSI is just above the midpoint, indicating a balance between supply and demand. If the price breaks and sustains below $75.50, the possibility of a drop to $64.85 and then to $61 increases. Alternatively, if the price rebounds off the current level, the bulls will again try to drive the price above the downtrend line. If they succeed, it will signal that the downtrend could be over. The pair could then rise to $100 and later to $117.53.DOT/USDTPolkadot (DOT) turned down from the downtrend line on Feb. 8 and could now drop to the strong support at $16.81. Both moving averages have started to turn down and the RSI is in the negative territory, indicating that bears are in command.DOT/USDT daily chart. Source: TradingViewIf bears pull the price below $16.81, the selling could pick up further and the DOT/USDT pair could drop to the next major support at $10.37. Contrary to this assumption, if the price rebounds off the current level or $16.81, the bulls will attempt to push the pair above the downtrend line.If they manage to do that, the pair could rise to the overhead resistance at $23.19. If the price turns down from this level, the pair could remain range-bound for a few more days. The bulls are likely to gain the upper hand on a break and close above $23.19.The views and opinions expressed here are solely those of the author and do not necessarily reflect the views of Cointelegraph. Every investment and trading move involves risk. You should conduct your own research when making a decision.Market data is provided by HitBTC exchange.

Čítaj viac

Top 5 cryptocurrencies to watch this week: BTC, XRP, CRO, FTT, THETA

Bitcoin (BTC) has given back some of its recent gains, but on-chain data resource Ecoinometrics said that whales are accumulating because they believe the price is attractive from a long-term perspective.On the downside, analyst Willy Woo believes that $33,000 is a strong bottom for Bitcoin. Popular Twitter trader Credible Crypto citing data from PlanC said that the odds of Bitcoin declining below $30,000 are poor. Crypto market data daily view. Source: Coin360Fidelity Digital Assets Head of Research Chris Kuiper believes that Bitcoin’s downside risk could be minimal when compared to other digital assets, but it could rally substantially if it manages to replace gold as a store of value.Could Bitcoin and altcoins stage a recovery after the recent pullback? Let’s study the charts of the top-5 cryptocurrencies that may attract investor attention in the short term.BTC/USDTBitcoin turned down from the overhead resistance at $45,456 but a minor positive is that the bulls have not allowed the price to break below the 20-day exponential moving average ($41,383).BTC/USDT daily chart. Source: TradingViewIf the price rebounds off the current level, the bulls will try to propel the BTC/USDT pair above $45,456. A close above this level will complete a bullish inverse head and shoulders pattern. The pair could then rally to $52,088 where the bears are likely to mount a strong challenge. If bulls thrust the price above this level, the pair could start its northward march toward the pattern target at $56,904.This positive view will be negated if the price breaks and sustains below $39,600. Such a move could open the doors for a possible drop to $36,250.BTC/USDT 4-hour chart. Source: TradingViewThe pair turned down from $45,456 and broke below the moving averages. The bulls are currently attempting to defend the minor support at $41,688.88 but are facing stiff resistance at the moving averages.If the price turns down from the current level and breaks below $41,688.88, the pair could slide to $39,600. If the price rebounds off this level, then the pair could remain range-bound between $39,600 and $45,456 for a few days.On the upside, a break and close above the moving averages will be the first indication that bulls have a slight edge. The pair could then rise to $43,920 and later to $45,456.XRP/USDTRipple (XRP) broke and closed above the moving averages on Feb. 7, indicating that the downtrend could be coming to an end. The bears tried to pull the price back below the breakout level at $0.75 but the bulls thwarted their attempt.XRP/USDT daily chart. Source: TradingViewThe price rebounded off $0.75 and the bulls are trying to push the XRP/USDT pair toward the overhead resistance at $1. A break and close above this resistance could open the doors for a possible rally to $1.41.The moving averages are on the verge of a bullish crossover and the relative strength index (RSI) is in the positive zone, indicating that buyers have the upper hand. This positive view will invalidate on a break and close below $0.75. Such a move will indicate that bears continue to sell on rallies.XRP/USDT 4-hour chart. Source: TradingViewThe 4-hour chart shows that the bulls and the bears are battling it out near the $0.82 mark. The bulls pushed the price above this level but the bears stalled the rally at $0.85 and have pulled the pair back below $0.82.A minor positive is that bulls are buying the dips to the 50-SMA. If the price rebounds off this support, the bulls will try to drive the pair above $0.85 and challenge the resistance at $0.91. Conversely, a break and close below the 50-SMA could pull the pair to $0.75. A break and close below this support could indicate the start of a deeper correction.CRO/USDTCrypto.com’s native coin (CRO) broke above the 50-day SMA ($0.47) on Feb. 7, suggesting that the corrective phase could be over. The price rallied to $0.54 on Feb. 10 where the bears are mounting a strong defense.CRO/USDT daily chart. Source: TradingViewThe moving averages are on the verge of a bullish crossover and the RSI is in the positive territory, indicating that the buyers have a slight edge. If the current rebound off the moving averages sustains, it will suggest that bulls are buying on dips. The bulls will then attempt to push the price above $0.54 and resume the uptrend.If they can pull it off, the CRO/USDT pair could rise to $0.60 and then to $0.68. Contrary to this assumption, if the price turns down and breaks below the 20-day EMA, the pair could drop to $0.39. CRO/USDT 4-hour chart. Source: TradingViewThe 4-hour chart shows the pair is rising inside an ascending channel pattern. The bulls tried to push the price above the channel but the bears had other plans. They pulled the price back into the channel, trapping the aggressive bulls.The buyers are attempting to defend the 50-SMA. If the price sustains above the 20-EMA, the bulls will again try to push the pair above the resistance line of the channel. This positive view will invalidate if the price turns down and plummets below the support line of the channel.Related: Can XRP price reach $1 after 25% gains in one week? Watch this key support levelFTT/USDTFTX Token (FTT) has been volatile inside a broadening formation. The failure of the buyers to propel the price above the resistance line indicates that bears are selling the rallies to this level.FTT/USDT daily chart. Source: TradingViewHowever, a minor positive is that bulls are buying the dips in the zone between the 20-day EMA ($43.85) and the 50-day SMA ($41.50). If the price rebounds off the current level, the buyers will make one more attempt to clear the overhead hurdle.If they manage to do that, the FTT/USDT pair could start a new uptrend. The pair could then rally to $53.50 where the bears may again pose a strong challenge but if this resistance is crossed, the rally could extend to $65.This bullish view will invalidate if the price turns down and plummets below the 50-day SMA. That will indicate that the pair could extend its stay inside the broadening pattern for a few more days.FTT/USDT 4-hour chart. Source: TradingViewThe failure of the bulls to push the price above the $48 to $50 overhead resistance zone may have attracted profit-booking from short-term traders. The pair has broken below both moving averages and could drop to the 38.2% Fibonacci retracement levels at $41.99.If the price rises from the current level or $41.99, it will suggest that buyers are accumulating on dips. The bulls will then again try to push the price above the 50-SMA. If they succeed, the pair could challenge the overhead resistance.On the downside, a break and close below $41.99 could signal the start of a deeper correction to the 50% retracement level at $39.95. THETA/USDTTheta Network (THETA) broke and closed above the downtrend line on Feb.10, indicating that the downtrend could be coming to an end. Generally, a rally above a stiff resistance tends to turn back and retest the breakout level.THETA/USDT daily chart. Source: TradingViewIf bulls succeed in flipping the breakout level into support, it suggests a change in sentiment from sell on rallies to buy on dips. The 20-day EMA ($3.49) has started to turn up and the RSI is in the positive territory, suggesting advantage to buyers.If the price rebounds off the downtrend line, the bulls will attempt to start a new uptrend. A break and close above $4.39 could attract further buying and the THETA/USDT pair could rise toward $6. This bullish view will invalidate if the price turns down from the current level and plummets below the downtrend line. Such a move will suggest that the break above the downtrend line could have been a bull trap.THETA/USDT 4-hour chart. Source: TradingViewThe pair has been rising inside an ascending channel pattern. The bulls tried to push the price above the resistance line of the channel but the bears did not relent. This may have led to profit-booking by the short-term bears, pulling the price toward the support line.The price has bounced off the support line on three previous occasions hence, the bulls will again try to defend it. If the price rebounds off the level and rises above the downtrend line, it will signal the resumption of the uptrend.Alternatively, a break and close below the support line of the channel could signal a deeper correction to $3.20.The views and opinions expressed here are solely those of the author and do not necessarily reflect the views of Cointelegraph. Every investment and trading move involves risk, you should conduct your own research when making a decision.

Čítaj viac

Price analysis 2/11: BTC, ETH, BNB, XRP, ADA, SOL, LUNA, AVAX, DOT, DOGE

Bitcoin (BTC) is attempting to bottom out and whales seem to be helping it do that. Coin Metrics data shows that whale addresses holding at least 1,000 Bitcoin have been accumulating in the past few days. The total supply of these addresses rose from 7.95 million Bitcoin on Jan. 24 to 8.096 million on Feb. 10.Another sign that investor sentiment could be turning positive is that crypto exchange balances of stablecoins have soared above $27 billion for the first time, according to on-chain analytics platform CryptoQuant. In comparison, Bitcoin reserves on the exchanges have continued to slide, indicating that investors are stashing their holdings.Daily cryptocurrency market performance. Source: Coin360Although Bitcoin has been closely correlated with the U.S. equity markets in the short term, Zhu Su, co-founder of hedge fund Three Arrows Capital (3AC), believes their performance will diverge in 2022. Zhu suggested that Bitcoin and Ether (ETH) are candidates for going long while the S&P 500 is a short candidate.After the recent recovery in Bitcoin and altcoins, is it time for a minor correction or consolidation? Let’s study the charts of the top-10 cryptocurrencies to find out.BTC/USDTBitcoin turned down from the overhead resistance at $45,456 on Feb. 10, indicating that bulls continue to defend the level aggressively. A minor positive is that bulls have not allowed the price to break below the 50-day simple moving average ($42,427).BTC/USDT daily chart. Source: TradingViewThis indicates that bulls are attempting to flip the 50-day SMA into support. The rising 20-day exponential moving average ($41,317) and the relative strength index (RSI) in positive territory indicate a slight advantage to buyers.If the price bounces off the current level, the bulls will make one more attempt to push the BTC/USDT pair above $45,456. If they succeed, the bullish momentum could pick up and the pair may rise to $48,000 and later to $52,088.Contrary to this assumption, if the price turns down from the current level or from $45,456, the bears will fancy their chances and attempt to pull the pair below the 20-day EMA. If that happens, the pair could drop to $39,600.ETH/USDTEther broke and closed above the 50-day SMA ($3,171) on Feb. 9, but the bulls could not build upon this strength. The price turned back below the 50-day SMA on Feb. 10 which suggests that bears are attempting to trap the aggressive bulls.ETH/USDT daily chart. Source: TradingViewHowever, a positive sign is that the bulls have not allowed the price to break back into the channel. If the price rebounds off the 20-day EMA ($2,959), the buyers will again attempt to push the ETH/USDT pair above the overhead hurdle.The zone between the 50-day SMA and $3,400 could act as a major roadblock. If buyers clear this hurdle, the pair could start a new up-moveContrary to this assumption, if the price re-enters the channel, it will suggest that sentiment remains negative and traders are selling on rallies. The pair could then drop to the critical support at $2,652.BNB/USDTBinance Coin (BNB) is struggling to break above the downtrend line of the descending channel. This suggests that bears are defending the resistance with all their might.BNB/USDT daily chart. Source: TradingViewThe flattish 20-day EMA ($410) and the RSI near the midpoint suggest a balance between supply and demand. If the price breaks below the 20-day EMA, it will increase the prospects of the BNB/USDT pair staying inside the channel for a few more days. The pair could first slip to $390 and then continue its downward move to $357.40.On the contrary, if the price rebounds off the current level, the bulls will make one more attempt to propel the pair above the channel and the 50-day SMA ($448). If they succeed, the pair could gradually rise to $500.XRP/USDTRipple (XRP) is witnessing profit-booking after the recent rally. The price could drop to the breakout level at $0.75 where the buyers may step in to arrest the decline. XRP/USDT daily chart. Source: TradingViewThe rising 20-day EMA ($0.73) and the RSI in the positive territory indicate that bulls have the upper hand. The buyers will now attempt to defend the support at $0.75.If the price rebounds off this level, the buyers will again attempt to drive the XRP/USDT pair above $0.92 and challenge the psychological resistance at $1.This bullish view will invalidate in the short term if the price breaks below the 20-day EMA. Such a move could open the doors for a decline to $0.65.ADA/USDT Cardano (ADA) has repeatedly failed to break above the 50-day SMA ($1.22) in the past few days, indicating that bears are defending this level with vigor. The sellers will now attempt to sink and sustain the price below the 20-day EMA.ADA/USDT daily chart. Source: TradingViewIf they manage to do that, the ADA/USDT pair could drop to the critical support at $1. This is an important level for the bulls to defend because a break and close below it could intensify selling. The pair could then slide to $0.80.The moving averages have flattened out and the RSI is near the midpoint, indicating a balance between supply and demand. If the price bounces off the current level and breaks above the 50-day SMA, the pair could rise to the resistance line of the descending channel. A break and close above this level will signal a positive change in trend.SOL/USDTSolana (SOL) turned down from the overhead resistance at $116 and broke back below the 20-day EMA ($111) on Feb. 10. This suggests that the sentiment remains negative and bears are selling on rallies to resistance levels.SOL/USDT daily chart. Source: TradingViewThe SOL/USDT pair could now slide to $94 and then to the strong support at $80.83. This is an important level for the bulls to defend because a break and close below it could signal the resumption of the downtrend. The pair could then drop to the support line of the channel.The first sign of a trend change will happen on a break and close above the resistance line of the channel. Such a move could signal the start of a possible new uptrend. The pair could then rally to $157.80.LUNA/USDTThe bulls have repeatedly failed to push Terra’s LUNA token above the 20-day EMA ($57.80) in the past few days, which suggests that bears are defending the level aggressively. Hence, this becomes a key resistance to watch on the upside.LUNA/USDT daily chart. Source: TradingViewThe downsloping 20-day EMA and the RSI in the negative territory indicate that bears have the upper hand. If the price sustains below $54.20, the LUNA/USDT pair could slip down to the strong support at $43.44.This negative view will invalidate if the price turns up from the current level and breaks above $60.64. The pair could then rally to the downtrend line of the descending channel where the bears may again pose a strong challenge to buyers.Related: Bitcoin stuck in a tight range as BTC price moving averages prepare key bullish crossAVAX/USDTThe downtrend line is proving to be a tough barrier for the bulls to cross. This indicates that higher levels continue to attract selling by the bears. If Avalanche (AVAX) breaks below the 50-day SMA ($87), a drop to the 20-day EMA ($80) is possible.AVAX/USDT daily chart. Source: TradingViewIf the price rebounds off the 20-day EMA, it will suggest that traders are buying on dips. The bulls will then again try to thrust the price above the downtrend line and start a new up-move. If they manage to do that, the AVAX/USDT pair could rally to $117.53.Conversely, if the price breaks below the support zone between the 20-day EMA and $75.50, it will suggest that the sentiment remains negative and traders are selling on rallies. The pair could then drop to $64.85.DOT/USDTPolkadot (DOT) slipped and closed below the 20-day EMA ($20.96) on Feb. 10, indicating that bears are aggressively defending the overhead resistance zone between $22.66 and the 50-day SMA ($23.75).DOT/USDT daily chart. Source: TradingViewThe flattish moving averages and the RSI below 46 suggest that bears have a slight edge in the short term. If the price sustains below the 20-day EMA, the DOT/USDT pair could slide to the strong support at $16.81. If the price rebounds off this support, the pair could remain range-bound for a few more days.Contrary to this assumption, if the price turns up from the current level and rises above the 50-day SMA, it will suggest that bears may be losing their edge. The pair could then start its up-move to $28.DOGE/USDTDogecoin (DOGE) again stumbled at the 50-day SMA ($0.15) on Feb. 9 and 10, indicating that bears are aggressively defending this resistance. Both moving averages are flattening out and the RSI is near the midpoint, suggesting a range-bound action in the short term.DOGE/USDT daily chart. Source: TradingViewIf the price slips and sustains below the 20-day EMA ($0.15) traders who bought the recent dip may close their positions. This could pull the DOGE/USDT pair toward the strong support zone between $0.10 to $0.12.Instead, if the price rebounds off the current level, the buyers will make one more attempt to push the pair above the overhead resistance at $0.17. If they manage to do that, the pair could rally to $0.22.The views and opinions expressed here are solely those of the author and do not necessarily reflect the views of Cointelegraph. Every investment and trading move involves risk. You should conduct your own research when making a decision.Market data is provided by HitBTC exchange.

Čítaj viac

Získaj BONUS 8 € v Bitcoinoch

nakup bitcoin z karty

Registrácia Binance

Burza Binance

Aktuálne kurzy