Autor Cointelegraph By Rakesh Upadhyay

Top 5 cryptocurrencies to watch this week: BTC, LUNA, AVAX, ATOM, FTM

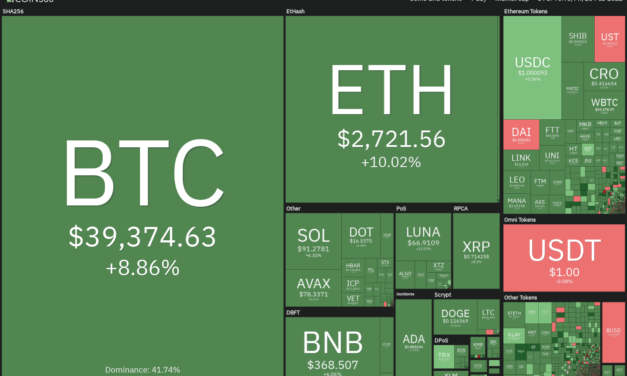
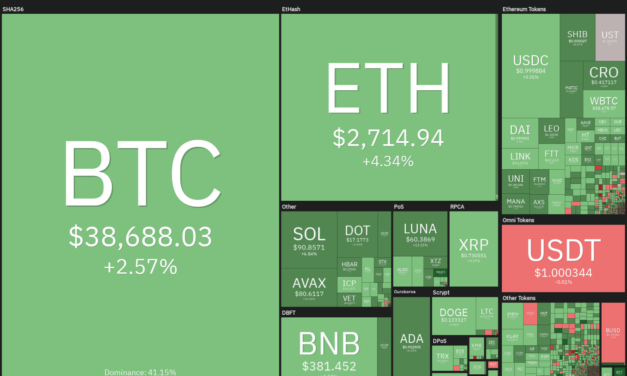
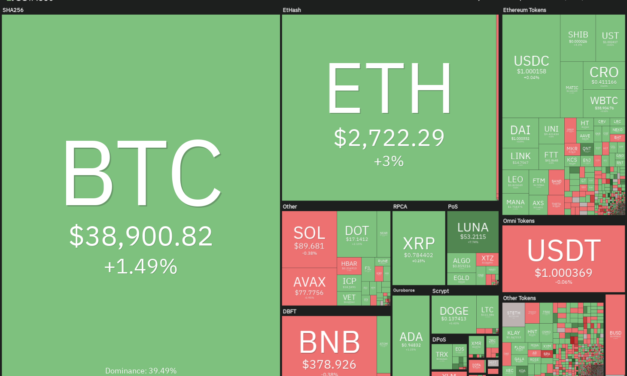
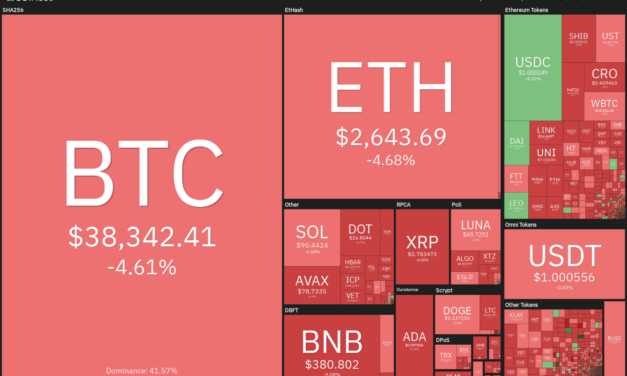
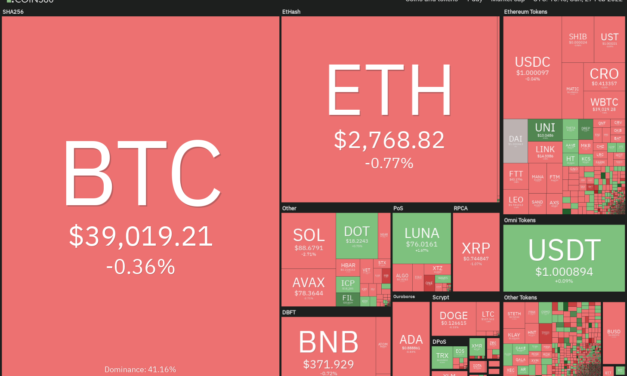
The geopolitical news flow is likely to result in volatile moves in Bitcoin (BTC) and altcoins in the next few days. News of Russian President Vladimir Putin ordering the nuclear deterrence forces on high alert may be viewed as a negative, but reports of talks between the warring nations could be positive as it raises hopes of an end to the conflict.The crypto community came into focus as the Ukrainian government called for help and sought crypto donations. Some individuals on social media said their Ukrainian credit cards had stopped working and they were not able to withdraw money from their banks. They highlighted how crypto was the only money left with them. Crypto market data daily view. Source: Coin360While some analysts are projecting that Bitcoin may have bottomed out, Cointelegraph contributor Marcel Pechman warned that derivatives data remains inconclusive. Similarly, Ether futures data was also not painting a hugely bullish picture. The near-term price action will be dictated by the developments in the Russia-Ukraine war. Let’s study the charts of the top-5 cryptocurrencies that may lead the recovery on news of a peaceful resolution to the ongoing conflict.BTC/USDTBitcoin’s rebound off the Feb. 24 intraday low at $34,322 reached the moving averages on Feb. 26 where the bears are mounting a strong resistance. However, a minor positive is that the bulls have not given up much ground. BTC/USDT daily chart. Source: TradingViewThe moving averages are flattening out and the relative strength index (RSI) is attempting to rise to the midpoint, signaling that bulls are making a comeback. If bulls drive and sustain the price above the moving averages, the BTC/USDT pair could rally to the overhead resistance at $45,821. This level is likely to attract strong selling by the bears.Contrary to this assumption, if the price turns down from the moving averages, the pair could consolidate between $39,600 and $36,250 for a few days. A break and close below this support could open the doors for a possible drop to $32,900.BTC/USDT 4-hour chart. Source: TradingViewThe 4-hour chart shows that the price has been trading in a tight range between $38,200 and $39,600. The rising 20-exponential moving average and the RSI just above the midpoint indicate a minor advantage to buyers.A breakout and close above $39,600 could push the price to $41,000 and thereafter to $42,000. The bears are likely to mount a strong resistance in this zone. If the price turns down from this zone but does not dip back below $39,600, it will suggest that the sentiment has changed from sell on rallies to buy on dips. That could increase the prospects of the continuation of the up-move.Conversely, a break and close below $38,200 will indicate aggressive selling near $39,600. The pair could then again drop toward $36,250. LUNA/USDTTerra’s LUNA token picked up bullish momentum after breaking and closing above the downtrend line. Strong buying pushed the price above the minor resistance at $70 on Feb. 25.LUNA/USDT daily chart. Source: TradingViewThe moving averages are on the verge of a bullish crossover but the RSI is near the overbought zone. This suggests that bulls have the upper hand but the LUNA/USDT pair could witness a minor correction or consolidation in the near term.On the downside, the bulls are likely to defend the breakout level at $70 and below that the 20-day EMA ($60). If the price rebounds off either support, the pair could extend its rally to $90 where the bears may again offer stiff resistance. This bullish view will be negated on a break and close below the 20-day EMA.LUNA/USDT 4-hour chart. Source: TradingViewThe 4-hour chart shows that the pair had been trading between $47 and $60 for many days. A break and close above $60 signaled the start of a possible new up-move. The 20-EMA is sloping up and the RSI is in the positive zone, indicating advantage to buyers.If bulls defend the 20-EMA, the possibility of the continuation of the uptrend increases. The pair could then rise above $80 and later rally to the overhead resistance zone between $84 to $87. Conversely, if the price turns down and slips below $70, the pair could drop to $64.AVAX/USDTAvalanche (AVAX) has been trading inside the descending channel for the past few days. The price broke below the moving averages on Feb. 20 but the bulls reclaimed the level on Feb. 25, indicating strong buying at lower levels.AVAX/USDT daily chart. Source: TradingViewThe bulls will now attempt to push the price to the downtrend line of the descending channel. This is an important level to watch out for because a break and close above it will indicate a possible change in trend. The AVAX/USDT pair could first rally to $100 and thereafter start an up-move to $120.Alternatively, if the price turns down from the downtrend line, the pair could drop to the moving averages. If the price rebounds off this level, the possibility of a break above the channel increases.This bullish view will invalidate if the price turns down from the current level or the overhead resistance and breaks below $70. AVAX/USDT 4-hour chart. Source: TradingViewThe price has been trading between the overhead resistance at $83 and the moving averages. The 20-EMA is flattening out and the RSI is near the midpoint, indicating a balance between supply and demand.This balance will shift in favor of the bears if they pull the price below $76. The pair could then drop to the next support at $73. Alternatively, if the price rebounds off the current level and breaks above $83, the pair could pick up momentum and rally to the overhead resistance zone at $97 to $100. Related: Terra’s Mirror Protocol MIR rebounds 40% two days after crashing to record lowATOM/USDTCosmos (ATOM) rebounded from the strong support at $20 on Feb. 24. This indicates that traders are attempting to keep the $20 to $45 range intact. ATOM/USDT daily chart. Source: TradingViewThe price rose above the 20-day EMA ($27) on Feb. 26 and the bulls are attempting to sustain the ATOM/USDT pair above this level. The 20-day EMA is flattening out and the RSI is just above the midpoint, indicating that bulls are attempting a comeback.If bulls drive and sustain the price above the 50-day simple moving average ($31), the pair could rally to $37. Contrary to this assumption, if the price turns down and slips below the 20-day EMA, it will suggest that bears are defending the overhead resistance at the 50-day SMA. The pair could then drop to $24.ATOM/USDT 4-hour chart. Source: TradingViewThe bulls have pushed the price above the moving averages and the downtrend line on the 4-hour chart. The 20-EMA has started to turn up and the RSI is in the positive territory, indicating that bulls have the upper hand.If the pair sustains above the downtrend line, the bulls will attempt to clear the barrier at $31 and push the price to $34. Contrary to this assumption, if the price turns down and slips below the 20-EMA, the pair may drop to the 50-SMA.FTM/USDTFantom (FTM) has been trading inside a large range between $1.24 and $3.38 for the past several months. The price rebounded sharply off the support of the range on Feb. 24, indicating that bulls continue to buy at this level.FTM/USDT daily chart. Source: TradingViewThe rebound has reached the 20-day EMA ($1.82) which is acting as a strong resistance. If bulls drive and sustain the price above this level, the FTM/USDT pair could reach the 50-day SMA ($2.18). A break above this level could clear the path for a possible up-move to $2.60.Contrary to this assumption, if the price turns down from this level, the pair could consolidate between the 20-day EMA and $1.24 for a few more days. The critical level to watch on the downside is $1.24 because if this level cracks, the pair could start a new downtrend. FTM/USDT 4-hour chart. Source: TradingViewThe moving averages have completed a bullish crossover on the 4-hour chart indicating that the short-term downtrend could be over. If the price rebounds off the moving averages, it will suggest that traders are buying on dips.The buyers will then attempt to push and sustain the price above the downtrend line. If they manage to do that, the pair could rise to $2.14 and then to $2.40. This positive view will invalidate in the short term if the pair sustains below the moving averages. Such a move will indicate that bears are active at higher levels.The views and opinions expressed here are solely those of the author and do not necessarily reflect the views of Cointelegraph. Every investment and trading move involves risk, you should conduct your own research when making a decision.

Čítaj viac

Price analysis 2/25: BTC, ETH, BNB, XRP, ADA, SOL, AVAX, LUNA, DOGE, DOT

The U.S. equity markets and Bitcoin (BTC) have rebounded sharply from their Feb. 24 lows while gold has made a retreat from its recent highs. This indicates that investors may be buying risky assets and reducing exposure to assets perceived as a safe haven.Recent reports also suggest that Russian President Vladimir Putin may send a delegation to negotiate with Ukraine and this raises hope that the conflict could end sooner than analysts expect.Some analysts believe that the U.S. Federal Reserve may not raise rates aggressively in March due to the geopolitical situation. Allianz chief economic advisor Mohamed El-Erian believes that the March 50 basis point rate hike is “completely off the table.” Daily cryptocurrency market performance. Source: Coin360Dr. Raullen Chai, the co-founder and CEO of blockchain network IoTeX, told Cointelegraph that investors should refrain from selling their crypto holdings with the expectation of buying again at a lower price. He cautioned that the market could “easily reach new all-time highs by the end of the year.”Could bulls build upon the strong bounce off the lower levels or will bears sell at higher levels and pull the price down? Let’s analyze the charts of the top-10 cryptocurrencies to find out.BTC/USDTBitcoin formed an outside-day candlestick pattern on Feb. 24. The bears pulled the price below the immediate support at $36,250 but the long tail on the day’s candlestick indicates strong buying by the bulls at lower levels.BTC/USDT daily chart. Source: TradingViewIf buyers push the price above the moving averages, the BTC/USDT pair could rally toward the overhead resistance at $45,821. Such a move will suggest that the bears may be losing their grip. The longer the price sustains above the moving averages, the greater the possibility that a bottom has been made.Conversely, if the price turns down from the moving averages, it will suggest that the sentiment remains negative and traders are selling on rallies. The bears will then make one more attempt to sink and sustain the pair below $36,250. If they manage to do that, the pair could drop to the strong support zone between $34,322 and $32,917.ETH/USDTEther (ETH) broke below the support line of the symmetrical triangle on Feb. 24 but the bears could not sustain the lower levels. The long tail on the day’s candlestick indicates strong buying at lower levels.ETH/USDT daily chart. Source: TradingViewThe ETH/USDT pair has re-entered the triangle and the bulls are attempting to push the price above the moving averages. If they succeed, the pair could rise to the resistance line of the triangle. A break and close above this level could indicate the start of a new possible uptrend.Contrary to this assumption, if the price turns down from the moving averages, the bears will again try to pull the pair below the support line of the triangle. If that happens, the pair could retest $2,300. If this support also cracks, the decline could extend to $2,159BNB/USDTBNB plummeted to the strong support zone at $330 to $320 on Feb. 24 where the buyers stepped in and arrested the decline. The strong rebound pushed the price back above the breakdown level at $350.BNB/USDT daily chart. Source: TradingViewThe bulls are attempting to propel the price to the moving averages where the bears are expected to mount a strong defense. If the price turns down from the moving averages, the bears will again attempt to sink and sustain the BNB/USDT pair below $350 and challenge the support zone.Alternatively, if bulls drive the price above the 50-day simple moving average (SMA) ($411), it will suggest that the selling pressure could be reducing. The pair may then rally to the overhead resistance at $445. XRP/USDTRipple (XRP) rebounded off the $0.62 support on Feb. 24 but the bulls could not push the price above the overhead resistance at the 50-day SMA ($0.72). This resulted in the formation of a long-legged Doji candlestick pattern.XRP/USDT daily chart. Source: TradingViewThe bulls are again attempting to drive the price above the moving averages. If they manage to do that, the XRP/USDT pair could rally to the downtrend line. The bulls will have to clear this hurdle to signal a possible change in the short-term trend. The pair could then attempt an up-move to $0.91 and later to $1.Conversely, if the price turns down from the moving averages, it will suggest that bears continue to sell on rallies. The bears will then resume their selling and try to pull the pair to the strong support zone at $0.62 to $0.55.ADA/USDT Cardano (ADA) continues to be in a strong downtrend and the price has been trading below the critical level at $1 for the past few days. The long tail on Feb. 25 candlestick shows that bulls bought the dip to $0.74. ADA/USDT daily chart. Source: TradingViewThe downsloping moving averages and the relative strength index (RSI) below 37 suggest that bears are in control. If the price turns down from the current level or the overhead resistance at $1, it will suggest that bears continue to sell on rallies. The bears will then attempt to pull the pair below $0.74.Conversely, if the price breaks above $0.90, the pair could rise to the breakdown level at $1. This is an important level for the bears to defend because a break above it will indicate that the markets have rejected the lower levels. The pair could then challenge the resistance line of the descending channel.SOL/USDTSolana (SOL) recovered sharply from the intraday low on Feb. 24 and closed above the breakdown level at $81. The long tail on the day’s candlestick shows strong buying at lower levels.SOL/USDT daily chart. Source: TradingViewThe bulls will have to clear the overhead hurdle at the 50-day SMA ($110) to indicate that the selling pressure could be reducing. The SOL/USDT pair could thereafter rally to the overhead resistance at $122.A break and close above this level will complete a double bottom pattern, which has a pattern target at $163. Alternatively, if the price turns down from the current level, the bears will challenge the strong support at $81 and attempt to resume the downtrend. The selling pressure could increase on a break and close below $75.AVAX/USDTAvalanche (AVAX) attempted to rise above the moving averages on Feb. 23 but the long wick on the day’s candlestick indicates strong selling at higher levels. The bears pulled the price to $64 on Feb. 24 but the bulls bought this dip. This suggests that bears are selling on rallies while bulls are buying on dips.AVAX/USDT daily chart. Source: TradingViewBoth moving averages are sloping down and the RSI is just below the midpoint, indicating a minor advantage to bears. If the price remains below the moving averages, the AVAX/USDT pair could retest $64. A break and close below this level could open the doors for a possible fall to $51. Conversely, if bulls push the price above the moving averages, the pair could rise to the downtrend line of the channel. A break and close above this level will indicate a possible change in trend.Related: Bitcoin whales fuel BTC price comeback as stocks brush off Russia-Ukraine shocksLUNA/USDTTerra’s LUNA token formed an outside-day candlestick pattern on Feb. 24. Although the bears pulled the price back below the 20-day exponential moving average (EMA) ($56), they could not sustain the lower levels. LUNA/USDT daily chart. Source: TradingViewThe LUNA/USDT pair recovered sharply from the lows and closed above the 50-day SMA ($61). This indicates aggressive buying on dips. The 20-day EMA has started to turn up and the RSI is in the positive territory, indicating that bulls have the upper hand.There is a minor resistance at $70. If bulls clear this hurdle, the pair could rally to the overhead zone at $85 to $87. Conversely, if the price turns down from $70, the pair could drop to the moving averages. DOGE/USDTDogecoin (DOGE) rebounded off the strong support at $0.10 on Feb. 24 and closed above the breakdown level at $0.12. However, the bulls have not been able to sustain the buying momentum, indicating a lack of demand at higher levels.DOGE/USDT daily chart. Source: TradingViewThe bears will again try to pull the price below $0.12 and challenge the psychological support at $0.10. A break and close below this level will be a huge negative and the DOGE/USDT pair could decline to $0.06.Alternatively, if the price turns up from the current level, the buyers will attempt to push the pair above the moving averages. If they do that, the pair could rally to the stiff overhead resistance at $0.17. A break and close above this level will signal that the bears may be losing their grip.DOT/USDTPolkadot (DOT) plunged below the strong support at $15.80 on Feb. 24 but the bears could not sustain the lower levels, as seen from the long tail on the day’s candlestick. This indicates strong buying at lower levels.DOT/USDT daily chart. Source: TradingViewThe downsloping moving averages and the RSI in the negative territory indicate that bears have a slight edge. The bears are likely to mount a strong defense in the overhead zone between the 20-day EMA ($18.15) and the downtrend line.If the price turns down from this zone, the bears will make one more attempt to pull and sustain the DOT/USDT pair below the strong support at $15.80. If they succeed, the pair could drop to $13.35.This negative view will invalidate if the price rises and sustains above the 50-day SMA ($20.71). The pair could then rise to the overhead resistance at $23.19.The views and opinions expressed here are solely those of the author and do not necessarily reflect the views of Cointelegraph. Every investment and trading move involves risk. You should conduct your own research when making a decision.Market data is provided by HitBTC exchange.

Čítaj viac

Price analysis 2/23: BTC, ETH, BNB, XRP, ADA, SOL, AVAX, LUNA, DOGE, DOT

Bitcoin (BTC) and several altcoins have bounced off their immediate support levels after buyers attempted to arrest the current decline. Bloomberg Senior Commodity Strategist Mike McGlone highlighted in a recent Tweet that Bitcoin was trading roughly 20% below its 50-week moving average and such discounted levels have “often resulted in good price support.”The bearish price action of the past few days does not seem to have deterred the institutional traders from accumulating at lower levels. According to CoinShares’ Feb. 22 “Digital Asset Fund Flows Weekly” report, institutional investors pumped about $89 million into Bitcoin funds between Feb. 14 and Feb. 18, taking the total inflows in the current month to $178.3 million.Daily cryptocurrency market performance. Source: Coin360Crypto traders do not seem to be too scared by the current 50% correction. In a survey conducted by Deutsche Bank, only about 35% of the respondents said they would reduce their trading in an extremely bearish crypto market condition. A majority, more than 70%, said they planned to increase their crypto activity over the next six months.Could Bitcoin and altcoins sustain the relief rally or will bears pounce and stall the recovery? Let’s analyze the charts of the top-10 cryptocurrencies to find out.BTC/USDTBitcoin bounced from the first support at $36,250 and the bulls will now attempt to push the price above the overhead resistance zone between $39,600 and the 50-day simple moving average ($40,615).BTC/USDT daily chart. Source: TradingViewIf they manage to do that, the BTC/USDT pair could rise to $45,821 where the bears are likely to mount a stiff resistance.The long wick on today’s candlestick suggests that bears are attempting to flip $39,600 into resistance. The downsloping moving averages and the relative strength index in the negative territory suggest that bears have the upper hand.A break and close below $36,250 will signal the resumption of the down move. The pair could then decline to $34,000 and later retest the Jan. 24 low at $32,917.ETH/USDTEther (ETH) bounced off the psychological support at $2,500 on Feb. 22. The bulls have pushed the price above the breakdown level of $2,652, indicating strong buying at lower levels.ETH/USDT daily chart. Source: TradingViewThe buyers will now try to propel the price above the moving averages. If they succeed, the ETH/USDT pair could rally to the resistance line of the symmetrical triangle pattern. The bulls will have to push the price above the triangle to signal the start of a new uptrend.Alternatively, if the price turns down from the moving averages, the bears will try to pull the pair below the support line of the triangle. If they manage to do that, it will suggest that the symmetrical triangle has acted as a continuation pattern. The pair could then drop to $2,159 and later to $2,000.BNB/USDTBinance Coin (BNB) bounced off the strong support at $350 on Feb. 22 indicating that bulls have not given up and they continue to buy at lower levels. The bulls will now attempt to drive the price above the downtrend line of the descending channel.BNB/USDT daily chart. Source: TradingViewIf they manage to do that, the BNB/USDT pair could rise to the 50-day SMA ($416). This is an important level for the bears to defend because a break above it could signal a possible change in trend. The pair could thereafter rise to $445. Conversely, if the price turns down from the downtrend line, the bears will fancy their chances and make one more attempt to pull the pair below $350. If that happens, the pair could drop to the strong support zone at $330 to $320.XRP/USDTRipple (XRP) bounced off $0.66 on Feb. 2 and the bulls pushed the price above the 50-day SMA ($0.72). The buyers will now attempt to clear the overhead hurdle at $0.75.XRP/USDT daily chart. Source: TradingViewIf they manage to do that, the XRP/USDT pair could rise to the downtrend line. The bulls will have to push the pair above this line to indicate that bulls are back in the game. The pair could then rally to $0.91.Alternatively, if the price turns down from $0.75, it will suggest that bears have flipped the level into resistance. The bears will then attempt to pull the price below $0.66 and extend the decline to $0.60. ADA/USDT Cardano (ADA) has bounced off the strong support near $0.80, indicating that buyers are attempting to arrest the decline. The price could now reach the breakdown level at $1.ADA/USDT daily chart. Source: TradingViewIf buyers push and sustain the price above $1, it will suggest that the markets have rejected the lower levels. The bulls will then attempt to push the price to the resistance line of the descending channel. A break and close above the channel will signal a possible trend change.Contrary to this assumption, if the price turns down from $1, it will suggest that bears have flipped this level into resistance. The sellers will then try to pull the pair below $0.80 and resume the downtrend.SOL/USDTSolana (SOL) bounced off the $81 support on Feb. 22, indicating that buyers are attempting to defend this level. The RSI is showing signs of forming a positive divergence, indicating that the bearish momentum could be weakening. SOL/USDT daily chart. Source: TradingViewIf buyers drive and sustain the price above the 20-day EMA ($97), the SOL/USDT pair could rally to the resistance line of the descending channel. This level could act as a major barrier but if bulls overcome it, the pair could rally to $122. A break and close above this resistance will complete a double bottom pattern. This bullish setup has a target objective at $163. This positive view will invalidate if the price turns down from the 20-day EMA or the resistance line and plummets below $81. That could open the doors for a further decline to $66.AVAX/USDTAvalanche (AVAX) broke below the moving averages on Feb. 20 but the bears could not build upon this advantage. Strong buying near $67 has resulted in a rebound and the price has reached the moving averages.AVAX/USDT daily chart. Source: TradingViewIf buyers push and sustain the price above the moving averages, the AVAX/USDT pair could rally to the downtrend line. The bears are likely to defend this level aggressively. If the price turns down from the downtrend line but bounces off the moving averages, it will indicate that traders are buying on dips. That will improve the prospects of a break above the channel. If that happens, the pair could first rise to $100 and then rally toward $117.Conversely, if the price turns down from the current level, the bears will attempt to pull the pair below $67 and resume the downtrend.Related: Even in a choppy crypto market, this algorithmic indicator helped traders identify the few winnersLUNA/USDTTerra’s LUNA token broke and closed above the 20-day EMA ($54) on Feb. 22 which was the first indication that the sellers may be losing their grip. Sustained buying has pushed the price to the downtrend line of the descending channel.LUNA/USDT daily chart. Source: TradingViewThe 20-day EMA has flattened out and the RSI has jumped into the positive territory, suggesting a minor advantage to buyers. A break and close above the 50-day SMA ($62) will indicate a possible trend change. The LUNA/USDT pair could then rally to $70 where it may again face resistance from the bears.Contrary to this assumption, if the price turns down from the 50-day SMA, it will signal that bears are attempting to defend the overhead resistance. If the price rebounds off the 20-day EMA, it will indicate that bulls are buying the dips. That will increase the possibility of a break above the 50-day SMA. This positive view will be negated if bears pull the price below the 20-day EMA.DOGE/USDTDogecoin (DOGE) rebounded off the strong support at $0.12 on Feb. 12, suggesting that the bulls have not yet given up and are buying on dips.DOGE/USDT daily chart. Source: TradingViewThe relief rally is likely to face strong resistance at the moving averages but the positive divergence on the RSI favors the buyers. If the bulls push and sustain the price above the 50-day SMA ($0.14), the DOGE/USDT pair could rise to $0.17.A break and close above this level will complete a double bottom pattern, which has a target objective at $0.22. Conversely, if the price turns down from the moving averages, the bears will fancy their chances and try to sink the pair below $0.12. If they succeed, the pair could drop to $0.10.DOT/USDTPolkadot (DOT) has bounced off the support at $15.80, indicating that the bulls have not given up and they continue to buy at lower levels. The RSI is showing signs of forming a positive divergence, suggesting that the selling momentum could be weakening.DOT/USDT daily chart. Source: TradingViewThe DOT/USDT pair could now rise to the downtrend line, which is likely to act as a strong resistance. If the price turns down from this level, the bears will again attempt to pull the pair below $15.80 and resume the downtrend.Conversely, if bulls drive the price above the downtrend line and the 50-day SMA ($21.14), the pair could rise to the overhead resistance at $23.19. A break and close above this level will complete a double bottom pattern. The views and opinions expressed here are solely those of the author and do not necessarily reflect the views of Cointelegraph. Every investment and trading move involves risk. You should conduct your own research when making a decision.Market data is provided by HitBTC exchange.

Čítaj viac

Price analysis 2/21: BTC, ETH, BNB, XRP, ADA, SOL, AVAX, LUNA, DOGE, DOT

Bitcoin (BTC) dipped below $38,000 on Feb. 21 but the bulls are attempting to arrest the decline and start a recovery. The sustained weakness in 2022 seems to have toned down expectations of a strong rally.Huobi crypto exchange co-founder Du Jun said that if the Bitcoin halving cycle repeats, then the current weakness could be the start of a bear market. Jun believes that the next Bitcoin bull cycle is expected to begin either at the end of 2024 or at the beginning of 2025.Daily cryptocurrency market performance. Source: Coin360In the short term, crypto markets are likely to be influenced by the geopolitical developments between Russia and Ukraine, cues from the U.S. Federal Reserve on its tightening cycle and the performance of the assets perceived as risky.Could Bitcoin and select altcoins recover from the recent lows or will the selling pick up momentum? Let’s analyze the charts of the top-10 cryptocurrencies to find out.BTC/USDTBitcoin plunged and closed below the key support at $39,600 on Feb. 20. The selling resumed today and the bears pulled the price to $37,213.63. BTC/USDT daily chart. Source: TradingViewThe sharp selling in the past few days has pulled the relative strength index (RSI) into the negative territory and the 20-day exponential moving average ($40,986) has turned down. This indicates the path of least resistance is to the downside.The buyers are attempting to push the price back above the breakdown level at $39,600. This is an important level to watch out for because if bears flip this level into resistance, the selling could intensify and the BTC/USDT pair could drop to the $36,250 to $35,507.01 support zone.Conversely, if bulls push and sustain the price above $39,600 and the moving averages, it will indicate strong demand at lower levels. That could open the gates for a possible rally to $45,821.ETH/USDTEther (ETH) re-entered the descending channel on Feb. 18. This was the first indication that the recovery was faltering. The bulls tried to push the price back above the channel on Feb. 19 but the bears kept up the pressure.ETH/USDT daily chart. Source: TradingViewThe ETH/USDT pair broke and closed below the critical support at $2,652 on Feb. 20 but the sellers could not build upon this advantage. This indicates strong buying at lower levels. The price has rebounded sharply today and the buyers are trying to push the pair above the resistance line of the channel.If they succeed, the pair could challenge the moving averages. A break and close above the 50-day simple moving average ($2,971) could be the first sign of strength.Conversely, if the price turns down from the current level and plummets below $2,652, the pair may slide to $2,316 and then $2,159.BNB/USDTThe bulls tried to push Binance Coin (BNB) back above the downtrend line of the descending channel on Feb. 19 but the bears did not relent. BNB/USDT daily chart. Source: TradingViewThe selling renewed on Feb. 20 and the bears pulled the price below the strong support at $390.50. This could have triggered stops of traders who may have purchased the break and close above the channel. The long wick on today’s candlestick indicates that bears are trying to flip the $390.50 level into resistance.If bears pull the price below $357.40, the BNB/USDT pair could drop to the strong support zone at $330 to $320. The bulls will have to push and sustain the price above the 50-day SMA ($422) to indicate that the bears may be losing their grip.XRP/USDTRipple (XRP) bounced off the $0.75 support on Feb. 18 but the relief rally again faltered near the overhead resistance at $0.85 on Feb. 19. This indicates that bears are defending this level aggressively.XRP/USDT daily chart. Source: TradingViewRenewed selling on Feb. 20 has pulled the price to the strong support zone between the moving averages. If this support zone cracks, several stops may be hit and the XRP/USDT pair could slide to $0.65 and later to $0.60.Conversely, if the price rebounds off the support zone, the bulls will attempt to push the pair above the downtrend line and the overhead resistance at $0.85. If they manage to do that, the pair could rally to the psychological level at $1.ADA/USDT Cardano (ADA) broke and closed below the psychological level at $1 on Feb. 18. This suggests the resumption of the downtrend. The bulls pushed the price back above $1 on Feb. 19 but failed to sustain the higher levels.ADA/USDT daily chart. Source: TradingViewThe long wick on today’s candlestick indicates that bears continue to defend the $1 level and are trying to flip it into resistance. If the price sustains below $1, the selling could pick up and the ADA/USDT pair could decline to the next strong support at $0.80.Alternatively, if the price turns up from the current level and rises above the 50-day SMA ($1.15), it will indicate that markets have rejected the lower levels. That could act as a bear trap, resulting in a possible short squeeze. The pair could then rally to $1.60.SOL/USDTSolana (SOL) formed a long-legged Doji candlestick pattern on Feb. 20, indicating indecision among the bulls and bears. The bulls attempted to resolve the uncertainty to the upside today but the bears successfully defended the 20-day EMA ($100).SOL/USDT daily chart. Source: TradingViewBoth moving averages are sloping down and the RSI is trading below 38, indicating that bears have the upper hand. The sellers will now attempt to sink the SOL/USDT pair below the strong support at $80.83.If they succeed, the pair could resume its downtrend. The next support on the downside is at $66. This bearish view will invalidate in the short term if the price breaks and sustains above the 20-day EMA. The bulls will then try to push the pair above the resistance line of the channel and signal a possible trend change. AVAX/USDTAvalanche (AVAX) plummeted below the moving averages and the uptrend line on Feb. 20, suggesting that the higher levels continue to attract selling by the bears.AVAX/USDT daily chart. Source: TradingViewThe bulls tried to push the price back above the uptrend line today but the long wick on the candlestick suggests that bears are defending the breakdown level. If the price breaks and sustains below $74.70, the AVAX/USDT pair could further slip to $65. The RSI has dipped into the negative zone and the 20-day EMA ($82) has started to turn down, indicating that bears have the upper hand. This negative view will invalidate if the price rebounds off the current level and breaks above the downtrend line. That could result in a rally to the psychological level at $100.Related: Solana’s weekend bounce risks turning into a bull trap — Can SOL price fall to $60 next?LUNA/USDTThe long tail on the Feb. 20 candlestick indicates that buyers are defending the immediate support at $46.50. Terra’s LUNA token could now rise to the 20-day EMA ($54) where the bears are expected to mount a strong defense.LUNA/USDT daily chart. Source: TradingViewIf the price once again turns down from the 20-day EMA, the prospects of a break below the strong support zone at $46.50 to $43.44 increase. That could sink the LUNA/USDT pair to the critical support at $37.50.Conversely, if bulls push and sustain the price above the 20-day EMA, the pair could rise to the downtrend line of the descending channel. The bulls will have to push and sustain the pair above the 50-day SMA ($63) to indicate a possible change in trend.DOGE/USDTDogecoin (DOGE) attempted to rise above the 20-day EMA ($0.14) on Feb. 19 but the long wick on the candlestick suggests that bears are defending this resistance.DOGE/USDT daily chart. Source: TradingViewBoth moving averages are sloping down and the RSI is in the negative zone, indicating that bears have the upper hand. The longer the price sustains below the moving averages, the greater the likelihood of a drop to the strong support at $0.12. The bulls are expected to defend this level aggressively because a break below it could result in a decline to the psychological support at $0.10. This negative view will invalidate in the short term if the price turns up and rises above the 50-day SMA ($0.15). That could push the DOGE/USDT pair to $0.17.DOT/USDTPolkadot’s (DOT) failure to rebound off the strong support at $16.81 indicates a lack of demand at higher levels. This increases the possibility of a further slide.DOT/USDT daily chart. Source: TradingViewIf bears pull and sustain the price below $16.81, the selling could accelerate and the DOT/USDT pair could drop to $13 and later retest the critical support at $10.37. The downsloping moving averages and the RSI below 37 indicate the path of least resistance is to the downside.The first sign of strength will be a break and close above the downtrend line. Such a move could open the doors for a possible up-move to the 50-day SMA ($21.67) and later to $23.19.The views and opinions expressed here are solely those of the author and do not necessarily reflect the views of Cointelegraph. Every investment and trading move involves risk. You should conduct your own research when making a decision.Market data is provided by HitBTC exchange.

Čítaj viac

Top 5 cryptocurrencies to watch this week: BTC, LEO, MANA, KLAY, XTZ

Russia’s massive build-up of soldiers, warplanes, equipment and extended military drills near Ukraine’s borders increased fears of a possible invasion within the next few days. That could have renewed selling in Bitcoin (BTC), which plummeted below the strong support at $39,600.Among the gloom and doom, there is a ray of hope for crypto investors because data from Glassnode shows that more than 60% of Bitcoin supply has not been used in any transaction for more than a year. This suggests that long-term hodlers are not dumping their positions in the downtrend. Crypto market data daily view. Source: Coin360Mike McGlone, chief commodity strategist at Bloomberg Intelligence, warned that Bitcoin could be in for a “rough week ahead” and cautioned that “inflation is unlikely to drop unless risk assets do.” However, McGlone expects Bitcoin to emerge stronger this year.Could Bitcoin and altcoins stage a recovery and trap the aggressive bears? Let’s study the charts of the top-5 cryptocurrencies that may participate in a relief rally.BTC/USDTThe failure of the buyers to defend the strong support at $39,600 indicates that Bitcoin continues to face strong selling by the bears. The 20-day exponential moving average ($41,193) has started to turn down and the relative strength index (RSI) has slipped into the negative territory, suggesting that bears have the upper hand.BTC/USDT daily chart. Source: TradingViewIf the price sustains below $39,600, the selling could pick up momentum and the BTC/USDT pair could drop to the immediate support zone between $36,250 and $35,507.01. The bulls are expected to defend this zone aggressively because a break below it could clear the path for a retest of the Jan. 24 intraday low at $32,917.17. The longer the price sustains below $39,600, the greater the possibility of the downward move.Contrary to this assumption, if the price rebounds off the current level and quickly rises above $39,600, it will suggest strong accumulation at lower levels. The bulls will then try to push the price above the 20-day EMA. The bulls will have to clear the overhead hurdle at $45,821 to indicate the start of a new up-move.BTC/USDT 4-hour chart. Source: TradingViewThe failure of the bulls to achieve a strong rebound off the $39,600 support indicates a lack of demand at higher levels. This may have emboldened the bears who pulled the price below $39,600. The RSI has dipped deep into the oversold territory, indicating that the selling may have been overdone in the short term. This suggests a minor relief rally or consolidation in the near term.If bears successfully defend the retest of the breakdown level during the next bounce, the selling may intensify and the pair could plummet to $36,000. This negative view will invalidate in the short term if bulls drive the pair above $41,000.LEO/USDUNUS SED LEO (LEO) has been correcting since making a new all-time high at $8.14 on Feb. 8. The bears pulled the price below the 50% Fibonacci retracement level at $5.74 but the bulls are aggressively defending the 20-day EMA ($5.45).LEO/USD daily chart. Source: TradingViewThe rising 20-day EMA and the RSI in the positive territory indicate that bulls have a slight edge. If buyers drive the price above $6.24, the LEO/USD pair could attempt to resume the up-move. The pair could then rise to $7.Conversely, if bulls fail to sustain the current rebound, the bears will sense an opportunity and try to pull the pair below the 20-day EMA. If they manage to do that, the sentiment could turn bearish and the pair may slide to the 61.8% retracement level at $5.18.LEO/USD 4-hour chart. Source: TradingViewThe 4-hour chart shows that the pair is range-bound between $5.52 and $6.24. The 20-EMA and 50-simple moving average have flattened out and the RSI is near the midpoint, indicating a balance between supply and demand.This balance will shift in favor of the bears if they pull and sustain the price below $5.52. The pair could then drop toward the 200-SMA.Conversely, if buyers push and sustain the price above the 50-SMA, the pair could rally to $6.24. The bulls will have to clear this hurdle to signal that they are back in the driver’s seat.MANA/USDTDecentraland (MANA) turned down from the downtrend line on Feb. 16, indicating that the sentiment remains bearish and traders are selling on rallies to stiff resistance levels.MANA/USDT daily chart. Source: TradingViewThe bears have pulled the price below the 50-day SMA ($2.83), which opens the door for a possible downside to the strong support zone between $2.44 and the 200-day SMA ($2.20). If the price rebounds off this zone, the bulls will again attempt to push the MANA/USDT pair to the downtrend line. The bulls will have to clear this hurdle to indicate the start of a new up-move.Conversely, if bears sink and sustain the price below the 200-day SMA, the selling could intensify and the pair could slide further to $1.70.MANA/USDT 4-hour chart. Source: TradingViewThe bears have pulled the price below the 200-SMA. If the price sustains below this level, the pair could drop to the support line of the descending channel. A break and close below the channel could sink the pair to $2.44.If the price turns up from the current level, the bulls will try to push the pair above the 200-SMA. Such a move will be the first sign that bulls are attempting a comeback. A break and close above the 20-EMA will increase the possibility of a rally to the resistance line of the channel.Related: Can Bitcoin break out vs. tech stocks again? Nasdaq decoupling paints $100K targetKLAY/USDTKlaytn’s native cryptocurrency KLAY turned down from the downtrend line on Feb. 16, indicating that bears continue to sell on rallies. KLAY/USDT daily chart. Source: TradingViewHowever, a minor positive is that bulls have not allowed the price to break below the 20-day EMA ($1.23). This indicates that traders are buying on dips to this support. If the price rises and sustains above the 50-day SMA ($1.27), the bulls will again try to clear the overhead hurdle at the downtrend line. If they manage to do that, it will indicate a possible change in trend. The KLAY/USDT pair could then rally to $1.50.Alternatively, a break and close below the 20-day EMA will indicate that bears have overpowered the buyers. That could pull the price down to $1.10.KLAY/USDT 4-hour chart. Source: TradingViewThe 4-hour chart shows that the bears are aggressively defending the overhead resistance at $1.36. The pair turned down from this resistance but the bulls have not allowed the price to break and sustain below the 50-SMA.If the price turns up from the current level, the buyers will attempt to clear the immediate resistance at $1.31 and challenge the hurdle at $1.36. A break and close above this level could open the doors for a possible rally to $1.50. This positive view will be negated on a break and close below the 200-SMA. That could pull the pair down to $1.15.XTZ/USDTTezos (XTZ) turned down from the downtrend line on Feb. 10, indicating that bears continue to sell on rallies. The bears will now attempt to pull the price to the uptrend line.XTZ/USDT daily chart. Source: TradingViewThe uptrend line has been acting as a strong support since March 2020. Hence, the bulls are likely to defend the uptrend line aggressively. If the price rebounds off this support, the buyers will try to push the XTZ/USDT pair above the downtrend line.If they succeed, the pair could signal a possible change in trend. This positive view could invalidate if the price breaks and sustains below the uptrend line. Such a move could open the doors for further downside. XTZ/USDT 4-hour chart. Source: TradingViewThe 4-hour chart shows the pair is in a firm bear grip. The price has dropped to the 61.8% Fibonacci retracement level at $3.32, which is an important level for the bulls to defend. A break and close below this support will increase the possibility of a drop to the 78.6% Fibonacci retracement level at $2.98 and later to the uptrend line.The first sign of strength will be a break and close above the 20-EMA. Such a move will indicate that the selling pressure could be reducing. A possible short-term trend change will be signaled on a break and close above the 50-SMA.The views and opinions expressed here are solely those of the author and do not necessarily reflect the views of Cointelegraph. Every investment and trading move involves risk, you should conduct your own research when making a decision.

Čítaj viac

Získaj BONUS 8 € v Bitcoinoch

nakup bitcoin z karty

Registrácia Binance

Burza Binance

Aktuálne kurzy