Autor Cointelegraph By Rakesh Upadhyay

Price analysis 3/16: BTC, ETH, BNB, XRP, LUNA, SOL, ADA, AVAX, DOT, DOGE

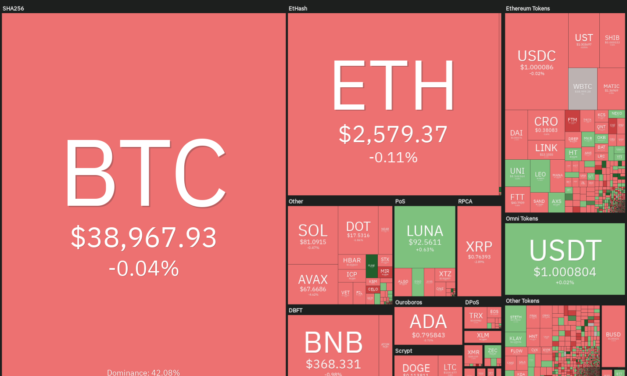
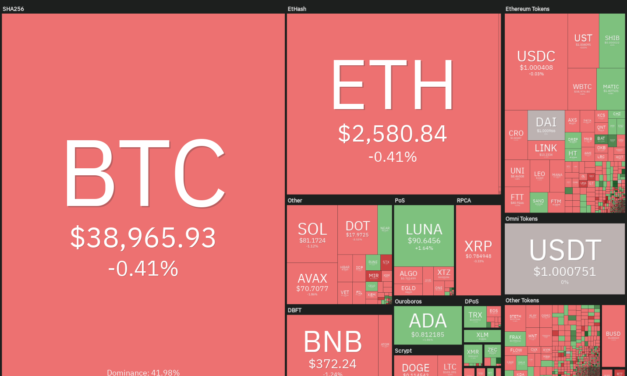
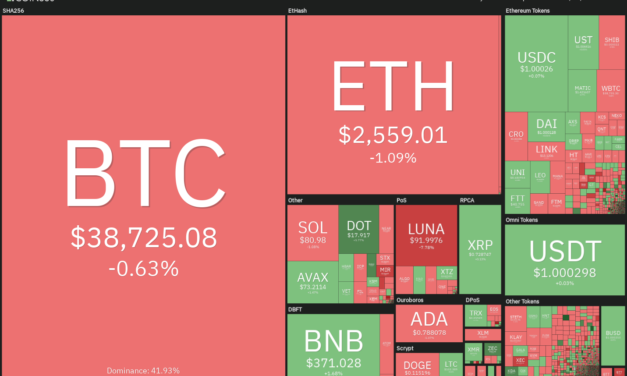
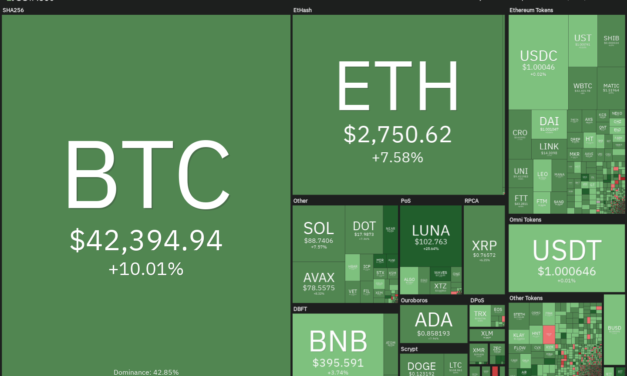
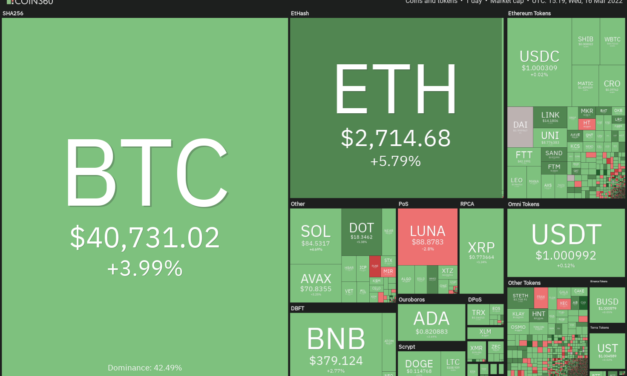
Bitcoin (BTC) is witnessing a see-saw battle near $40,000 with both the bulls and the bears trying to gain the upper hand. The volatility could remain high as the markets await the United States Federal Reserve’s policy decision due on March 16.Analyst Willy Woo suggests that Bitcoin could witness a capitulation event based on cost basis, a metric that indicates the transfer of Bitcoin from inexperienced to experienced traders. Such sharp declines usually suggest the formation of market bottoms.Daily cryptocurrency market performance. Source: Coin360However, Glassnode believes that a capitulation has been avoided because the sell-offs have been absorbed by a relatively strong market. Although 82% of the short-term holders’ coins are in loss, Glassnode considers this to be a late-stage bear market behavior where investors hold their coins until they turn profitable. Could the Fed’s policy decision start a trending move in Bitcoin and altcoins? Let’s analyze the charts of the top-10 cryptocurrencies to find out.BTC/USDTBitcoin turned down from the moving averages on March 15 but the long tail on the candlestick indicates strong demand at lower levels. The bulls continued their buying and have pushed the price above the 50-day simple moving average ($40,151).BTC/USDT daily chart. Source: TradingViewIf bulls sustain the price above the 50-day SMA, the BTC/USDT pair could rally to the overhead zone between $45,400 and the resistance line of the ascending channel. The bears are expected to mount a strong defense in this zone.If the price turns down from the overhead zone, the pair could extend its stay inside the channel for a few more days. The flat moving averages and the relative strength index (RSI) near the midpoint also suggest range-bound action is likely in the short term.Contrary to this assumption, if the price turns down and plummets below the moving averages, it will suggest that bears continue to sell at higher levels. The bears will then try to sink the price below the support line of the channel and resume the downtrend.ETH/USDTEther (ETH) bounced off the support line of the symmetrical triangle and the buyers are attempting to push the price above the 50-day SMA ($2,763). ETH/USDT daily chart. Source: TradingViewIf they succeed, the price could rise to the psychological level at $3,000 and then to the resistance line of the triangle. The bulls will have to push and sustain the price above the triangle to signal a possible change in trend.The RSI has also formed a symmetrical triangle and a breakout from it could signal that buyers have the upper hand.This bullish view will invalidate if the price turns down from the current level and breaks below the support line of the triangle. That could open the doors for a possible drop to $2,159.BNB/USDTThe buyers are trying to push Binance Coin (BNB) above the moving averages but the bears are likely to have other plans. They will attempt to stall the recovery near the moving averages as they have done on the three previous occasions.BNB/USDT daily chart. Source: TradingViewBoth the moving averages are flattening out and the RSI has risen above 48, indicating that bulls are attempting a comeback. If buyers drive and sustain the price above the 50-day SMA ($388), the BNB/USDT pair could rise to $425 and thereafter to $445.Contrary to this assumption, if the price turns down from the moving averages, it will suggest that the sentiment remains negative and traders are selling near resistance levels. The bears will then try to pull the price below the strong support at $350.XRP/USDTXRP turned down from the downtrend line on March 12 and dropped to the moving averages. Although the bulls have defended the moving averages, they have failed to achieve a strong rebound off it.XRP/USDT daily chart. Source: TradingViewBoth moving averages have flattened out and the RSI is near the midpoint, indicating a balance between supply and demand. The buyers will have to push and sustain the price above the downtrend line to gain the upper hand. The XRP/USDT pair could then rally to $0.91 and later to the psychological level at $1.Conversely, if the price turns down and breaks below $0.69, the advantage will turn in favor of the bears. The pair could then slide to the strong support level at $0.62.LUNA/USDTTerra’s LUNA token broke above the overhead resistance at $94 on March 14 but the bulls could not sustain the higher levels. The bears pulled the price back below $94 on March 15.LUNA/USDT daily chart. Source: TradingViewThe bears will now try to pull and sustain the price below the 20-day exponential moving average ($84). If they succeed, the LUNA/USDT pair could drop to $70. Such a move could suggest that the bullish momentum has weakened.Contrary to this assumption, if the price rises from the current level or rebounds off the 20-day EMA, the buyers will again attempt to push the price toward $105. A break and close above this resistance could indicate the resumption of the uptrend. The pair could first rally to $115 and later to $125.SOL/USDTThe bulls pushed Solana (SOL) back above the breakdown level at $81 on March 14, indicating that the recent breakdown on March 13 may have been a bear trap.SOL/USDT daily chart. Source: TradingViewThe buyers are attempting to push the price above the 20-day EMA ($86). If they manage to do that, the SOL/USDT pair could rally to the downtrend line. This is an important level to keep an eye on because a break and close above it will suggest a possible change in trend. The pair could then rally to the overhead resistance at $122.This positive view will be invalidated in the short term if the price turns down from the 20-day EMA or the downtrend line and plummets below $77. Such a move could indicate the resumption of the downtrend and the pair may extend its decline to $66.ADA/USDT Cardano (ADA) is attempting to rise above the 20-day EMA ($0.85) but the bears are expected to mount a strong defense at the resistance.ADA/USDT daily chart. Source: TradingViewIf the price turns down from the current level, the ADA/USDT pair could drop to the strong support at $0.74. This is an important level for the bulls to defend because if it cracks, the pair could decline to the next support at $0.68.Alternatively, if the price breaks and closes above the 20-day EMA, the pair could attempt a rally to the psychological level at $1. This level is likely to act as a strong resistance. If the price turns down from this resistance, the pair may remain range-bound between $1 and $0.74 for a few days.Related: BTC price cracks $41K as hopes of peace in Eastern Europe send Bitcoin higherAVAX/USDTAvalanche (AVAX) has been sustaining below the uptrend line since March 13 but the bears have not been able to capitalize on this weakness and sink the price below the immediate support at $64. This indicates a lack of sellers at lower levels.AVAX/USDT daily chart. Source: TradingViewThe bulls are attempting to push the price back above the uptrend line and the moving averages. If they succeed, the AVAX/USDT pair could rise to the downtrend line of the descending channel. This is an important level to watch out for because the bears have successfully defended the resistance on four previous occasions.If the price once again turns down from the downtrend line, it will suggest that the bears are in no mood to relent. The sellers will then try and pull the price back below $64.Conversely, if bulls drive the price above the channel, it will suggest that the downtrend could be over. The pair could then rally to the psychological level at $100.DOT/USDTPolkadot (DOT) has been trading close to the 20-day EMA ($17) for the past two days, indicating that the bulls are buying the dips.DOT/USDT daily chart. Source: TradingViewThe flattish moving averages and the RSI near the midpoint suggest that the bears may be losing their grip. The bulls are again expected to attempt a rally above the overhead resistance at $19. If they can pull it off, the DOT/USDT pair could rise to $23 where the bears may pose a strong challenge. A break and close above this level would complete a double bottom pattern.This positive view will invalidate if the price turns down and breaks below the strong support at $16. That could drag the price down to $14.DOGE/USDTDogecoin (DOGE) turned down from the 20-day EMA ($0.12) on March 14, indicating that higher levels are witnessing strong selling by the bears. DOGE/USDT daily chart. Source: TradingViewOne minor positive factor is that the bulls have not allowed the price to break below the strong support at $0.10. This could keep the DOGE/USDT pair range-bound between $0.12 and $0.10 for a few more days.A break and close above the 20-day EMA could be the first sign that the selling pressure may be reducing. The bulls will then try to push the pair above the 50-day SMA ($0.13) and clear the path for a possible rally to $0.17.Alternatively, if the price breaks below $0.10, the selling could intensify and the pair may drop to $0.06.The views and opinions expressed here are solely those of the author and do not necessarily reflect the views of Cointelegraph. Every investment and trading move involves risk. You should conduct your own research when making a decision.Market data is provided by HitBTC exchange.

Čítaj viac

Price analysis 3/14: BTC, ETH, BNB, XRP, LUNA, SOL, ADA, AVAX, DOT, DOGE

Bitcoin (BTC) has largely been directionless since the start of the year as the bulls have been buying on dips while bears are selling the rallies. This suggests that the price is consolidating in a large range with both the bulls and the bears waiting for the next trigger to establish their supremacy. The short-term volatility may pick up after the United States Federal Reserve announces its policy decision on March 16 but unless the Fed springs a surprise, the likelihood of a new trending move could be low. Bitcoin could spend some more time in a bottoming formation before breaking out of it. Daily cryptocurrency market performance. Source: Coin360A positive sign in the range-bound action this year has been evidence of accumulation by both the small investors and select whales. This has coincided with a sustained drop in Bitcoin balances on exchanges. The combined Bitcoin balances on the 21 exchanges it covers have dropped to 2.32 million Bitcoin, the lowest since August 2018, according to CryptoQuant.Could Bitcoin break above the immediate resistance level and pull the altcoins higher? Let’s analyze the charts of the top-10 cryptocurrencies to find out.BTC/USDTBitcoin has bounced from the immediate support at $37,000 indicating that bulls are attempting to defend this level. The buyers will now try to push the price above the moving averages. If they succeed, it will suggest strong demand at lower levels.BTC/USDT daily chart. Source: TradingViewThe bulls will then try to extend the up-move by clearing the overhead hurdle at $42,594. If they manage to do that, it will be the first indication that the bears may be losing their grip. The BTC/USDT pair could then rise to the overhead zone between $45,400 and the resistance line of the ascending channel.Conversely, if the price turns down from the moving averages, it will suggest that bears are unwilling to let go of their advantage. The sellers will then attempt to solidify their position by pulling the price below the support line of the channel. Such a move could signal the resumption of the downtrend.ETH/USDTThe bulls are attempting to defend the support line of the symmetrical triangle. A strong bounce off the current level could push Ether (ETH) to the moving averages where the bears are again likely to mount a strong defense.ETH/USDT daily chart. Source: TradingViewIf the price turns down from the moving averages, it will suggest that the sentiment remains negative and traders are selling on relief rallies. That will increase the possibility of a break below the triangle. The ETH/USDT pair could then resume its downtrend and decline to $2,159.Contrary to this assumption, if bulls propel the price above the moving averages, it will suggest that the selling pressure may be reducing. The pair could then rise to the psychological level at $3,000 and later challenge the resistance line of the triangle.BNB/USDTBinance Coin (BNB) is attempting to rebound off the support zone between $360 to $350. This suggests that buyers continue to accumulate on dips near the support zone. BNB/USDT daily chart. Source: TradingViewThe buyers will have to push and sustain the price above the moving averages to indicate that the bears may be losing their grip. If the price sustains above the 50-day simple moving average ($389), the bulls will attempt to push the BNB/USDT pair to $425.This positive view will invalidate if the price once again turns down from the moving averages and breaks below $350. Such a move will suggest that the sentiment remains negative and traders continue to sell on rallies. That could pull the price to the critical support at $320.XRP/USDTXRP price soared above the downtrend line on March 11 but the rally met with stiff resistance at $0.85. This suggests that the bears have not yet given up and they continue to sell on rallies.XRP/USDT daily chart. Source: TradingViewThe price has pulled back to the 20-day exponential moving average ($0.75) which is likely to act as a strong support. If the price rebounds off the current level, the buyers will make one more attempt to push and sustain the XRP/USDT pair above $0.85. If they succeed, the pair could rally to $0.91 and then rise to the psychological resistance at $1.This positive view will invalidate if the price breaks below the moving averages. Such a move will suggest that the break above the downtrend line may have been a bull trap. A break and close below $0.69 could open the doors for a possible drop to $0.62. LUNA/USDTTerra’s LUNA token slipped below $94 on March 11 but the bears could not pull the price to the 20-day EMA ($82). This is a positive sign as it shows that traders are buying on every minor dip.LUNA/USDT daily chart. Source: TradingViewAlthough the rising 20-day EMA indicates advantage to buyers, the negative divergence on the relative strength index (RSI) suggests that the bullish momentum may be weakening. The bulls are attempting to push the price back above $94. If that happens, the buyers will make one more attempt to clear the overhead hurdle at $105 and resume the uptrend. If they do that, the LUNA/USDT pair could rally to $115.Conversely, if the price turns down from the overhead zone, the bears will try to sink the pair below the 20-day EMA. SOL/USDTSolana (SOL) broke and closed below the strong support at $81 on March 11 and followed it up with further selling on March 13. However, the bears have not been able to break the intraday low at $75 made on Feb. 24.SOL/USDT daily chart. Source: TradingViewThe positive divergence on the RSI indicates that the selling pressure may be reducing. The bulls are attempting to push the price back above the breakdown level at $81 today. If they sustain the price above $81, it will suggest that the recent breakdown may have been a bear trap. The buyers will then strive to push the SOL/USDT pair above the 20-day EMA ($87). This positive view will invalidate if the price turns down from the current level and breaks below $75. That will suggest the bears have flipped the $81 level into resistance. The pair could then drop to $66.ADA/USDT Cardano (ADA) is attempting a rebound off the strong support at $0.74 but the effort lacks conviction. A minor positive is that the RSI is showing the first signs of positive divergence, indicating that the selling pressure may be reducing.ADA/USDT daily chart. Source: TradingViewThe bulls will have to push and sustain the ADA/USDT pair above the 20-day EMA ($0.85) to signal that the bears may be losing their grip. That could open the doors for a possible retest of the breakdown level at $1. This level is likely to attract strong selling.Contrary to this assumption, if the price turns down from the current level or the 20-day EMA, it will indicate that bears are pouncing on every minor rally. That will increase the possibility of a break below $0.74. If that happens, the downtrend could extend to $0.68.Related: Bitcoin tracks $39K ahead of Europe vote on Proof-of-Work legalityAVAX/USDTAvalanche (AVAX) broke below the uptrend line on March 13 indicating that the bears have overpowered the bulls. The attempts by the buyers to push the price above the breakdown level today met with strong selling by the bears.AVAX/USDT daily chart. Source: TradingViewIf bears sink and sustain the price below $64, the AVAX/USDT pair could slide to the strong support at $51. The downsloping 20-day EMA ($74) and the RSI in the negative territory indicate advantage to sellers.This bearish view will invalidate in the short term if the price turns up from the current level and breaks above the moving averages. The bulls will then try to overcome the barrier at the downtrend line of the descending channel. This is an important level to keep an eye on because the bulls have faltered at the downtrend line on four previous occasions. If bulls push and sustain the price above the channel, the pair could rally to $100.DOT/USDTPolkadot (DOT) once again turned down from the 50-day SMA ($18) on March 13 but the bulls are not allowing the price to sustain below the 20-day EMA ($17).DOT/USDT daily chart. Source: TradingViewThe price has been stuck in a tight range between $16 and $19 for the past few days indicating indecision among the bulls and the bears. Such tight-range trading is usually followed by a sharp trending move. If buyers push and sustain the price above $19, the DOT/USDT pair could rally to the next overhead resistance at $23. A break and close above this level will signal that the downtrend may be over.Alternatively, if the price turns down and breaks below $16, the pair could retest the critical support at $14.DOGE/USDTDogecoin (DOGE) made a strong attempt to start a relief rally today but the efforts of the bulls met with stiff resistance at the 20-day EMA ($0.12).DOGE/USDT daily chart. Source: TradingViewIf the bulls fail to clear the overhead hurdle, the bears will fancy their chances and try to sink the pair below the psychological support at $0.10. If that happens, the selling could further pick up momentum and the DOGE/USDT pair may slide to $0.06.Contrary to this assumption, if the price rises from the current level or rebounds off $0.10, it will suggest accumulation by the bulls. The buyers will have to push and sustain the price above the 50-day SMA ($0.13) to signal a possible change in trend.The views and opinions expressed here are solely those of the author and do not necessarily reflect the views of Cointelegraph. Every investment and trading move involves risk. You should conduct your own research when making a decision.Market data is provided by HitBTC exchange.

Čítaj viac

Top 5 cryptocurrencies to watch this week: BTC, DOT, SAND, RUNE, ZEC

Bitcoin (BTC) has been relatively calm during the weekend, indicating that traders are playing it safe and not waging large bets before the upcoming Federal Open Market Committee meeting on March 15 and March 16. The quantum of the rate hike could act as the next trigger for the crypto markets.The current neutral setup of Bitcoin has kept the analysts guessing. Analytics resource Material Indicators warned that Bitcoin could plunge but they advised investors to be ready to buy the dip as they believe that the “bounce can change your life.”Crypto market data daily view. Source: Coin360A Price Waterhouse Coopers’ Sports Outlook 2022 report for North America highlighted three use cases for nonfungible tokens, which could shape the future of sports. The consultancy believes that NFTs and digital assets are among the ten major trends in the sports industry.Could the crypto markets start a directional move in the near term? Let’s study the charts of the top-5 cryptocurrencies that may participate in a rally if the bullish sentiment picks up.BTC/USDTBitcoin formed a Doji candlestick pattern on March 12 and on Sunday, indicating indecision among the bulls and bears. The price is stuck between the 20-day exponential moving average ($39,810) and the horizontal support at $37,000.BTC/USDT daily chart. Source: TradingViewThe 20-day EMA is flattish and the relative strength index (RSI) is just below the midpoint, indicating a balance between supply and demand.If the price rises and breaks above the 50-day simple moving average ($39,978) the bulls will attempt to push the BTC/USDT pair above $42,600. If they succeed, the pair could rally to $45,400 and later to the resistance line of the channel.Conversely, if the price turns down and breaks below $37,000, the bears will smell an opportunity. The sellers will then try to pull and sustain the pair below the support line of the channel. Such a move could clear the path for a possible drop to $30,000.BTC/USDT 4-hour chart. Source: TradingViewThe pair is forming a descending triangle pattern which will complete on a break and close below the strong support at $37,000. The pair could then drop to $34,322 and later start its journey toward the pattern target at $29,250.Alternatively, if bulls push and sustain the price above the 50-SMA, the pair could rise to the downtrend line. A break and close above this level will invalidate the bearish pattern. That could attract buying and the pair may then rally toward $45,400.DOT/USDTPolkadot (DOT) has been in a downtrend for the past several months but the bulls are trying to form a bottom in the zone between $16 and $14. The price rose above the 20-day EMA ($17) but the bulls have not been able to overcome the barrier at the 50-day SMA ($18).DOT/USDT daily chart. Source: TradingViewHowever, a positive sign is that the bulls have not given up much ground from the 50-day SMA. This suggests that the traders may be holding on to their position anticipating a break above the resistance. If that happens, the DOT/USDT pair could rally to the overhead resistance at $23 where the bears may again pose a stiff challenge.The flattish 20-day EMA and the RSI near the midpoint suggest a range-bound action in the short term. If the price turns down from the 50-day SMA, the bears will try to pull the pair below $16. If they succeed, the pair could retest the critical support at $14.DOT/USDT 4-hour chart. Source: TradingViewThe 4-hour chart shows that the pair is oscillating between $16 and $19. The failure of the buyers to propel the price above the overhead resistance may have attracted profit-booking from short-term traders. That pulled the price to the 50-SMA.If the price rises above the 200-SMA, it will suggest that bulls continue to buy on dips. The buyers will then again try to drive the price above the overhead resistance at $19. If they manage to do that, the pair could rise to $20 and later make a dash toward $23.Conversely, a break and close below the 50-SMA may increase the possibility of a drop to the strong support at $16.SAND/USDTThe Sandbox (SAND) has been range-bound between $2.55 and $4.86 for the past several weeks. The bears pulled the price below the 200-day SMA ($3.15) on March 4 but haven’t been able to break the support at $2.55.SAND/USDT daily chart. Source: TradingViewThis indicates accumulation near the support of the range. The RSI is showing signs of a positive divergence, indicating that the bearish momentum may be weakening.If the price rises from the current level, the bulls will try to push the SAND/USDT pair above the 200-day SMA. If that happens, the pair could rise to the 50-day SMA ($3.51). A break and close above this resistance could open the doors for a possible rally to $4.50 and then to $4.86.This bullish view will invalidate in the short term if the price turns down and slides below $2.55. That could suggest the resumption of the downtrend.SAND/USDT 4-hour chart. Source: TradingViewThe 50-SMA has been acting as a stiff resistance on the 4-hour chart. If bears sink the price below $2.70, the pair could drop to the solid support at $2.55. A break and close below this level could indicate advantage to bears.To negate this view, the bulls will have to push the price above the zone between the 50-SMA and $3. If that happens, the pair could rally to $3.42 where the bears may again mount a strong defense.Related: Cryptocurrencies against the ‘silent thief.’ Can Bitcoin protect capital from inflation?RUNE/USDTTHORChain (RUNE) broke above the moving averages on March 1 and successfully defended the level during the retest on March 8. This suggests that the sentiment has changed from sell on rallies to buy on dips.RUNE/USDT daily chart. Source: TradingViewThe bulls will now try to push the price to the 200-day SMA ($7.90) where the bears may again pose a strong challenge. If the price does not give up much ground from the 200-day SMA, the bulls will make one more attempt to clear this hurdle. If they succeed, the RUNE/USDT pair could rise to $9.Alternatively, if the price turns down from the current level, the 20-day EMA is the important level to watch out for. A strong rebound off this level will suggest that the bullish sentiment remains intact while a break below it could result in a decline to $4.RUNE/USDT 4-hour chart. Source: TradingViewThe 20-EMA on the 4-hour chart is sloping up and the RSI is in the positive zone, indicating that the bulls have the upper hand. The pair could now rise to the overhead resistance at $7 where the bears will try to stall the up-move.Alternatively, if the price turns down from the current level, the pair could drop to the 20-EMA. If the price rebounds off this level, the bulls will attempt to resume the uptrend. The bears will have to pull and sustain the price below the 20-EMA to indicate a change in the short-term trend.ZEC/USDTZcash (ZEC) broke and closed above the $135 resistance on March 8, which completed a double bottom pattern. This was followed by a break above the 200-day SMA ($145) on March 10, signaling that bulls are back in the game.ZEC/USDT daily chart. Source: TradingViewThe bears are currently attempting to pull the price back below the 200-day SMA and challenge the breakout level at $135. This is an important level for the bulls to defend because a break below it could suggest that the recent breakout may have been a bear trap. The ZEC/USDT pair could then drop to the 50-day SMA ($114).If the price rebounds off the current level or $135, it will suggest that the sentiment remains positive and traders are buying on dips. The bulls will then try to drive the pair above $160 and resume the up-move. The target objective of the breakout from the double bottom pattern is $189.ZEC/USDT 4-hour chart. Source: TradingViewThe bears pulled the price below the 20-EMA on the 4-hour chart but they have not been able to sustain the lower levels. This suggests that bulls continue to buy on every minor dip. The bulls will now try to push the price above $160 and resume the uptrend. The rising 20-EMA and the RSI in the positive territory indicate that the path of least resistance is to the upside.Contrary to this assumption, if the price turns down from the overhead resistance and slips below $143, the selling could pick up momentum. The pair could then drop to the critical support at $135.The views and opinions expressed here are solely those of the author and do not necessarily reflect the views of Cointelegraph. Every investment and trading move involves risk, you should conduct your own research when making a decision.

Čítaj viac

Price analysis 3/11: BTC, ETH, BNB, XRP, LUNA, SOL, ADA, AVAX, DOT, DOGE

Bitcoin (BTC) has been volatile in the past few days but the long-term investors seem to be using the current weakness to buy. According to Whale Alert and CryptoQuant, about 30,000 BTC left Coinbase and was deposited in an unknown wallet. It is speculated to be a genuine purchase and not an in-house transaction.Although investors may be bullish for the long term, the short-term picture remains questionable. Stack Funds said in their recent weekly research report that they “expect sideways trading and possibly a potential dip” in the short term due to the increase in inflation and the lack of clarity regarding the conflict in Ukraine.Daily cryptocurrency market performance. Source: Coin360While Bitcoin has been volatile, gold-backed crypto assets have made a strong showing in 2022 as investors shunned risky assets and sought the protection of safe havens. This has boosted the market capitalization of gold-baked crypto tokens to more than $1 billion.Could Bitcoin and altcoins sustain the recovery or will bears reign supreme? Let’s analyze the charts of the top-10 cryptocurrencies to find out.BTC/USDTBitcoin soared above the moving averages on March 9 but quickly retraced the rally on March 10. The bulls are again attempting to push the price back above the moving averages today. This indicates that bulls are buying on dips while bears are selling on rallies.BTC/USDT daily chart. Source: TradingViewBoth moving averages are flattening out and the relative strength index (RSI) is just below the midpoint, suggesting a balance between supply and demand. This equilibrium could tilt in favor of the buyers if they push and sustain the price above $42,594. The BTC/USDT pair could then rise to the overhead zone between $45,000 and the resistance line of the ascending channel.Alternatively, if the price once again turns down from the moving averages, the bears will try to pull the pair below the immediate support at $37,000. If this level gives way, the pair could challenge the support line of the channel. A break and close below this level will increase the possibility of the resumption of the downtrend.ETH/USDTEther’s (ETH) rebound met with stiff resistance at the 50-day simple moving average ($2,751) on March 9, indicating that bears are not willing to let go of their advantage easily. The price turned down from the moving averages on March 10 but a minor positive is that the bulls are attempting to defend the support line of the symmetrical triangle.ETH/USDT daily chart. Source: TradingViewIf the price rebounds off the support line, the bulls will again try to drive and sustain the price above the 50-day SMA. If they manage to do that, the ETH/USDT pair could rise to the psychological level at $3,000 and then retest the resistance line of the triangle.This is an important level for the bears to defend because a break and close above it will signal a potential change in trend. This setup has a pattern target at $4,311 on the upside.Contrary to this assumption, if the price continues lower and breaks below the support line of the triangle, it could indicate the resumption of the downtrend. The pair could then drop to $2,159.BNB/USDTBinance Coin (BNB) rose above the 50-day SMA ($389) on March 9 but the bulls could not sustain the higher levels. The bears took advantage of this situation and pulled the price back below the moving averages on March 10.BNB/USDT daily chart. Source: TradingViewIf the price sustains below the moving averages, the bears will attempt to pull the BNB/USDT pair to the strong support at $350. This is an important level to keep an eye on because a break below it could clear the path for a decline to $320.Alternatively, if the price rebounds off the current level, the buyers will again try to propel and sustain the pair above the moving averages. If they do that, the pair could start its northward march toward $445. XRP/USDTRipple (XRP) broke and closed above the downtrend line on March 9 but the bulls could not build upon this strength. The bears pulled the price back below the downtrend line on March 10. XRP/USDT daily chart. Source: TradingViewThe bulls did not allow the price to break below the 50-day SMA ($0.72), which suggests strong demand at lower levels. This tight range trading is unlikely to continue for long. If the price breaks and sustains above $0.78, the XRP/USDT pair could pick up momentum and rally toward the overhead resistance at $0.91. A break above this level could clear the path for a rally to the psychological level at $1.This positive view will invalidate if the price turns down and breaks below $0.69. That could turn the tables in favor of the bears.LUNA/USDTTerra’s LUNA token rose to a new all-time high on March 9 but the long wick on the day’s candlestick shows profit-booking at higher levels. The bulls again tried to resume the uptrend on March 10 but the bears had other plans.LUNA/USDT daily chart. Source: TradingViewThe failure to sustain the price above $103 may have attracted profit-booking from the short-term traders. That has pulled the LUNA/USDT pair below the critical level at $94. If the price sustains below $94, the decline could extend to the 20-day EMA ($80). A break and close below this level will suggest that the bullish momentum may have weakened. The pair could then drop to $70.Conversely, if the price rebounds off the current level or the 20-day EMA, it will indicate that the sentiment remains positive and traders are buying on dips. The bulls will then again try to push the pair to a new all-time high and toward the target objective at $125.SOL/USDTSolana (SOL) has been trading inside a descending triangle pattern, which will complete on a break and close below the crucial support at $81. The bulls tried a recovery on March 9 but could not push the price above the 20-day EMA ($89).SOL/USDT daily chart. Source: TradingViewIf bears sink and sustain the price below $81, the selling could intensify. The SOL/USDT pair could then resume its downtrend and plunge toward the next support at $66. The downsloping moving averages suggest that the path of least resistance is to the downside but the positive divergence on the RSI indicates that the sellers need to be careful of a possible bear trap.If the price rebounds off the current level, the bulls will again try to push and sustain the pair above the downtrend line. If they manage to do that, the pair could rally to $122.ADA/USDT Cardano’s (ADA) attempt to recover on March 9 met with strong resistance at the 20-day EMA ($0.88). This suggests that the sentiment remains negative and traders are selling on every minor rally.ADA/USDT daily chart. Source: TradingViewThe downsloping moving averages and the RSI in the negative territory suggest the path of least resistance is to the downside.The bears will now again attempt to pull the price below the strong support at $0.74 and resume the downtrend. A close below $0.74 could open the doors for a further decline to the next support at $0.68. The bulls will have to push and sustain the ADA/USDT pair above the psychological level at $1 to suggest that the bears may be losing their grip.Related: Here’s how traders were alerted to RUNE’s, FUN’s, WAVES’ and KNC’s big rallies last weekAVAX/USDTAvalanche (AVAX) failed to climb and sustain above the moving averages on March 9. This suggests that bears are defending the moving averages while the bulls are buying on dips to the uptrend line.AVAX/USDT daily chart. Source: TradingViewGenerally, tight ranges result in sharp trending moves. If bears sink and sustain the price below the uptrend line, the AVAX/USDT pair could start its decline toward the important support at $51. It may not be a straight drop because the bulls will try to arrest the fall in the zone between $64 and $61.Conversely, if bulls push the price above the moving averages, the pair will again attempt to rise above the downtrend line of the descending channel. A break and close above the channel could signal that the downtrend may be ending.DOT/USDTAfter struggling to stay above the 20-day EMA ($17) on March 9 and 10, Polkadot (DOT) has managed to break the resistance today. The bulls are currently attempting to push and sustain the price above the 50-day SMA ($18).DOT/USDT daily chart. Source: TradingViewIf they succeed, it will suggest that the downtrend could be ending. The DOT/USDT pair could thereafter rally to the overhead resistance at $23. A break and close above this resistance will signal a potential change in trend. Contrary to this assumption, if the price turns down from the current level, the bears will try to pull the price below the solid support at $16. If they manage to do that, the pair could retest the next major support at $14.DOGE/USDTDogecoin’s (DOGE) relief rally on March 9 fizzled out at the 20-day EMA ($0.12). This suggests that the bears are not ready to give up and they continue to sell near resistance levels.DOGE/USDT daily chart. Source: TradingViewThe DOGE/USDT pair dropped back below $0.12 on March 10, increasing the possibility of a retest of the critical support at $0.10. This zone is likely to attract strong buying from the bulls. The buyers will have to push and sustain the price above the 50-day SMA ($0.13) to indicate that the downtrend could be weakening.Conversely, if bears sink the price below $0.10, the selling could accelerate and the pair could plummet to the next support at $0.06.The views and opinions expressed here are solely those of the author and do not necessarily reflect the views of Cointelegraph. Every investment and trading move involves risk. You should conduct your own research when making a decision.Market data is provided by HitBTC exchange.

Čítaj viac

Price analysis 3/9: BTC, ETH, BNB, XRP, LUNA, SOL, ADA, AVAX, DOT, DOGE

Bitcoin (BTC) soared on March 9 as the Dow futures recovered sharply and United States Treasury Secretary Janet Yellen’s statement on President Joe Biden’s executive order regarding digital assets, which was released a day earlier by error, contained positive statements about the crypto industry.For the past few days, investors seem to have been accumulating cryptocurrencies at lower levels. CoinShares data for the week ending March 6 shows that cumulative inflows of $127 million into digital asset investment products were the highest since Dec. 12, 2021, and Bitcoin products saw an increase for the seventh consecutive week.Daily cryptocurrency market performance. Source: Coin360However, Bloomberg Intelligence senior commodity strategist Mike McGlone sounded cautious when he warned that the current geopolitical situation and surging crude oil prices caused a global recession, Bitcoin and Ether could face selling pressure initially. McGlone cautioned that if the U.S. equity markets plunge, Ether could drop to $1,700 because it is closely correlated to Nasdaq 100.Could Bitcoin and altcoins sustain the higher levels? Let’s analyze the charts of the top-10 cryptocurrencies to find out.BTC/USDTThe failure of the bears to pull the price below the immediate support at $37,000 may have attracted strong buying by the bulls. Bitcoin has soared above the moving averages on March 9.BTC/USDT daily chart. Source: TradingViewThe relative strength index (RSI) has jumped into the positive territory, indicating that the momentum may be turning bullish. If buyers sustain the price above the moving averages, the BTC/USDT pair could rise to the overhead zone between $45,000 and the resistance line of the ascending channel. The bears are expected to defend this zone with vigor.If the price turns down from the overhead zone, the pair could extend its stay inside the channel for a few more days. The bears will have to pull and sustain the price below the support line of the channel to gain control.ETH/USDTThe bears could not capitalize on the breakdown below the symmetrical triangle. Strong buying by the bulls near $2,400 started a recovery and Ether (ETH) has re-entered the triangle. This suggests that the recent breakdown may have been a bear trap.ETH/USDT daily chart. Source: TradingViewThe bulls are attempting to push and sustain the price above the moving averages. If they do that, the ETH/USDT pair could rally to the resistance line of the triangle. If bulls clear this barrier, it will suggest the possible start of a new uptrend. The pair could first rally toward the psychological level at $4,000 and then make a dash toward the pattern target at $4,311.This positive view will invalidate if the price turns down from the current level or the resistance line. That could keep the pair inside the triangle for a few more days. The bears will have to pull the pair below $2,400 to gain the upper hand.BNB/USDTBinance Coin (BNB) has broken above the 50-day simple moving average (SMA) ($392) and if bulls sustain the higher levels, the up-move could reach the overhead resistance at $445.BNB/USDT daily chart. Source: TradingViewThe bears are likely to mount a strong defense at $445. If the price turns down from this level, the BNB/USDT pair could drop to the moving averages. The flat 20-day exponential moving average (EMA) ($387) and the RSI near the midpoint indicate a balance between supply and demand.If bulls fail to sustain the price above the 50-day SMA, the bears will fancy their chances and try to pull the pair toward the support at $350. The price action inside the range between $445 and $350 is likely to remain volatile.XRP/USDTThe bulls continue to defend the 50-day SMA ($0.72), indicating strong demand at lower levels. The buyers will now try to push and sustain Ripple (XRP) above the downtrend line.XRP/USDT daily chart. Source: TradingViewIf they succeed, the buying could accelerate and the XRP/USDT pair may rally to the overhead zone between $0.85 and $0.91. This zone may offer strong resistance by the bears but if the bulls bulldoze their way through, the pair could rally to the psychological level at $1. On the downside, the bears will have to pull and sustain the price below $0.68 to turn the tables in their favor. The pair could then drop to the Feb. 24 intraday low at $0.62.LUNA/USDTTerra’s LUNA token bounced off the 20-day EMA ($77) on March 8, indicating that the sentiment remains positive and traders are buying on dips.LUNA/USDT daily chart. Source: TradingViewThe bulls have pushed the price above the overhead resistance at $94 and the LUNA/USDT pair is now close to the all-time high at $103. This level is likely to act as a stiff resistance but if bulls overcome this barrier, it will suggest the start of a new uptrend. The pair could then rally toward $125.Alternatively, if the rally stalls at $103, the bears will attempt to pull the price back below $94. If that happens, the bullish momentum could weaken in the short term. The positive momentum could remain intact as long as the price sustains above $94.SOL/USDTSolana (SOL) has bounced off the critical support at $81, indicating strong demand at this level. The RSI has formed a positive divergence, suggesting that the selling pressure could be reducing.SOL/USDT daily chart. Source: TradingViewThe bulls will now try to push the price above the downtrend line. If they manage to do that, it will invalidate the developing descending triangle pattern. Such a move may result in short-covering by the aggressive bulls, propelling the price toward the overhead resistance at $122. If bulls clear this hurdle, it could signal the start of a new uptrend.This bullish assumption will invalidate if the price turns down and breaks below the strong support at $81. That will complete the descending triangle pattern and open the doors for a possible drop to $66.ADA/USDT Cardano (ADA) bounced off the $0.74 support, indicating that bulls are buying on dips. The bulls will now attempt to push the price above the 20-day EMA ($0.90) and challenge the psychological level at $1.ADA/USDT daily chart. Source: TradingViewIf the price turns down from $1, it will suggest that bears continue to sell at higher levels. The ADA/USDT pair could then spend some time inside the $0.74 to $1 range. If bears sink the price below $0.74, the downtrend could resume. The pair could then drop to the next support at $0.68.On the other hand, if bulls push and sustain the price above $1, it will signal a possible change in the short-term trend. The pair could then rise to $1.26 where the bears may mount a strong resistance.Related: Trader gives $44K BTC price target as Bitcoin shrugs off executive order ‘nothingburger’AVAX/USDTAvalanche (AVAX) bounced off the uptrend line, indicating that bulls continue to buy on dips to this level. The buyers will now attempt to push the price to the downtrend line of the descending channel.AVAX/USDT daily chart. Source: TradingViewA break and close above the channel will signal a potential change in trend. The AVAX/USDT pair could then rally to the psychological level at $100. However, this may not be easy because the price has turned down from the downtrend line on four previous occasions. The bears will again try to stall the up-move at this level. If the price turns down from the downtrend line, the bears will again try to sink the pair below the uptrend line. If they pull it off, the pair could extend its decline to $51.DOT/USDTThe bulls held on to the support at $16 on March 7, which is a positive sign. Polkadot (DOT) will now attempt to break above the 50-day SMA ($18), which is an important level to keep an eye on.DOT/USDT daily chart. Source: TradingViewIf the price sustains above the 50-day SMA, it will indicate a possible change in the short-term trend. The DOT/USDT pair could then rally to the overhead resistance at $23. A break and close above this level could signal the start of a new uptrend with the first target objective at $30 and then $32.Contrary to this assumption, if the price turns down from the 50-day SMA, it will suggest that bears are not willing to relent and are selling on rallies. That will increase the possibility of a break below $16. DOGE/USDTDogecoin (DOGE) broke and closed below $0.12 on March 7 but the bears could not take advantage of this breakdown. This indicates that bulls are defending the zone between $0.12 and $0.10 aggressively.DOGE/USDT daily chart. Source: TradingViewThe bulls have pushed the price back above the breakdown level at $0.12. If the DOGE/USDT pair sustains above this level, the bulls will attempt to drive the price above the moving averages. If they succeed, it will suggest that bears may be losing their grip. The pair could then rally to the overhead resistance at $0.17.Contrary to this assumption, if the price turns down from the moving averages, it will indicate that bears have not yet given up and are selling on rallies. The sellers will then again try to sink the pair below the support zone.The views and opinions expressed here are solely those of the author and do not necessarily reflect the views of Cointelegraph. Every investment and trading move involves risk. You should conduct your own research when making a decision.Market data is provided by HitBTC exchange.

Čítaj viac

Získaj BONUS 8 € v Bitcoinoch

nakup bitcoin z karty

Registrácia Binance

Burza Binance

Aktuálne kurzy