Autor Cointelegraph By Rakesh Upadhyay

Top 5 cryptocurrencies to watch this week: BTC, VET, THETA, RUNE, AAVE

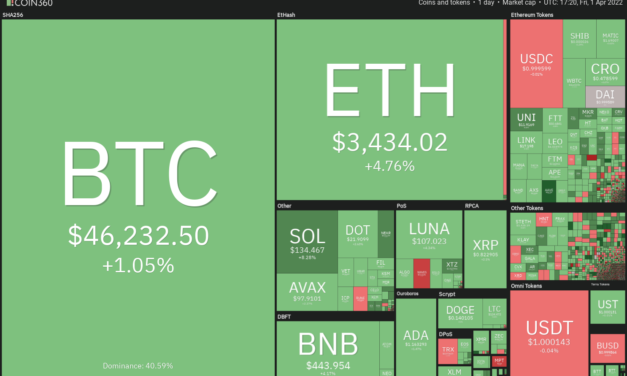
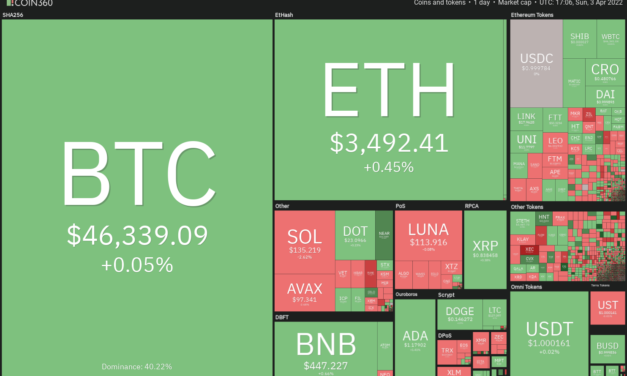
Bitcoin (BTC) is attempting to hold above its closest support level and traders are watching to see if the price can remain strong and close above the 2022 yearly open price at $46,200 for the second week in a row.April has historically been the best performing month of the year for the S&P 500, according to Sam Stovall, chief investment strategist at CFRA. If history repeats itself and the close correlation between the U.S. equity markets and Bitcoin continues, it could bode well for the crypto markets in the near term.Crypto market data daily view. Source: Coin360Another sentiment booster could be that the 19th million Bitcoin entered circulation on April 1. For the remaining 2 million Bitcoin, the crypto markets will have to wait for a long time because the last Bitcoin is expected to be mined by 2140. This could shift focus on how only a small quantity of Bitcoin is left to be mined and its growing demand could lead to scarcity and boost prices higher.Could Bitcoin hold above its critical support and if it does, will altcoins rally? Let’s study the charts of the top-5 cryptocurrencies that may extend their recovery in the short term.BTC/USDTBitcoin is witnessing a tough tussle between the bulls and the bears near the important level at $45,400. The bears tried to pull and sustain the price below this level but the bulls held their ground. This suggests that the bulls are attempting to flip the level into support.BTC/USDT daily chart. Source: TradingViewThe upsloping 20-day exponential moving average ($44,333) and the relative strength index (RSI) in positive territory indicate the path of least resistance is to the upside. The critical level to watch on the upside is the 200-day simple moving average ($48,276). If bulls thrust the price above this barrier, the BTC/USDT pair is likely to pick up momentum. The rally could face minor resistance at the psychological level at $50,000 but if this level is crossed, the next stop could be $52,000.Contrary to this assumption, if the price turns down from the current level or the overhead resistance, the bears will again try to pull the pair below $45,400 and the 20-day EMA. If that happens, the pair could drop to the 50-day SMA ($41,615). BTC/USDT 4-hour chart. Source: TradingViewThe 4-hour chart shows that the price has been correcting since hitting the resistance line of the ascending channel. Recovery attempts by the bulls are facing stiff resistance at the downtrend line. If bulls push and sustain the price above the downtrend line, the pair could rise to the resistance line of the channel.A break and close above the channel could signal the resumption of the uptrend. Alternatively, if the price turns down from the downtrend line, the bears will attempt to sink the pair to $44,000. If this level cracks, the decline may extend to $42,594.VET/USDTVeChain (VET) surged above the overhead resistance at $0.07 on March 27 but the bears stalled the recovery at the 200-day SMA ($0.09). A minor positive is that the bulls have not allowed the price to slide below the breakout level at $0.07.VET/USDT daily chart. Source: TradingViewIf the price turns up from the current level, the bulls will make one more attempt to clear the overhead hurdle at the 200-day SMA. If they manage to do that, it will suggest a possible change in trend. The VET/USDT pair could then rally to $0.10 and later to $0.13.The rising 20-day EMA ($0.06) and the RSI in the positive territory indicate advantage to buyers. This bullish view will invalidate if the price turns down and breaks below the 20-day EMA. Such a move could pull the pair to the 50-day SMA ($0.05).VET/USDT 4-hour chart. Source: TradingViewThe 20-EMA has flattened out and the RSI is near the midpoint on the 4-hour chart, indicating a balance between supply and demand. If the price breaks above $0.08, the bulls will attempt to propel the pair above $0.09. If they do that, the pair could extend its up-move.Conversely, if the price turns down and breaks below the 50-SMA, the pair could drop to the critical level at $0.07. If bulls flip this level into support, the pair will again try to rise above $0.09 but if the support at $0.07 cracks, the bears may be back in the game.THETA/USDTTheta Network’s THETA token has been range-bound between $2.50 and $4.40 for the past several weeks. The bulls attempted to push the price above the overhead resistance but failed. This suggests that the bears continue to defend the level aggressively.THETA/USDT daily chart. Source: TradingViewIf the price does not break below $3.80, it will suggest that traders are not closing their positions in a hurry as they expect the up-move to continue. The upsloping 20-day EMA ($3.54) and the RSI near the overbought zone indicate that the path of least resistance is to the upside.If buyers drive the price above the overhead zone between $4.40 and the 200-day SMA ($4.77), it will signal the start of a possible uptrend. The THETA/USDT pair could then pick up momentum and rally to $6.Contrary to this assumption, if the price slides below the 20-day EMA, the next stop could be the 50-day SMA ($3.17). Such a move will suggest that the pair may remain range-bound for a few more days.THETA/USDT 4-hour chart. Source: TradingViewThe 4-hour chart shows that the bears have repeatedly thwarted attempts by the bulls to thrust the price above the overhead resistance at $4.40. The 20-EMA has flattened out and the RSI is near the midpoint, indicating a balance between supply and demand.If the price slips below the 50-SMA, the short-term advantage could tilt in favor of the sellers. The price could then drop to $3.50. On the other hand, the bulls will gain the upper hand if the price breaks and sustains above the overhead resistance.Related: Trezor investigates potential data breach as users cite phishing attacksRUNE/USDTTHORChain (RUNE) has been trading inside a large descending triangle pattern for several months. The sharp rally of the past few days pushed the price to the downtrend line of the triangle where the bears are mounting a strong resistance.RUNE/USDT daily chart. Source: TradingViewIf the price turns down from the current level, the RUNE/USDT pair could drop to the 20-day EMA ($9.75). This is an important level to watch out for because if the price rebounds off the 20-day EMA, it will suggest that the sentiment remains positive and traders are buying on dips.That may enhance the prospects of a break above the downtrend line. If that happens, the bearish triangle setup will invalidate, which could be a bullish sign. The pair may then rally to $17.This bullish view will be negated in the short term if the price turns down and breaks below the 20-day EMA. That could pull the pair down to the 200-day SMA ($7.88). RUNE/USDT 4-hour chart. Source: TradingViewThe 4-hour chart shows that the pair is facing strong resistance near $13. A minor positive is that the bulls have not allowed the price to dip and sustain below $11. Therefore, this becomes an important level to keep an eye on.If the price breaks below this support, the pair could drop to the next major support at $10. Conversely, if the price rebounds off $11, the buyers will again try to resume the uptrend by driving the pair above the overhead resistance.AAVE/USDTAave (AAVE) broke out of the downtrend line on March 29 which indicated a potential change in trend. The bears tried to stall the recovery at the 200-day EMA ($226) but the bulls did not give up much ground.AAVE/USDT daily chart. Source: TradingViewThe buying resumed on April 1 and the AAVE/USDT pair broke above the 200-day SMA. If the price sustains above the 200-day SMA, it will signal the start of a new up-move. If bulls drive the price above $262, the rally may extend to the psychological level at $300. The bears may mount a stiff resistance at this level but if bulls overcome this barrier, the up-move could reach $350.This bullish view will invalidate in the short term if the price turns down and plummets below the 200-day SMA. The bears could then pull the price to the 20-day EMA ($187).AAVE/USDT 4-hour chart. Source: TradingViewThe 4-hour chart shows that the bulls are buying the dips to the 20-EMA. If bulls push the price above $261.20, the uptrend could resume. This rally could face resistance in the overhead zone between $283 and $300.The RSI is showing signs of a negative divergence, indicating that the bullish momentum may be weakening. If the price turns down and breaks below the 20-EMA, it will suggest that the short-term bulls may be booking profits. That could sink the pair to the 50-SMA.The views and opinions expressed here are solely those of the author and do not necessarily reflect the views of Cointelegraph. Every investment and trading move involves risk, you should conduct your own research when making a decision.

Čítaj viac

Price analysis 4/1: BTC, ETH, BNB, SOL, XRP, ADA, LUNA, AVAX, DOT, DOGE

Bitcoin (BTC) has clawed back much of the losses that took place in January and now the focus of traders shifts to April, which has historically been a strong month for the cryptocurrency. According to Coinglass data, Bitcoin has closed April in the red on onlthree occasions and the worst monthly loss was a 3.46% drop in 2015. Although history favors the bulls, the Whale Shadows indicator has noticed that more than 11,000 Bitcoin has left a wallet in which it had been lying dormant for seven to ten years. The movement of similar-sized quantities from dormant accounts has generally resulted in a major top, according to independent marke analyst Phillip Swift.Daily cryptocurrency market performance. Source: Coin360Along with keeping an eye on the crypto markets, traders should also track the performance of the U.S. stock markets for clues because Bitcoin has been closely correlated to the equity markets for the past several weeks.Could bulls clear the overhead hurdle in Bitcoin and select altcoins and extend the strong recovery from the lows? Let’s study the charts of the top-10 cryptocurrencies to find out.BTC/USDTBitcoin turned down from the 200-day simple moving average (SMA) ($48,291) on March 29 and dipped to the 20-day exponential moving average (EMA) ($43,935) on April 1. The long tail on April 1’s candlestick suggests that buyers are accumulating on dips.BTC/USDT daily chart. Source: TradingViewThe bulls will make another attempt to push the price above the 200-day SMA. If they manage to do that, the BTC/USDT pair could rally to $52,000 where the bears may again mount a strong resistance. Alternatively, if the price once again turns down from the 200-day SMA, it will suggest that bears have erected a strong barrier at this level. The pair could thereafter consolidate between the 20-day EMA and the 200-day SMA for a few days.A break and close below the 20-day EMA will suggest that the bullish momentum has weakened. That could result in a decline to the 50-day SMA ($41,461).ETH/USDTEther (ETH) turned down from the 200-day SMA ($3,488) on March 29 but the shallow correction and the sharp recovery suggest strong demand at lower levels.ETH/USDT daily chart. Source: TradingViewThe rising 20-day EMA ($3,098) and the relative strength index (RSI) near the overbought zone indicate that bulls are in control.If buyers propel the price above the 200-day SMA, the bullish momentum could pick up further and the ETH/USDT pair could rally to the psychological level at $4,000.Contrary to this assumption, if the price once again turns down from the overhead resistance, it will suggest that bears are unwilling to relent. The bears will then try to pull the pair below the 20-day EMA. If they succeed, the pair could drop to the 50-day SMA ($2,860).BNB/USDTBNB broke above the overhead resistance at $445 on March 30 and 31 but the bulls could not sustain the higher levels.BNB/USDT daily chart. Source: TradingViewThe bears pulled the price to the 20-day EMA ($413) on April 1 but the strong rebound off the level suggests strong buying by the bulls at lower levels. If bulls push and sustain the price above $445, the BNB/USDT pair could rise to the 200-day SMA ($467) and then make a dash to the psychological level at $500. This positive view will invalidate in the short term if the price turns down from the current level and plunges below the moving averages. The pair could then remain range-bound between $350 and $445 for a few more days.SOL/USDTSolana (SOL) had been witnessing a tough battle between the bulls and the bears near the critical level at $122. The long wick on the March 31 candlestick indicated selling at higher levels but the bears could not sustain the price below $122 on April 1.SOL/USDT daily chart. Source: TradingViewThis suggests that the bulls aggressively purchased on the minor dip. The buyers have pushed the price above the overhead resistance at $122, indicating the start of a potential new uptrend.The SOL/USDT pair could now challenge the 200-day SMA ($150). If bulls overcome this barrier, the next stop could be $163.Conversely, if the price fails to sustain above $122, it will suggest that the demand dries up at higher levels. The pair could then drop to the 20-day EMA ($103).XRP/USDTRipple (XRP) formed an inside-day candlestick pattern on March 30, which resolved in favor of the bears on March 31 with a sharp down move. This suggests that the buyers who may have purchased at lower levels closed their positions aggressively. XRP/USDT daily chart. Source: TradingViewThe 20-day EMA ($0.82) is flattening out and the RSI has dropped close to the midpoint, suggesting that the bullish momentum may be weakening. If the price breaks below the 50-day SMA ($0.78), the XRP/USDT pair could slide to the next support at $0.70.Contrary to this assumption, if the price rises from the current level, the buyers will try to drive the pair above $0.86 and again challenge the resistance at $0.91. A break and close above this level could open the gates for a possible rally to the psychological level at $1.ADA/USDT Cardano (ADA) turned down from the overhead resistance at $1.26, suggesting that the bears are defending the level with vigor. The price could now drop to the 20-day EMA ($1.05), which is an important level to keep an eye on. ADA/USDT daily chart. Source: TradingViewIf the price rebounds off the 20-day EMA, the buyers will make one more attempt to push the ADA/USDT pair above $1.26. If they manage to do that, the pair will complete an inverse head and shoulders pattern. This setup will suggest that the pair may have bottomed out.The pair could then rally to the overhead resistance zone between the 200-day SMA ($1.50) and $1.63 where the bears may mount a strong resistance. This bullish view will be negated in the short term if the price breaks and sustains below the 50-day SMA ($0.95).LUNA/USDTTerra’s LUNA token turned down after hitting a new all-time high on March 30, indicating that the bears are attempting to stall the uptrend. However, a minor positive is that the bulls have not allowed the price to break below $96. This suggests that the bulls are attempting to flip this level into support.LUNA/USDT daily chart. Source: TradingViewThe rising 20-day EMA ($95) suggests advantage to buyers but the negative divergence on the RSI indicates that the bullish momentum could be weakening. If buyers push the price above $111, the uptrend could resume. The LUNA/USDT pair could then rally to $125.Contrary to this assumption, if the price turns down from the current level or the overhead resistance and breaks below the 20-day EMA, it will suggest that the traders are aggressively booking profits. The pair could then drop to the 50-day SMA ($80).Related: ApeCoin risks another massive selloff as APE drops 70% in two weeks — Here’s whyAVAX/USDTAvalanche (AVAX) broke above the overhead resistance at $98 on March 30 and 31 but could not sustain the higher levels. This may have invited profit-booking by the short-term traders.AVAX/USDT daily chart. Source: TradingViewAlthough the bears pulled the price to the 20-day EMA ($87), the long tail on the day’s candlestick suggests strong demand at lower levels. The bulls are attempting to drive and sustain the price above the overhead zone between $98 and $100.If they manage to do that, the AVAX/USDT pair could pick up momentum and rally to $120. Conversely, if the price once again turns down from the overhead resistance, it will suggest strong selling at higher levels. That could pull the price to the moving averages.DOT/USDTThe failure to break above the $23 resistance may have attracted profit-booking by the short-term traders in Polkadot (DOT). That pulled the price down to the 20-day EMA ($20) on April 1.DOT/USDT daily chart. Source: TradingViewThe strong rebound off the 20-day EMA suggests buying on dips. The bulls will now make another attempt to clear the overhead hurdle at $23. If they succeed, the DOT/USDT pair could start a new uptrend and the price could rally to the 200-day SMA ($29).Alternatively, if the price turns down and breaks below the 20-day EMA, it will suggest that the bullish momentum may have weakened. That could pull the price down to $19 and if this level gives way, the next stop could be $16.DOGE/USDTDogecoin (DOGE) turned down from $0.15 on March 28 and dropped to the moving averages. This is an important support for the buyers to defend if they want the bullish sentiment to remain intact.DOGE/USDT daily chart. Source: TradingViewIf the price rebounds off the current level with strength, the bulls will attempt to push the DOGE/USDT pair above $0.15. If they succeed, the pair could rally to the overhead resistance at $0.17. The marginally rising 20-day EMA ($0.13) and the RSI in the positive territory indicate a minor advantage to buyers.This positive view will invalidate in the short term if bears sink and sustain the price below the moving averages. Such a move could open the doors for a possible drop to the critical support zone at $0.12 to $0.10.The views and opinions expressed here are solely those of the author and do not necessarily reflect the views of Cointelegraph. Every investment and trading move involves risk. You should conduct your own research when making a decision.Market data is provided by HitBTC exchange.

Čítaj viac

Price analysis 3/30: BTC, ETH, BNB, XRP, ADA, LUNA, SOL, AVAX, DOT, DOGE

Bitcoin’s (BTC) rally is taking a breather near the 200-day simple moving average (SMA) and that has resulted in what is either a minor pullback or consolidation in BTC and select altcoins. In the last few days, Terraform Labs has been on a Bitcoin buying spree. The wallet address, which has been speculated to be that of Terra, received $139 million worth of Bitcoin on March 30, taking its total to about $1.5 billion in BTC.With Terra breathing down its neck, MicroStrategy seems to have taken up the challenge. The business intelligence firm’s subsidiary MacroStrategy has secured a $205 million loan from Silvergate, which will be used to purchase Bitcoin, cover general corporate expenses and pay the necessary fees and interest on the loan. Daily cryptocurrency market performance. Source: Coin360The buying interest is not limited to the two companies. CoinShares data showed that institutional investors pumped in $193 million into digital asset investment products last week, the largest inflow since early December 2021.With institutional investors buying in large quantities, could Bitcoin and the major altcoins break above their overhead resistance levels? Let’s study the charts of the top 10 cryptocurrencies to find out.BTC/USDTBitcoin rose to the 200-day SMA ($48,288) on March 28 but the bulls could not push the price above it. The buyers again tried to clear the overhead hurdle on March 29 but failed.BTC/USDT daily chart. Source: TradingViewThe bears will now try to pull the price to the immediate support at $45,400. If the price rebounds off this support, the bulls will again attempt to thrust the BTC/USDT pair above the 200-day SMA. If they succeed, the pair could start its journey to $52,000.The rising 20-day exponential moving average (EMA) ($43,531) and the relative strength index (RSI) near the overbought zone indicate that bulls are in control.This positive view will invalidate if the price turns down and plummets below the 20-day EMA. If that happens, the pair could extend its stay inside the ascending channel for a few more days.ETH/USDTEther (ETH) broke and closed above the overhead resistance at $3,411 on March 29 but the bulls could not clear the obstacle at the 200-day SMA ($3,488). This indicates that bears have not yet given up and are attempting to stall the recovery at the 200-day SMA.ETH/USDT daily chart. Source: TradingViewIf the price sustains below $3,411, the bears will try to pull the ETH/USDT pair to the 20-day EMA ($3,042). A strong rebound off this level will suggest that the sentiment has turned positive and traders are buying on dips. The bulls will then again try to propel the price above the 200-day SMA. If they succeed, the pair could rally toward $4,000. Contrary to this assumption, if the price breaks below the 20-day EMA, it will suggest that the traders may be rushing to the exit. That could pull the pair down to the 50-day SMA ($2,853).BNB/USDTBNB tight range trading between $425 and $445 has resolved to the upside, indicating that bulls have absorbed the supply and are trying to gain the upper hand.BNB/USDT daily chart. Source: TradingViewThe upsloping 20-day EMA ($409) and the RSI in the overbought territory indicate that bulls are in control. If they sustain the price above $445, the BNB/USDT pair could rise to the 200-day SMA ($467) and later to $500.Conversely, if the price turns down and breaks below $425, the pair could drop to the 20-day EMA. This is an important level to keep an eye on because a break and close below it will suggest that the bullish momentum has weakened. The pair could then oscillate between $350 and $445 for a few more days.XRP/USDTRipple (XRP) broke above the overhead resistance at $0.91 on March 28 but the bears did not allow the price to sustain the higher levels. This indicates that the bears are aggressively defending the zone between $0.91 and $1.XRP/USDT daily chart. Source: TradingViewThe bulls are attempting to sustain the price above $0.86. If they succeed, the XRP/USDT pair could again rise to $0.91. A break and close above this level could open the doors for a possible rally to the psychological level at $1.Conversely, if the price sustains below $0.86, the bears will attempt to pull the pair below the moving averages. If they manage to do that, it will suggest that the bullish momentum has weakened. The pair could then drop to $0.70.ADA/USDT Cardano (ADA) is facing resistance at $1.26 as seen from the long wick on the candlestick on March 28 and 29. A minor positive is that the bulls have not given up much ground. ADA/USDT daily chart. Source: TradingViewThe upsloping 20-day EMA ($1) and the RSI in the overbought territory indicate that the path of least resistance is to the upside. If buyers propel and sustain the price above $1.26, the ADA/USDT pair could rise to the 200-day SMA ($1.51) and thereafter rally to $1.60.Alternatively, if the price turns down from the current level and breaks below $1.15, the bears will try to pull the pair to the 20-day EMA. This is an important level to watch out for because a break and close below it could sink the pair to $0.74.LUNA/USDTTerra’s LUNA token broke and closed above the overhead resistance at $96 on March 28. Although the long wick on the day’s candlestick showed selling near $100, the bulls did not allow the price to break back below $96.LUNA/USDT daily chart. Source: TradingViewThe buying resumed on March 29 and the bulls thrust the price above the all-time high at $105. If bulls sustain the price above $105, the buying momentum could pick up and the LUNA/USDT pair may rally to $115 and later to $125.A minor negative is that the RSI is showing signs of forming a negative divergence. If the price breaks and sustains below $105, the pair could drop to $96. This is an important support for the bulls to defend because a break and close below it could aggravate selling. The pair could then drop to the 50-day SMA ($78).SOL/USDTAfter sustaining above $106 for the past two days, Solana (SOL) has risen above the overhead resistance at $122, indicating strong buying by the bulls.SOL/USDT daily chart. Source: TradingViewIf buyers sustain the price above $122, the SOL/USDT pair could start a new uptrend, which could reach the 200-day SMA ($150). This level is likely to act as a stiff resistance but if bulls overcome it, the rally could reach $180.Contrary to this assumption, if the price turns down from the current level and breaks below $106, it will suggest that the break above $122 may have been a bull trap. The pair could then drop to the moving averages and remain stuck between $81 and $122 for a few more days.Related: Bitcoin sentiment hits ‘greed’ in 2022 first amid calls for $45K BTC price pullbackAVAX/USDTThe long wick on the candlestick of the past two days shows that bears are defending the level at $98. However, a minor positive is that the bulls have not allowed Avalanche (AVAX) to drop to the 20-day EMA ($85). This suggests that the traders are in no hurry to exit their positions.AVAX/USDT daily chart. Source: TradingViewThe rising 20-day EMA and the RSI in the positive territory indicate that bulls are in control. If buyers thrust the price above the $98 to $100 resistance zone, the AVAX/USDT pair could pick up momentum and rally to $120.This positive view will invalidate in the short term if bears sink and sustain the price below the 50-day SMA ($81). Such a move will suggest that the pair could extend its stay inside the $65 to $98 range for a few more days.DOT/USDTPolkadot (DOT) has been facing stiff resistance at $23 for the past three days but a positive sign is that the bulls have not ceded ground to the bears. This suggests that the bulls expect a break above the overhead resistance. DOT/USDT daily chart. Source: TradingViewThe 20-day EMA ($20) is sloping up and the RSI is in the positive zone, indicating that the path of least resistance is to the upside. If bulls drive and sustain the price above $23, the DOT/USDT pair could pick up momentum and rally to the 200-day SMA ($29).Contrary to this assumption, if the price turns down from the current level and breaks below the 20-day EMA, it will suggest that the bullish momentum may have weakened. That could keep the pair range-bound between $16 and $23 for the next few days.DOGE/USDTDogecoin (DOGE) rose above $0.15 on March 28 but the long wick on the day’s candlestick suggests that bears are selling at higher levels. DOGE/USDT daily chart. Source: TradingViewThe moving averages have completed a bullish crossover and the RSI is in the positive territory, indicating that bulls have the upper hand. If the price turns up from the current level and breaks above $0.15, the DOGE/USDT pair could rally to the overhead resistance at $0.17 where the bears may again mount a strong defense.Contrary to this assumption, if the price continues lower and breaks below the moving averages, it will suggest that the pair may spend some more time inside the range between $0.17 and $0.10.The views and opinions expressed here are solely those of the author and do not necessarily reflect the views of Cointelegraph. Every investment and trading move involves risk. You should conduct your own research when making a decision.Market data is provided by HitBTC exchange.

Čítaj viac

Price analysis 3/28: BTC, ETH, BNB, XRP, ADA, LUNA, SOL, AVAX, DOT, DOGE

Bitcoin (BTC) and several altcoins surprised many with their newfound strength during the weekend. Bitcoin’s rally easily sliced through the $45,900 level, which according to Glassnode was an area of resistance because several investors had purchased near that level when Bitcoin was declining after hitting its all-time high in November.Bitcoin’s strength may have attracted buying in several altcoins, which are still languishing below their 52-week high. The rally in Bitcoin and the bottom fishing in altcoins has boosted investor sentiment, pushing the Crypto Fear and Greed Index into the “greed” territory. Daily cryptocurrency market performance. Source: Coin360Interestingly, the crypto markets have held a large part of their gains despite the tepid performance of the U.S. stock markets on March 28. This suggests that the crypto markets may be in the early stages of decoupling from the equity markets.Could buyers sustain the momentum and clear the overhead resistance levels? Let’s study the charts of the top-10 cryptocurrencies to find out.BTC/USDTBitcoin hesitated on March 26 as seen from the inside-day candlestick. This indicated indecision among the bulls and the bears. This uncertainty resolved to the upside on March 27 as the bulls regrouped and propelled the price above the overhead resistance at $45,400.BTC/USDT daily chart. Source: TradingViewThe sharp rally of the past few days has pushed the relative strength index (RSI) into the overbought zone for the first time since October 2021. This suggests that the momentum favors the buyers.The bears may attempt to stall the up-move at the resistance line of the ascending channel but if bulls overcome this barrier, the BTC/USDT pair could rally to the psychological level at $50,000 and later to $52,000.If the price turns down from the resistance line, the buyers will try to flip $45,400 into support. If they succeed, it will suggest that the up-move may continue. The bears will have to pull and sustain the price below $45,400 to weaken the bullish momentum.ETH/USDTEther (ETH) broke above the symmetrical triangle on March 25 but the bulls could not sustain the higher levels. However, the buyers did not cede ground to the bears and resumed their purchase on March 26.ETH/USDT daily chart. Source: TradingViewThe momentum picked up on March 27 and the ETH/USDT pair has reached $3,411 where the bulls may encounter a minor resistance. If bulls bulldoze their way through, the ETH/USDT pair could rally toward the psychological level at $4,000.Alternatively, if the price turns down from $3,411, the pair could retest the breakout level from the triangle. If the price rebounds off this level, it will suggest strong buying on dips. The bulls will then again try to resume the up-move.The bears will have to pull and sustain the price inside the triangle to suggest that the bullish momentum may have weakened.BNB/USDTBNB continued its northward march and has reached the overhead resistance at $445. The bears are likely to defend this level with vigor.BNB/USDT daily chart. Source: TradingViewThe rising 20-day exponential moving average (EMA) ($402) and the RSI near the overbought zone indicate that bulls are in control. If buyers thrust the price above $445, the BNB/USDT pair could rally toward the psychological level at $500. This level could again act as a strong resistance.If the price turns down from $500 but does not break below $445, it will suggest that the bulls have flipped the level into support. That will increase the likelihood of a break above the overhead resistance.Contrary to this assumption, if the price turns down from $445, the pair could drop to the 20-day EMA.XRP/USDTRipple (XRP) turned up on March 26, indicating that bulls are buying on minor dips. The buyers pushed the price above the strong resistance at $0.86 but are facing resistance near $0.91.XRP/USDT daily chart. Source: TradingViewBoth moving averages are sloping up and the RSI is in the positive zone. If buyers do not allow the price to slide below $0.86, the prospects of a break above $0.91 increase. If that happens, the XRP/USDT pair could rally to the psychological level at $1.This positive view will be invalidated if the price turns down from the current level or the overhead resistance at $0.91 and plummets below the moving averages. Such a move could pull the price to the strong support at $0.70.ADA/USDT Cardano (ADA) has continued its recovery and the price has reached the overhead resistance at $1.26 where the bears are likely to mount a strong defense. ADA/USDT daily chart. Source: TradingViewThe rising 20-day EMA ($1) and the RSI in the overbought zone suggest that bulls are in control. If the price turns down from overhead resistance but the bulls do not give up much ground, it will increase the possibility of a break above $1.26.If that happens, the ADA/USDT pair could rally to $1.60 and then march higher toward $1.80. This bullish view will invalidate if the price turns down from the overhead resistance and breaks below the psychological level at $1. LUNA/USDTTerra’s LUNA token has been stuck in a tight range between the overhead resistance at $96 and the support at the 20-day EMA ($90). This tight-range trading could soon lead to a sharp trending move.LUNA/USDT daily chart. Source: TradingViewThe rising 20-day EMA and the RSI in the positive territory suggest that the path of least resistance is to the upside. If buyers propel and sustain the price above $96, the LUNA/USDT pair could retest the all-time high at $105. This level is likely to act as a major obstacle but if bulls overcome it, the uptrend may resume. The pair could then rally to $125. This positive view will invalidate in the short term if the price turns down and breaks below the 20-day EMA. That could open the gates for a possible decline to $82.SOL/USDTAfter trading near the overhead resistance at $106 for a few days, Solana (SOL) broke and closed above the level on March 27. The moving averages have completed a bullish crossover and the RSI is near the overbought zone, indicating an advantage to buyers.SOL/USDT daily chart. Source: TradingViewIf bulls sustain the price above $106, the SOL/USDT pair could rise to $122. The bears are expected to defend this level aggressively. If the price turns down from this level and breaks below $106, it will suggest that the pair may remain range-bound for a few more days.The bulls will have to clear the overhead hurdle at $122 to signal the start of a new potential uptrend. The pair could then start its up-move, which could reach the overhead resistance zone between $158 and $163.Related: Bitcoin to $58K next? A 2019-like ‘reversal ascending triangle’ hints at more upside for BTCAVAX/USDTAvalanche (AVAX) rebounded off the 20-day EMA ($83) on March 26, indicating that bulls are buying on dips. The buyers will now try to sustain the price above the immediate resistance at $92.AVAX/USDT daily chart. Source: TradingViewIf they succeed, the AVAX/USDT pair could rally to the overhead resistance zone at $98 to $100. This is an important zone for the bears to defend because a break and close above it could extend the rally to $120. If the price turns down from the overhead zone, the bears will try to pull the pair to the moving averages. If the price rebounds off this level, the pair may remain stuck between the moving averages and the overhead zone for a few days. DOT/USDTPolkadot (DOT) picked up momentum on March 27 and has reached the stiff overhead resistance at $23. The upsloping 20-day EMA ($20) and the RSI near the overbought zone suggest that bulls have the upper hand.DOT/USDT daily chart. Source: TradingViewIf bulls drive and sustain the price above $23, the DOT/USDT pair could rally to $28. If bulls succeed in clearing this hurdle, the up-move may extend to $30 and later to $32.Alternatively, if the price turns down from the overhead resistance, the bears will try to pull the pair to the 20-day EMA. A strong rebound off this support will suggest that bulls continue to buy on dips. That will increase the possibility of a break above the overhead barrier.This positive view will invalidate if the price breaks below the moving averages. That could extend the consolidation between $16 and $23 for a few more days.DOGE/USDTThe bulls flipped the 50-day simple moving average (SMA) ($0.13) into support on March 25. This attracted strong buying in Dogecoin (DOGE), putting it on the path to a possible rally to $0.17.DOGE/USDT daily chart. Source: TradingViewThe moving averages are on the verge of a bullish crossover and the RSI is near the overbought zone, indicating that buyers have the upper hand. If bulls drive the price above $0.17, the DOGE/USDT pair could rise to $0.22.If the price turns down from $0.17 but does not give up much ground, it will suggest that the traders expect the recovery to continue.Conversely, if the price turns down sharply from the current level or the overhead resistance, it will signal that the pair may remain range-bound between $0.12 and $0.17 for a few more days.The views and opinions expressed here are solely those of the author and do not necessarily reflect the views of Cointelegraph. Every investment and trading move involves risk. You should conduct your own research when making a decision.Market data is provided by HitBTC exchange.

Čítaj viac

Top 5 cryptocurrencies to watch this week: BTC, ADA, AXS, LINK, FTT

Bitcoin (BTC) is attempting to notch its second successive weekly gains and end at the highest weekly closing price year-to-date. According to on-chain data from Glassnode, the recovery in Bitcoin’s price was driven by demand in the spot markets. This is likely to cheer the bulls because history suggests that spot market demand leads to sustained upside.Another positive sign is the strong demand for the ProShares Bitcoin Strategy exchange-traded fund (BITO) in the past two weeks, which pushed its exposure to a record high. Arcane Research said the strong inflows “suggest that Bitcoin appetite through traditional investment vehicles is increasing.”Crypto market data daily view. Source: Coin360Along with Bitcoin, the broader crypto space is also attracting investors. According to research firm Fundstrat, venture capital buyers pumped $4 billion into the crypto space in the last three weeks of February.Could buyers sustain the momentum and extend the relief rally in Bitcoin and altcoins? Let’s study the charts of the top-5 cryptocurrencies that may outperform in the short term.BTC/USDTThe long wick on Bitcoin’s March 25 candlestick shows that the bears are defending the overhead resistance at $45,400. A minor positive is that the bulls have not given up much ground, suggesting that the traders are not closing their positions in a hurry.BTC/USDT daily chart. Source: TradingViewThe 20-day exponential moving average ($42,025) has turned up and the relative strength index (RSI) is in the positive territory, indicating that bulls are in command. If buyers drive the price above $45,400, the BTC/USDT pair could rise to the resistance line of the ascending channel. This level may again act as an obstacle, but if bulls overcome it the pair could rally to the psychological level at $50,000.Contrary to this assumption, if the price turns down from $45,400, the bears will try to pull the pair to the strong support at $42,594. This is an important level to watch on the downside because if bulls flip it to support, the possibility of a break above $45,400 increases.The bears will have to pull and sustain the price below the moving averages to signal that the bulls have been pushed to the back foot.BTC/USDT 4-hour chart. Source: TradingViewThe 4-hour chart shows that the price turned down from the overhead resistance but the bulls did not allow the pair to break below the 20-EMA. This suggests that traders are buying on every minor dip.The rising moving averages and the RSI near the overbought zone suggest that the path of least resistance is to the upside. This positive view will invalidate in the short term if the price breaks and sustains below the 20-EMA. In that case, the pair may drop to $42,594.ADA/USDTCardano (ADA) has been sustaining above the critical level at $1 for the past few days. This indicates that bulls who may have purchased at lower levels are not booking profits aggressively as they expect the recovery to continue.ADA/USDT daily chart. Source: TradingViewThe moving averages have completed a bullish crossover and the RSI is in the positive zone, indicating that bulls have the upper hand. If buyers push and sustain the price above $1.26, the bullish momentum may pick up and the ADA/USDT pair could rally to the next critical resistance at $1.60.Alternatively, if the price turns down from $1.26 but rebounds off $1, it will suggest that the pair may remain range-bound between the two levels for a few more days. The bears will have to sink and sustain the price below the moving averages to invalidate the bullish view.ADA/USDT 4-hour chart. Source: TradingViewThe 4-hour chart shows that the bears are aggressively defending the overhead resistance at $1.20 but a minor positive is that the bulls have not allowed the price to sustain below the 20-EMA. If the price rises from the current level, the bulls will again try to clear the hurdle at $1.20 and push the pair to $1.26.Alternatively, if the price turns down and breaks below the 20-EMA, it will suggest that the bullish momentum has weakened. The pair could then gradually decline toward the strong support at $1.AXS/USDTAxie Infinity (AXS) has been trading between $72 and $44 for the past few days. The buyers pushed the price above the overhead resistance on March 25 but could not sustain the higher levels. This indicates that the bears are defending the level with vigor.AXS/USDT daily chart. Source: TradingViewThe moving averages have completed a bullish crossover and the RSI is in the positive territory, suggesting advantage to buyers.If the price turns up from the current level or rebounds off the 20-day EMA ($56), the bulls will again try to thrust the AXS/USDT pair above $72. If they manage to do that, the up-move may pick up momentum and the pair may rally to $100.This positive view will invalidate if the price continues lower and breaks below the 20-day EMA. That could keep the pair range-bound for a few more days.AXS/USDT 4-hour chart. Source: TradingViewThe 4-hour chart shows that the bulls pushed the price above the overhead resistance at $72 but could not sustain the higher levels. This may have attracted profit-booking by the short-term traders which pulled the price below the 20-EMA.If the price turns up from the current level and breaks above $68, it will suggest accumulation on dips. The buyers will then try to clear the obstacle at $72 and start a new up-move.Contrary to this assumption, if the price sustains below the 20-EMA, the correction could extend to the 50-simple moving average. Related: Dogecoin signals bottoming out as DOGE rebounds 30% in two weeks — What’s next?LINK/USDTChainlink (LINK) has been trading inside a massive range between $13 and $36 for the past several months. Although bears pulled the price below the support of the range, they could not sustain the breakdown. This suggests that the markets rejected the lower levels.LINK/USDT daily chart. Source: TradingViewThe moving averages have completed a bullish crossover and the RSI is in the positive territory, suggesting that the buyers have the upper hand. The rally may face resistance at the downtrend line but if this barrier is crossed, the LINK/USDT pair could rally to $20. Alternatively, if the price turns down from the current level, the moving averages are likely to act as strong support. If the price rebounds off it, the possibility of a break above the downtrend line could increase. This positive view will invalidate if the bears pull the price below the moving averages. That could open the doors for a possible drop to $13.LINK/USDT 4-hour chart. Source: TradingViewThe bears are mounting a strong defense at $16.50 but a minor positive is that the buyers have not allowed the price to slip below the 50-SMA. If the price rises from the current level or rebounds off the moving averages, the bulls will try to propel the pair above $16.50. If they succeed, the pair could rally to $17.50.Contrary to this assumption, if the price breaks below the 50-SMA, it will suggest that the short-term bulls may be closing their positions. There is a minor support at $15 but if it gives way, the pair could slide to $14.FTT/USDTFTX Token (FTT) broke and closed above $49 on March 24, completing an ascending triangle pattern. Although buyers pushed the price above the psychological resistance at $50 on March 25, they could not sustain the higher levels.FTT/USDT daily chart. Source: TradingViewThis suggests that the bears have not yet given up and they continue to sell at higher levels. The bears will now try to pull and sustain the price back below $49. If they manage to do that, the aggressive bulls who purchased the breakout from the triangle may get trapped. This could sink the FTT/USDT pair to the 20-day EMA ($45).If the price rebounds off this level, the buyers will again try to clear the overhead resistance zone between $49 to $52 and resume the up-move.Conversely, if the price slips below the moving averages, it will suggest that bears are attempting a strong comeback. A break and close below the uptrend line of the triangle will invalidate the bullish pattern. The pair may then decline to $39.FTT/USDT 4-hour chart. Source: TradingViewThe rally above $51 pushed the RSI deep into the overbought territory. Usually, such moves are followed by a sharp correction or consolidation. If bears pull the price below $49, the pair could decline further to the 50-SMA.If the price rebounds off this level, the buyers will again try to push the pair above $52 and resume the up-move. On the other hand, if bears pull the price below the 50-SMA, the selling could intensify and the pair may drop to $45.The views and opinions expressed here are solely those of the author and do not necessarily reflect the views of Cointelegraph. Every investment and trading move involves risk, you should conduct your own research when making a decision.

Čítaj viac

Získaj BONUS 8 € v Bitcoinoch

nakup bitcoin z karty

Registrácia Binance

Burza Binance

Aktuálne kurzy