Autor Cointelegraph By Rakesh Upadhyay

Price analysis 4/11: BTC, ETH, BNB, SOL, XRP, ADA, LUNA, AVAX, DOT, DOGE

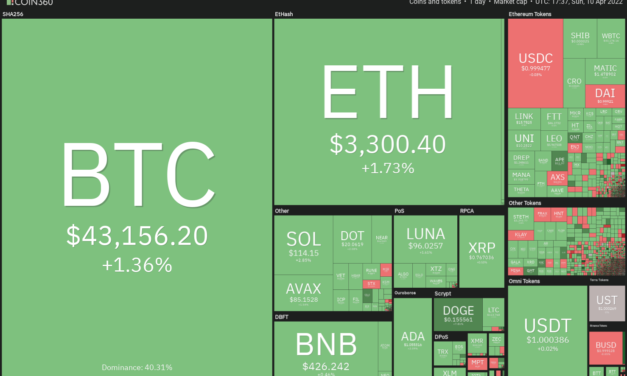
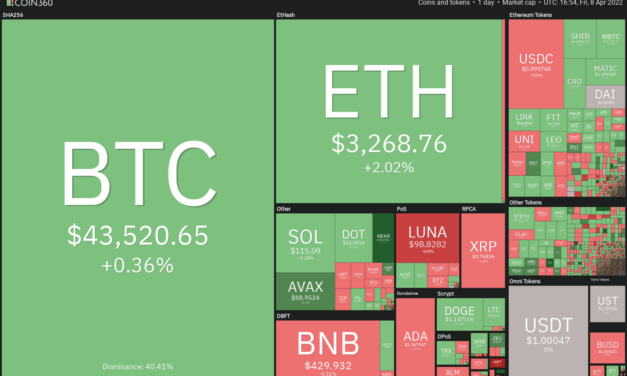
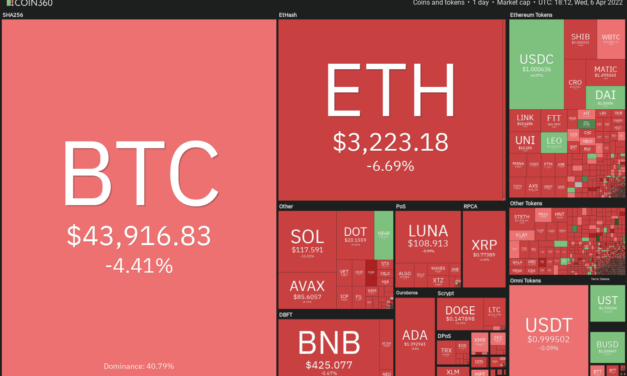
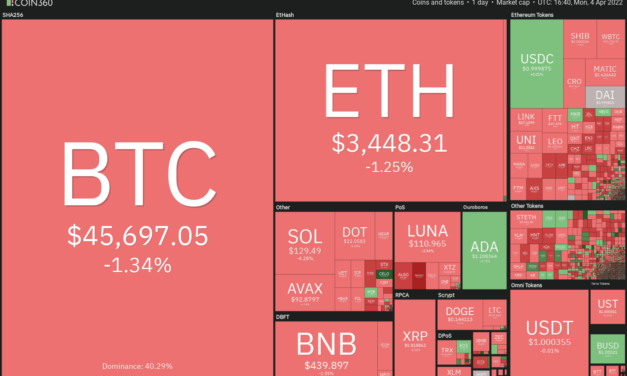
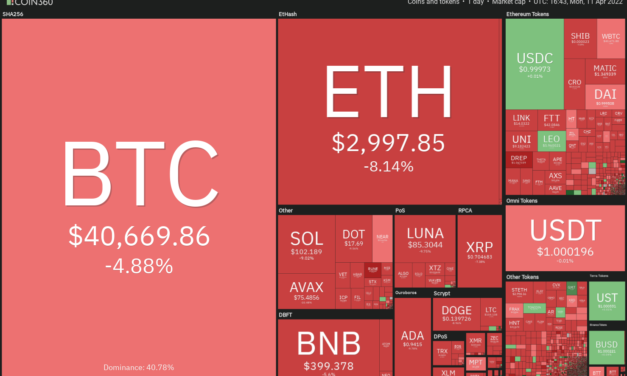
Bitcoin (BTC) and most major altcoins have broken key support levels to start the week on a weak note. The crypto markets seem to be following the U.S. equity markets, which are being pulled down as investors reduce exposure to risky assets because of rising rates. Arthur Hayes, ex-CEO of derivatives giant BitMEX, said that with rates moving higher and the Fed tapering its asset purchases, the equity markets could witness a meltdown. If that happens, Hayes expects the crypto markets to continue lower and Bitcoin to drop to $30,000 and Ether (ETH) to $2,500 by June of this year.Daily cryptocurrency market performance. Source: Coin360Ark Invest founder Cathie Wood said in an interview with CNBC that decentralized finance applications are attracting huge interest from investors. The legacy banking industry is feeling the heat because they are not only losing the lending and saving business to DeFi but also losing talent to the crypto industry. Although the long-term remains positive, could Bitcoin and altcoins weaken further in the near term? Let’s study the charts of the top-10 cryptocurrencies to find out.BTC/USDTThe bulls held Bitcoin above the 50-day simple moving average (SMA) ($41,908) for the past few days but could not push the price above the 20-day exponential moving average (EMA) ($43,576). This suggests that bears are selling on rallies.BTC/USDT daily chart. Source: TradingViewThe selling picked up momentum on April 11 and the bears have pulled the price below the 50-day SMA. There is minor support at the psychological level at $40,000 but if it cracks, the BTC/USDT pair could plummet to the support line of the ascending channel. The bulls are likely to defend this level with all their might.The downsloping 20-day EMA and the RSI in the negative territory indicate that bears are back in the driver’s seat. This negative view will be invalidated in the short term if the price turns up and breaks above the 20-day EMA. The pair could then rise to $45,400.ETH/USDTEther traded near the 20-day EMA ($3,198) for the past few days but the weak bounce off it suggested a lack of aggressive buying by the bulls. That may have emboldened the bears who have accelerated their selling today.ETH/USDT daily chart. Source: TradingViewThe bears will now try to pull the price to the 50-day SMA ($2,940). If the price rebounds off this support, the ETH/USDT pair could consolidate between the 50-day SMA and the 200-day SMA ($3,489) for a few days.Alternatively, if the price breaks below the 50-day SMA, the selling could accelerate and the pair could drop to $2,800. A break below this support could result in a decline to the trend line. The bulls are expected to defend this level aggressively.BNB/USDTBNB turned down from the overhead resistance at $445 on April 8 and broke below the 20-day EMA ($422). This suggests that bears are selling on rallies to $445.BNB/USDT daily chart. Source: TradingViewThe buyers tried to push the price back above the 20-day EMA in the past two days but could not sustain the higher levels. This renewed the selling and the BNB/USDT pair has dropped to the 50-day SMA ($400).A strong rebound off the current level will suggest that bulls are accumulating on dips. The buyers will have to push and sustain the price back above the 20-day EMA to enhance the prospects for a retest at $445.Conversely, if the price breaks below the 50-day SMA, it will suggest that buying has dried up. That could pull the pair down to the strong support at $350.SOL/USDTSolana (SOL) turned down from the overhead resistance at $122 on April 8 and plunged below the 20-day EMA ($112). The bulls pushed the price back above the 20-day EMA on April 10 but could not sustain the higher levels. This suggests that bears are selling on rallies.SOL/USDT daily chart. Source: TradingViewThe selling picked up momentum on April 11 and the bears have pulled the price below the support at $106. The SOL/USDT pair could now drop to the 50-day SMA ($98), which is likely to act as strong support.If the price rebounds off the 50-day SMA and breaks above the 20-day EMA, it will suggest strong demand at lower levels. On the other hand, a break and close below the 50-day SMA could open the doors for a further downside to $81.XRP/USDTRipple (XRP) had been trading above the $0.75 level for the past few days but the failure to push the price back above the moving averages may have attracted further selling by the bears.XRP/USDT daily chart. Source: TradingViewThe 20-day EMA ($0.79) has turned down and the RSI is near 34, indicating that sellers are in control. The next stop is likely to be $0.69. A strong rebound off this level will suggest that bulls are defending this level with vigor. That could keep the XRP/USDT pair range-bound between $0.69 and $0.91 for a few days.However, if the price breaks below $0.69, the selling could intensify further and the pair could drop to the next major support at $0.60.ADA/USDT Cardano (ADA) made several attempts to rise back above the 20-day EMA ($1.06) in the past few days but the bears did not relent. The selling intensified on April 11 and the bears pulled the price below the 50-day SMA ($0.96).ADA/USDT daily chart. Source: TradingViewIf the price sustains below the 50-day SMA, the ADA/USDT pair could drop to the critical support at $0.74. The bears are expected to defend this level with all their might. A strong bounce off it could suggest that the pair may consolidate inside a large range between $0.74 and $1.26 for a few days.Contrary to this assumption, if the price turns up from the current level and rises above the 20-day EMA, it will suggest strong buying at lower levels. That could limit the trading range between the 50-day SMA and $1.26.LUNA/USDTTerra’s LUNA token plunged and closed below the 20-day EMA ($99) on April 8. The bulls tried a recovery on April 9 but could not challenge the 20-day EMA. This may have attracted further selling and the bears have pulled the price below the 50-day SMA ($90).LUNA/USDT daily chart. Source: TradingViewThe 20-day EMA has turned down and the RSI has dipped into the negative zone, suggesting that the momentum has turned in favor of the bears. If the price sustains below the 50-day SMA, the possibility of a drop to $75 increases. If this level also cracks, the next stop could be the strong support at the 200-day SMA ($65).On the contrary, if the price turns up from the current level and rises above the 50-day SMA, it will suggest strong demand at lower levels. The bulls will then again attempt to push the price above the 20-day EMA.Related: Axie Infinity sees ‘no signs of buyers’ as AXS price tumbles 30% in two weeksAVAX/USDTThe bulls failed to sustain Avalanche (AVAX) above the 20-day EMA ($86) on April 8, suggesting that the bears are defending this level. This may have led to further selling and the price dipped below the 50-day SMA ($82) on April 10.AVAX/USDT daily chart. Source: TradingViewThe 20-day EMA has turned down and the RSI is in the negative territory, indicating that bears have the upper hand. The sellers will attempt to pull the price to the next strong support at $65.If the price rebounds off this level, it will suggest that the AVAX/USDT pair could oscillate between $65 and $99 for a few more days. Alternatively, if the price turns up from the current level, the bulls will again try to push the pair above the 20-day EMA and challenge the overhead resistance at $99.DOT/USDTThe bulls defended the 50-day SMA ($19) from April 8 to 10 but the failure to push Polkadot (DOT) above the 20-day EMA ($20) may have attracted selling. That has pulled the price below the strong support at $19.DOT/USDT daily chart. Source: TradingViewThe 20-day EMA has started to turn down and the RSI is in the negative territory, indicating that bears have the upper hand. The DOT/USDT pair could now drop to $16, which is likely to act as a strong support.If the price rebounds off this level, the pair could remain stuck between $16 and $21 for a few more days. The next trending move is likely to start on a break below $16 or a rally above the overhead hurdle at $21.DOGE/USDTDogecoin (DOGE) attempted a rally on April 10 but the long wick on the candlestick shows that bears sold at higher levels. The bears will now try to sink and sustain the price below the 20-day EMA ($0.14). DOGE/USDT daily chart. Source: TradingViewIf that happens, the DOGE/USDT pair could slide to the 50-day SMA ($0.13). Such a move will suggest that the pair could remain stuck inside the large range between $0.17 and $0.10 for the next few days.The flattening 20-day EMA and the RSI near the midpoint also suggest a consolidation in the near term. If the price rebounds off the current level, the bulls will again try to push the pair to $0.17. A break and close above the 200-day SMA ($0.18) could indicate the start of a potential new uptrend.The views and opinions expressed here are solely those of the author and do not necessarily reflect the views of Cointelegraph. Every investment and trading move involves risk. You should conduct your own research when making a decision.Market data is provided by HitBTC exchange.

Čítaj viac

Top 5 cryptocurrencies to watch this week: BTC, NEAR, FTT, ETC, XMR

Bitcoin (BTC) dropped from a high of $47,200 on April 5 to a low of $42,107 on April 8, indicating possible selling by short-term traders who may have preferred to lock in their profits. However, the price action is still stuck in a tight range during the weekend, indicating that supply and demand are in balance.Although the Crypto Fear & Greed Index is in the fear zone, Bitcoin whales on crypto exchange Bitfinex remained unfazed and continued to purchase BTC. Interestingly, one large investor continued to buy $1 million of Bitcoin every day, without attempting to time the market, using the strategy of dollar-cost averaging.Crypto market data daily view. Source: Coin360Another whale that utilized the dip to add more Bitcoin to its existing stockpile was Terra. This week, the wallet associated with the Luna Foundation Guard added 4,130 Bitcoin, taking its total holding to 39,897.98 BTC.Could Bitcoin bounce back sharply due to whale buying? Will select altcoins also turn higher in the short term? Let’s study the charts of the top-5 cryptocurrencies that may outperform if the sentiment improves.BTC/USDTBitcoin bounced off the support at $42,594 on April 7 but the bulls could not clear the barrier at the 20-day EMA ($43,922) on April 8. This may have attracted selling by traders, which pulled the price below the $42,594 support.BTC/USDT daily chart. Source: TradingViewA minor positive is that the bulls are attempting to defend the 50-day simple moving average ($42,620). If bulls push and sustain the price above the 20-day exponential moving average ($43,923), it will increase the possibility of range-bound action in the short term. The BTC/USDT pair may then oscillate between the 50-day SMA and the 200-day SMA ($48,219) for a few days.On the contrary, a weak bounce off the 50-day SMA will suggest a lack of aggressive buying at the current levels. The bears will then try to capitalize on this opportunity and sink the pair below the 50-day SMA. If they succeed, the pair could drop to the psychological level at $40,000 and if this level also cracks, the next stop may be the support line of the ascending channel.BTC/USDT 4-hour chart. Source: TradingViewThe 4-hour chart shows that the rebound off the $42,594 support fizzled out at the 20-EMA. This indicates selling by the bears at higher levels.The 20-EMA is sloping down and the relative strength index (RSI) is in the negative zone, indicating advantage to sellers.If the price turns down and breaks below $42,000, the selling could intensify. The pair could then drop to $40,000 where the buyers may again attempt to arrest the decline.Alternatively, a break and close above the 20-EMA could open the doors for a possible recovery to the 50-SMA. The bulls will have to push and sustain the price above $45,400 to gain the upper hand.NEAR/USDTNear Protocol (NEAR) turned down sharply from the stiff overhead resistance at $20 on April 8 and the long wick on the day’s candlestick suggests that bears are aggressively defending the overhead resistance.NEAR/USDT daily chart. Source: TradingViewThe NEAR/USDT pair could drop to the 20-day EMA ($15), which could act as a strong support. If the price rebounds off this level, it will suggest that bulls continue to buy on dips. The bulls will then make one more attempt to push the pair to a new all-time high. The rising 20-day EMA and the RSI in the positive territory suggest advantage to buyers.Contrary to this assumption, if the price plummets below the 20-day EMA, it will suggest that traders may be booking profits aggressively. That could open the doors for a possible drop to the 50-day SMA ($12).NEAR/USDT 4-hour chart. Source: TradingViewThe 4-hour chart shows that the price has repeatedly bounced from just below the 50-SMA. This indicates that buyers continue to accumulate on dips. If the price turns up from the current level and rises above the 20-EMA, the bulls will again try to push the price toward $20.Conversely, if the price turns down and sustains below $16, the short-term traders may rush to the exit. That could pull the pair toward $14.50. If this level cracks, it will suggest that bears are back in the driver’s seat.FTT/USDTFTX Token (FTT) broke and closed above $49 on March 24 but the bulls could not flip the level into support during the retest. The price slipped below the 200-day SMA ($47) and has reached the 50-day SMA ($45).FTT/USDT daily chart. Source: TradingViewA minor positive is that the buyers are attempting to defend the 50-day SMA. If the bulls push the price back above the 200-day SMA and the overhead resistance at $49, it will suggest strong buying at lower levels.The bullish momentum could pick up on a break and close above $54. The FTT/USDT pair could then rally to the pattern target at $66.Conversely, if the price fails to break above the 200-day SMA, the possibility of a break below the uptrend line of the triangle increases. If that happens, the pair could drop to $40 and later to $37.FTT/USDT 4-hour chart. Source: TradingViewThe 4-hour chart shows that the pair has been falling inside a descending channel pattern. Although the bears pulled the price below the support line of the channel, they could not sustain the lower levels. This suggests that the break below the channel may have been a bear trap.If bulls push and sustain the price above the 20-EMA, the pair could rise to the 50-SMA. This level could again act as a resistance but if the bulls overcome it, the next stop could be the downtrend line. A break and close above this barrier could signal a possible change in trend.This positive view will invalidate if the price turns down from the current level and plummets below $44. Related: Monero defies crypto market slump with 10% XMR price rally — what’s next?ETC/USDTEthereum Classic (ETC) formed a double bottom pattern when it broke and closed above the overhead resistance at $38. The price then rallied to the pattern target at $52 on March 29 where profit-booking set in. This pulled the price to the breakout level at $38.ETC/USDT daily chart. Source: TradingViewThe buyers will try to flip the breakout level at $38 into support. If they succeed, it will suggest a change in sentiment from selling on rallies to buying on dips. If the price rises from the current level or rebounds off $38 and breaks above $45, it will suggest that the correction may be over. The buyers will then again try to push the ETC/USDT pair to $53. A break and close above this level will signal the resumption of the up-move.This positive view will invalidate if the price continues lower and plummets below the 50-day SMA ($35). ETC/USDT 4-hour chart. Source: TradingViewThe 4-hour chart shows that the pair rebounded off the $38 level with strength but the bulls are struggling to sustain the price above the 20-EMA. This indicates that bears are selling at higher levels.A minor positive has been that the bulls have not given up much ground from the 20-EMA. This increases the possibility of a break above this resistance. If that happens, the price could rise to the 50-SMA. A break and close above this resistance could open the doors for a possible up-move to $48 and then to $53.Contrary to this assumption, if the price breaks below $38, the selling could intensify and the pair could drop to $32.XMR/USDTMonero (XMR) signaled a potential trend change when it broke and closed above the downtrend line. Although the bears tried to pull the price back below the downtrend line, the bulls did not relent.XMR/USDT daily chart. Source: TradingViewThe bears are attempting to stall the rally at the immediate resistance at $239 but the long tail on today’s candlestick shows buying at lower levels. The upsloping 20-day EMA ($216) and the RSI in the positive territory indicate advantage to buyers.If buyers sustain the price above $239, the XMR/USDT could further pick up momentum and rally to $255. On the other hand, if the price turns down from the current level, it will suggest that bears are aggressively defending the overhead resistance at $239. A break and close below the 20-day EMA will be the first sign that the bullish momentum may be weakening. The pair could then drop to the 50-day SMA ($190).XMR/USDT 4-hour chart. Source: TradingViewThe pair has been in a gradual uptrend for the past few days. The failure by the bulls to sustain the price above $239 attracted profit-booking from short-term traders but the bears could not pull the pair below the 20-EMA. This suggests strong buying at lower levels.If buyers drive and sustain the price above $239, the up-move may accelerate. Alternatively, if the price once again turns down from $239, the pair may drop to $209 and remain range-bound between these two levels for a few days.The views and opinions expressed here are solely those of the author and do not necessarily reflect the views of Cointelegraph. Every investment and trading move involves risk, you should conduct your own research when making a decision.

Čítaj viac

Price analysis 4/8: BTC, ETH, BNB, SOL, XRP, ADA, LUNA, AVAX, DOT, DOGE

Bitcoin (BTC) and most major altcoins are attempting to defend the immediate support levels, indicating that bears sense an opportunity and are looking to take control of the price action.The short-term price action does not seem to worry the long-term Bitcoin bulls who expect a massive return in the next few years. While speaking at the Bitcoin 2022 conference in Miami, ARK Invest CEO Cathie Wood reiterated her Bitcoin price target of $1 million by 2030.Meanwhile, telecom billionaire Ricardo Salinas said during the conference that BTC and Bitcoin equities form 60% of his liquid investment portfolio. That is a massive increase from his Bitcoin exposure in 2020, which formed just 10% of his liquid assets.Daily cryptocurrency market performance. Source: Coin360While the long-term may be positive, Bitcoin could remain under pressure in the short term due to the strength of the U.S. dollar. The rising rates and the tapering of the balance sheet have boosted the U.S. dollar currency index (DXY) to above 100 for the first time since May 2020. Could Bitcoin break below the critical support levels or will buyers stage a strong recovery? Let’s study the charts of the top-10 cryptocurrencies to find out.BTC/USDTBitcoin plunged to the critical support at $42,594 on April 7 but a positive sign is that bulls held this level. The long tail on April 8’s candlestick suggests that bulls continue to defend the level with vigor.BTC/USDT daily chart. Source: TradingViewThe moving averages have flattened out and the relative strength index (RSI) is near the midpoint, suggesting a balance between supply and demand.The bulls will now try to push the price above the 20-day exponential moving average (EMA) ($44,314) and the critical overhead resistance at $45,400. If they manage to do that, the BTC/USDT pair could challenge the 200-day simple moving average (SMA) ($48,220).Contrary to this assumption, if the price turns down from the 20-day EMA or $45,400, it will suggest that bears are selling on every rise. The bears will then try to pull the pair below the 50-day SMA ($41,789). If they succeed, the decline could extend to the support line of the ascending channel.ETH/USDTEther (ETH) broke below the 20-day EMA ($3,224) on April 6 but the bears could not sustain the lower levels. The bulls bought the dip and have pushed the price back above the 20-day EMA, indicating strong demand at lower levels.ETH/USDT daily chart. Source: TradingViewIf buyers sustain the price above the 20-day EMA, the ETH/USDT pair could again rise to the 200-day SMA ($3,487). A break and close above this resistance will suggest the start of a new uptrend. The pair could then rise to $4,150.Alternatively, if the bulls fail to drive the price above the 200-day SMA, it will suggest that bears are holding their ground at higher levels. The pair could then oscillate between the 200-day SMA and the 20-day EMA for a few days.A break and close below $3,100 could open the doors for a possible drop to the 50-day SMA ($2,915).BNB/USDTBNB broke and closed below the 20-day EMA ($425) on April 4 but the lower levels attracted strong buying from the bulls. The price rebounded sharply and broke above the overhead resistance at $445 on April 7 but the long wick on the day’s candlestick suggests that bears are selling on rallies.BNB/USDT daily chart. Source: TradingViewIf the price breaks below the 20-day EMA, the possibility of a drop to the 50-day SMA ($399) increases. The flattish moving averages and the RSI near the midpoint suggest that the bullish momentum has weakened. A break below the 50-day SMA will bring the large range between $350 and $445 into play.On the other hand, if the price rebounds off the 50-day SMA, the bulls will again attempt to push the BNB/USDT pair toward the 200-day SMA ($468). The pair could then trade between these two moving averages for a few days.SOL/USDTThe bulls stalled the decline at the 20-day EMA ($114) on April 6 but could not push Solana (SOL) back above the overhead resistance at $122. This suggests that bears are active at higher levels.SOL/USDT daily chart. Source: TradingViewIf the price continues lower and breaks below the 20-day EMA, the next stop could be $106. If this level also fails to hold, the SOL/USDT pair may drop to the 50-day SMA ($97). Such a move will suggest that the pair may remain stuck in a range between $81 and $122 for a few days.Contrary to this assumption, if the price turns up from the current level and breaks above $122, the bulls will make one more attempt to overcome the barrier at the 200-day SMA ($149).XRP/USDTRipple (XRP) broke and closed below the 50-day SMA ($0.78) on April 6, indicating that bears are making a comeback. The bulls tried to push the price back above the 50-day SMA but the bears are not willing to relent.XRP/USDT daily chart. Source: TradingViewThe 20-day EMA ($0.81) has started to turn down and the RSI is in the negative territory, indicating an advantage to the sellers. If the price remains below the 50-day SMA, the bears will attempt to extend the decline by pulling the XRP/USDT pair below $0.75. If they do that, the next stop could be $0.70.Contrary to this assumption, if the price turns up from the current level, the bulls will try to push the pair to the 200-day SMA ($0.88). ADA/USDT Cardano (ADA) broke and closed below the 20-day EMA ($1.08) on April 6. The bulls bought the dip but are struggling to push the price back above the 20-day EMA. ADA/USDT daily chart. Source: TradingViewIf the price fails to break and sustain above the 20-day EMA, the bears will attempt to sink the ADA/USDT pair below the 50-day SMA ($0.96). If they manage to do that, the pair could decline to the strong support at $0.74.Alternatively, if the price rises and sustains above the 20-day EMA, the bulls will attempt to clear the overhead hurdle at $1.26. Such a move will complete a cup and handle pattern, signaling the start of a possible new uptrend. The pair could first rise to the 200-day SMA ($1.45) and then rally to $1.60.LUNA/USDTTerra’s LUNA token is correcting in an uptrend. The price attempted a rebound off the 20-day EMA ($102) but the bears continue to sell at higher levels. That pulled the price below the 20-day EMA on April 8.LUNA/USDT daily chart. Source: TradingViewThe flattening 20-day EMA and the RSI near the midpoint suggest that the bulls are losing their grip. If the price sustains below the 20-day EMA, the selling could accelerate and the LUNA/USDT pair could drop to the 50-day SMA ($88). The bulls are expected to defend this level but if they fail in their endeavor, the next stop could be $82.Conversely, if the price turns up from the current level and rises above the 20-day EMA, it will suggest that bulls continue to buy on dips. The pair will then again attempt to break above the all-time high of $119 and resume the uptrend.Related: Near Protocol eyes a Terra-like price rally after new $350M funding raiseAVAX/USDTAvalanche (AVAX) plunged below the 20-day EMA ($89) and the 200-day SMA ($84) on April 6 but the bulls successfully defended the 50-day SMA ($82). This indicates that traders continue to accumulate on dips.AVAX/USDT daily chart. Source: TradingViewThe buyers will now try to push and sustain the price above the 20-day EMA. If they succeed, the AVAX/USDT pair could rise to the overhead resistance at $99. This is an important level to keep an eye on because a break and close above it could open the doors for a possible rally to $117 and next to $127.Alternatively, if the price turns down from the current level or the overhead resistance and breaks below the 50-day SMA, the pair could plunge to the strong support at $65. The flattish moving averages and the RSI near the midpoint do not give a clear advantage either to the bulls or the bears.DOT/USDTAfter the sharp reversal from $23, Polkadot (DOT) is currently attempting to stay above the 50-day SMA ($19). If buyers push the price above the 20-day EMA ($21), a retest of the overhead resistance is likely.DOT/USDT daily chart. Source: TradingViewThe flattish moving averages and the RSI just below the midpoint signal a possible range-bound action in the short term. If the price turns down from the 20-day EMA and plummets below the 50-day SMA, the selling could intensify and the DOT/USDT pair could drop to the strong support at $16.The bulls will have to clear the hurdle at $23 to indicate the start of a potential new uptrend. A close above $23 could clear the path for a possible up-move to the 200-day SMA ($29).DOGE/USDTDogecoin (DOGE) plunged sharply from the overhead resistance at $0.17 on April 6 but a positive sign is that the bulls held the support at the 20-day EMA ($0.14).DOGE/USDT daily chart. Source: TradingViewThe 20-day EMA continues to slope up gradually and the RSI is in the positive territory, indicating a minor advantage to buyers. The bulls will once again attempt to push the DOGE/USDT pair above the 200-day SMA ($0.18). If they succeed, the pair could start an up-move to $0.22.On the contrary, a shallow bounce will suggest weak demand. The bears will then try to sink the price below the moving averages and challenge the strong support at $0.10.The views and opinions expressed here are solely those of the author and do not necessarily reflect the views of Cointelegraph. Every investment and trading move involves risk. You should conduct your own research when making a decision.Market data is provided by HitBTC exchange.

Čítaj viac

Price analysis 4/6: BTC, ETH, BNB, SOL, XRP, ADA, LUNA, AVAX, DOT, DOGE

Bitcoin (BTC), the entire crypto sector and the S&P 500 index are correcting on April 6, which highlights the tight correlation between the two sectors.Despite the weakness, institutional investors do not seem to be halting their purchases, suggesting that they remain bullish in the long term. Terra used the dip to buy an additional 5,040 Bitcoin, which takes its total holdings to 35,768 Bitcoin. Terra was not alone in this venture. MicroStrategy, the treasury with the largest Bitcoin reserves, also increased its holdings by 4,197 Bitcoin through its subsidiary MacroStrategy. After the latest purchase, the business intelligence firm holds 129,218 Bitcoin.Daily cryptocurrency market performance. Source: Coin360Another sign of a strong appetite for Bitcoin is seen in the inflows to the two Canadian Bitcoin exchange-traded funds. According to Glassnode data, the funds boosted their holdings to an all-time high of 69,052 Bitcoin, an increase of 6,594 since January. Could Bitcoin and altcoins enter a deeper correction or will lower levels attract buying? Let’s study the charts of the top-10 cryptocurrencies to find out.BTC/USDTAfter staying in a tight range between the 200-day simple moving average (SMA) ($48,240) and $45,000 for the past few days, the bears made their move and pulled the price below the 20-day exponential moving average (EMA) ($44,567).BTC/USDT daily chart. Source: TradingViewThe relative strength index (RSI) has dipped to the midpoint and the 20-day EMA is flattening out. This suggests that the bullish momentum could be weakening. If the price rebounds off the 50-day SMA ($41,752), the bulls will again attempt to push the BTC/USDT pair above the 200-day SMA.Conversely, if the bears sink the price below the 50-day SMA, it will signal that the pair could extend its stay inside the ascending channel. The pair could then gradually drop toward the strong support at $37,000.ETH/USDTThe failure of the bulls to sustain the price of Ether (ETH) above the 200-day SMA ($3,487) may have resulted in profit-booking by short-term traders. That has pulled the price to the critical support at the 20-day EMA ($3,223).ETH/USDT daily chart. Source: TradingViewIf the price rebounds off the 20-day EMA, it will suggest that bulls are buying on dips. The bulls will then make another attempt to push and sustain the price above the 200-day SMA. If they succeed, the ETH/USDT pair could start its northward march toward $4,150 where the bears are expected to mount a strong defense.Contrary to this assumption, if the bears sink the price below the 20-day EMA, the selling could pick up momentum and the pair may drop to the 50-day SMA ($2,907).BNB/USDTBNB once again failed to break above the 200-day SMA ($468) on April 5. The long wick on the day’s candlestick showed that the bears are defending the 200-day SMA with all their might.BNB/USDT daily chart. Source: TradingViewThe BNB/USDT pair has dipped to the 20-day EMA ($424). The bears will now attempt to sink and sustain the price below the 20-day EMA. If they succeed, the pair could extend its decline to the 50-day SMA ($398). A strong rebound off this level will suggest that the pair may remain range-bound between the 200-day and 50-day SMAs.Conversely, if the price rebounds off the 20-day EMA, the bulls will attempt to drive the pair above the 200-day SMA and challenge the resistance at $500.SOL/USDTSolana’s (SOL) recovery stalled on April 2 and the price has dipped below the breakout level at $122. The bulls are expected to defend the 20-day EMA ($113) with vigor.SOL/USDT daily chart. Source: TradingViewA strong bounce off the 20-day EMA will suggest that the sentiment remains positive and traders are buying on dips. The bulls will then attempt to push the price above the overhead hurdle at the 200-day SMA ($149). Alternatively, a break and close below the 20-day EMA will suggest that the bullish momentum has weakened. The pair could then drop to the 50-day SMA ($96). A strong rebound off this level could keep the pair stuck between the 50-day and the 200-day SMAs.XRP/USDTRipple (XRP) turned down and slipped below the 20-day EMA ($0.81) on April 5. The selling continued today and the price broke below the 50-day SMA ($0.78).XRP/USDT daily chart. Source: TradingViewThe RSI has dropped into the negative territory and the 20-day EMA has started to slope down, suggesting that bears have a slight edge. If the price sustains below the 50-day SMA, the XRP/USDT pair could drop to $0.70. This is an important level for the bulls to defend because if it gives way, the decline could extend to $0.60.On the contrary, if the price turns up from the current level and rises above the 20-day EMA, the bulls will attempt to propel the pair above the 200-day SMA ($0.89).ADA/USDT The failure of the bears to propel Cardano (ADA) above the overhead resistance at $1.26 may have tempted short-term traders to book profits. That has pulled the price below the 20-day EMA ($1.09).ADA/USDT daily chart. Source: TradingViewIf the price breaks below the 20-day EMA, the pair could drop to the 50-day SMA ($0.96). The bulls are likely to defend this level aggressively but if the bears overpower them, the ADA/USDT pair could drop to the strong support at $0.74. A strong rebound off this level will suggest that the pair may consolidate between $0.74 and $1.26 for some time.Alternatively, if the price rises from the current level, the bulls will again attempt to drive the pair above the overhead resistance. If they succeed, the ADA/USDT pair could rally to the 200-day SMA ($1.47).LUNA/USDTTerra’s LUNA token had been in a strong uptrend but the Doji candlestick pattern on April 5 cautioned that the bullish momentum could be weakening. The negative divergence on the RSI also suggested that the bulls may be losing their grip.LUNA/USDT daily chart. Source: TradingViewThe uncertainty of the Doji candlestick pattern resolved to the downside on April 6. The bears will now try and pull the price to the 20-day EMA ($102). This is an important level for the bulls to defend because a strong rebound off it will suggest that the sentiment remains bullish and traders are buying on dips.Conversely, if the price breaks below the 20-day EMA, the selling could intensify as traders rush to the exit. That may sink the LUNA/USDT pair to the 50-day SMA ($86).Related: Bitcoin slides below $44K in April first as trader warns ‘something is off’ with BTCAVAX/USDTThe bulls purchased the dip to the 20-day EMA ($89) on April 4 but they could not push Avalanche (AVAX) above the overhead resistance at $98. This suggests that bears continue to defend the overhead resistance aggressively.AVAX/USDT daily chart. Source: TradingViewThe 20-day EMA is flattening out and the RSI has dropped into the negative zone, indicating that bears have a slight edge. If the price breaks below the 50-day SMA ($82), the AVAX/USDT pair could drop to the next major support at $65. A bounce off this level will suggest that the pair may remain range-bound between $65 and $98 for a few more days.Conversely, if the price turns up from the current level, the bulls will make another attempt to climb above the overhead zone between $98 and $100. DOT/USDTPolkadot (DOT) rebounded off the 20-day EMA ($21) on April 4 but the bulls could not overcome the barrier at $23. This may have tempted short-term traders to book profits.DOT/USDT daily chart. Source: TradingViewThe DOT/USDT pair plunged below the 20-day EMA on April 6 and the RSI entered negative territory. This suggests that the bulls are losing their grip. The next stop could be the 50-day SMA ($19). The bulls are likely to defend this level with vigor but if the support cracks, the decline could extend to $16.Alternatively, a strong rebound off the 50-day SMA could suggest that the pair may consolidate between $19 and $23 for a few days. The bulls will have to push and sustain the price above $23 to signal the start of a potential new uptrend.DOGE/USDTDogecoin (DOGE) soared above the overhead resistance at $0.17 on April 5 but the bulls could not clear the hurdle at the 200-day SMA ($0.18). This may have attracted profit-booking by the short-term bulls and selling by the aggressive bears, resulting in the sharp reversal on April 6.DOGE/USDT daily chart. Source: TradingViewThe DOGE/USDT pair is likely to retest the 20-day EMA ($0.14). If the price rebounds off this level, it will suggest that bulls continue to buy on dips. The buyers will then again try to clear the overhead hurdle at the 200-day SMA.This positive view will invalidate if the price continues lower and breaks below the 20-day EMA. Such a move could open the doors for a possible drop to $0.12. The pair could then remain stuck between $0.10 and $0.18 for a few more days.The views and opinions expressed here are solely those of the author and do not necessarily reflect the views of Cointelegraph. Every investment and trading move involves risk. You should conduct your own research when making a decision.Market data is provided by HitBTC exchange.

Čítaj viac

Price analysis 4/4: BTC, ETH, BNB, SOL, XRP, ADA, LUNA, AVAX, DOT, DOGE

Bitcoin (BTC) has been stuck between $45,400 and $47,500 for the past two days, indicating a tough tussle between the buyers and sellers as both attempt to establish control over the trend.Data from on-chain analytics firm Glassnode showed that 100,000 Bitcoin left exchanges in March. These large quantities of withdrawals have only happened twice in the history of Bitcoin with the largest being in March 2020. However, this does not mean the price will rally immediately. In 2020, the momentum picked up only by the fourth quarter of the year.For the near term, analysts remain divided with some expecting Bitcoin to drop to $44,800 or even to $43,000 while others anticipate a rally to the psychological level at $50,000.Daily cryptocurrency market performance. Source: Coin360As the crypto markets mature, they continue to attract new investors. A report by Gemini crypto exchange highlighted that the number of users who purchased their first cryptocurrency in 2021 soared by more than 50% in India, Brazil and Hong Kong. Even Latin America, Asia Pacific, the United States and Europe witnessed more than 40% new users who started investing in 2021. Could Bitcoin and altcoins bounce off their support and extend the recovery? Let’s study the charts of the top-10 cryptocurrencies to find out.BTC/USDTThe long wick on the candlestick of the past two days suggests that bears are selling near the 200-day simple moving average ($48,266). A minor positive has been that the bulls have not allowed Bitcoin to break below the important support at $45,400.BTC/USDT daily chart. Source: TradingViewHowever, this tight-range trading is unlikely to continue for long. If the price breaks below the 20-day exponential moving average ($44,467), the BTC/USDT pair could drop to the 50-day SMA ($41,689). Such a move could invalidate the short-term bullish setup. Conversely, if the price rises from the current level or the 20-day EMA, it will suggest that traders continue to buy on dips. That could enhance the prospects of a break above the 200-day SMA. If that happens, the pair could rally to $52,000.ETH/USDTEther (ETH) broke and closed above the 200-day SMA ($3,487) on April 3 but the bulls could not sustain the higher levels. This suggests that the bears are trying to pull the price lower and trap the aggressive bulls.ETH/USDT daily chart. Source: TradingViewIf the price breaks below $3,411, the bears will try to pull the ETH/USDT pair to the 20-day EMA ($3,197). This is an important level for the bulls to defend if they want the positive momentum to remain intact.If the price rebounds off the 20-day EMA, the buyers will again try to thrust and sustain the price above the 200-day SMA. If they manage to do that, the pair could rally to $4,000.On the other hand, if the 20-day EMA support gives way, the selling could intensify and the pair may drop to the 50-day SMA ($2,895).BNB/USDTBinance Coin (BNB) has been trading close to the $445 level for the past few days. Although the bulls pushed the price above this level repeatedly, they could not sustain the higher levels and challenge the 200-day SMA ($467). This indicates that demand dries up at higher levels.BNB/USDT daily chart. Source: TradingViewThe bears will now try to pull the price to the 20-day EMA ($421) which is an important support to watch out for. If the price rebounds off this level, the buyers will make one more attempt to clear the overhead hurdle and push the BNB/USDT pair to $500.Alternatively, if the price breaks below the 20-day EMA, it will suggest that the short-term traders may be booking profits. That could pull the price to the 50-day SMA. A break below this support will suggest that the break above $445 may have been a bull trap.SOL/USDTSolana’s (SOL) recovery stalled just below the 200-day SMA ($150). This suggests that higher levels are attracting selling by the bears. The bears will now try to pull the price to the breakout level at $122.SOL/USDT daily chart. Source: TradingViewIf the price rebounds off $122, the bulls will make another attempt to clear the overhead hurdle at the 200-day SMA. If they succeed, the SOL/USDT pair could rally toward the psychological level at $200. The rising 20-day EMA ($111) and the relative strength index (RSI) near the overbought zone indicate advantage to buyers.Contrary to this assumption, if bears sink the price below $122, the pair could drop to the 20-day EMA. This is an important support to keep an eye on because a break below it could result in a decline to the 50-day SMA ($96).XRP/USDTThe bulls attempted to push Ripple (XRP) above the overhead resistance at $0.86 but the bears did not budge. The failure to rise above $0.86 may attract profit-booking from short-term traders which could sink the price to the 50-day SMA ($0.78).XRP/USDT daily chart. Source: TradingViewIf the price once again bounces off the 50-day SMA, it will suggest that bulls are accumulating on dips. That could keep the XRP/USDT pair stuck between the 50-day SMA and the 200-day SMA ($0.89) for a few days.The flattish 20-day EMA ($0.82) and the RSI near the midpoint also suggest a consolidation in the near term. If bears pull the price below the 50-day SMA, the pair could plummet to $0.70. Alternatively, if buyers drive the price above the 200-day SMA, the pair could rally to the psychological level at $1.ADA/USDT Cardano (ADA) turned up on April 1 and has reached the overhead resistance at $1.26 where the bulls are likely to encounter strong resistance from the bears.ADA/USDT daily chart. Source: TradingViewThe upsloping 20-day EMA ($1.08) and the RSI near the overbought zone indicate that the path of least resistance is to the upside. If bulls push the price above $1.26, the ADA/USDT pair could rally to the 200-day SMA ($1.48) and then to $1.63.Conversely, if the price once again turns down from the overhead resistance, the pair could drop to the 20-day EMA. A break and close below this support could pull the price down to the psychological level at $1.LUNA/USDTTerra’s LUNA token broke out of the overhead resistance at $111 on April 2 and made a new all-time high at $118 on April 3. This suggests that the bulls are in the driver’s seat.LUNA/USDT daily chart. Source: TradingViewHowever, the negative divergence on the RSI warns that the bullish momentum may be weakening and the LUNA/USDT pair could witness a minor correction or consolidation.If the price slips below the 20-day EMA ($100), traders who may have bought at lower levels could book profits. That could pull the price down to the 50-day SMA ($84). Conversely, if the price rebounds off the 20-day EMA, it will suggest that the bulls continue to defend the level aggressively. The buyers will then try to push the pair above $118. If they succeed, the pair could rise to $125 and later march toward $150.Related: Neutrino Dollar breaks peg, falls to $0.82 amid WAVES price ‘manipulation’ accusationsAVAX/USDTAvalanche (AVAX) repeatedly broke above the overhead resistance at $98 in the past few days but the bulls could not sustain the higher levels. This indicates that bears are defending the level with vigor.AVAX/USDT daily chart. Source: TradingViewThe bears will now try to pull the price to the 20-day EMA ($89). This is an important level to watch out for because a strong rebound off it will suggest that the sentiment remains bullish and traders are buying on dips. That could increase the possibility of a break and close above the $98 to $100 resistance zone. If that happens, the AVAX/USDT pair could rally to $120.Contrary to this assumption, if the price continues lower and breaks below the 20-day EMA, the next stop could be the 50-day SMA ($82). The pair could then extend its range-bound action for a few more days.DOT/USDTPolkadot (DOT) broke and closed above the overhead resistance at $23 on April 3 but the bulls could not sustain the higher levels. This suggests that the bears have not yet given up and are selling on every rise.DOT/USDT daily chart. Source: TradingViewThe bears are trying to sustain the price below $23 and trap the aggressive bulls who may have gone long on a breakout above the resistance. The critical level to watch on the downside is the 20-day EMA ($21).If this support cracks, the DOT/USDT pair could drop to $19. If the price rebounds off this level, the DOT/USDT pair could remain range-bound between $19 and $23 for a few days.Conversely, if the price turns up from the current level and breaks above $24, the pair could rally to the 200-day SMA ($29).DOGE/USDTDogecoin (DOGE) rebounded off the 20-day EMA ($0.13) on April 3, indicating that the bulls continue to defend this level aggressively. The rising 20-day EMA and the RSI in the positive zone indicate advantage to buyers.DOGE/USDT daily chart. Source: TradingViewThe buying continued today and the bulls attempted to resume the up-move toward the overhead resistance zone between $0.17 and the 200-day SMA ($0.18) but the long wick on the candlestick suggests that bears are selling at higher levels.If the price continues lower and breaks below the 20-day EMA, it will suggest that the DOGE/USDT pair could remain range-bound between $0.10 and $0.17 for a few more days. The bulls will have to propel and sustain the price above the 200-day SMA to signal a potential change in trend.The views and opinions expressed here are solely those of the author and do not necessarily reflect the views of Cointelegraph. Every investment and trading move involves risk. You should conduct your own research when making a decision.Market data is provided by HitBTC exchange.

Čítaj viac

Získaj BONUS 8 € v Bitcoinoch

nakup bitcoin z karty

Registrácia Binance

Burza Binance

Aktuálne kurzy