Autor Cointelegraph By Rakesh Upadhyay

Price analysis 4/20: BTC, ETH, BNB, XRP, SOL, ADA, LUNA, AVAX, DOGE, DOT

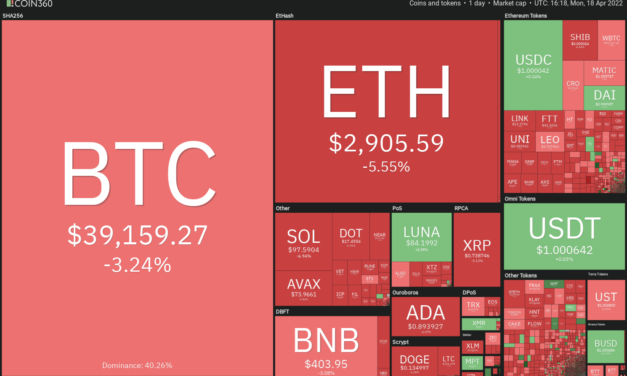
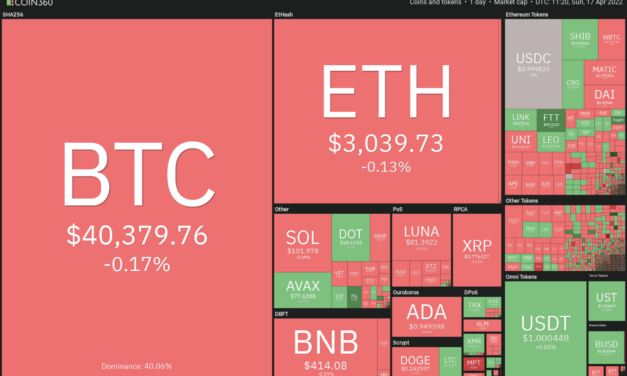
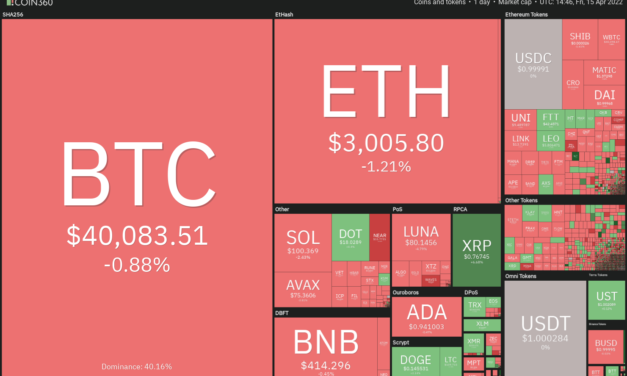
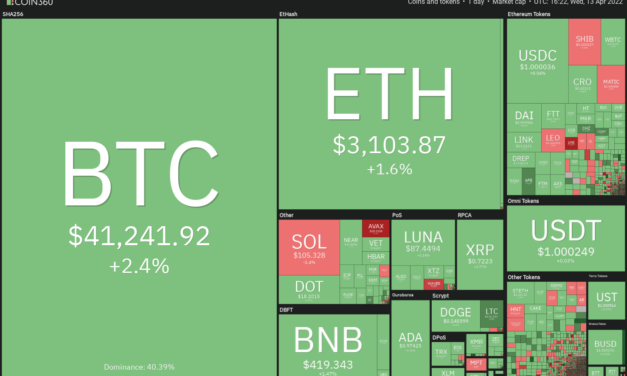
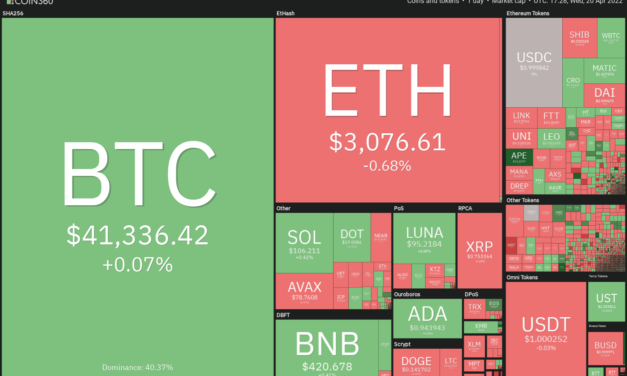
The U.S. dollar currency index (DXY) turned down sharply after rising above 101 on April 20 but this weakness in the dollar has not helped Bitcoin (BTC), possibly because the S&P 500 is struggling to build upon its strong rally on April 19. This indicates that Bitcoin remains tightly correlated with the U.S. equity markets.Irrespective of the lackluster price action, research projects several positives for Bitcoin this year. A report by Insider Intelligence shows that the number of adult crypto users in the U.S. could surge from 28.3 million in 2021 to 33.7 million in 2022. Along with the growth in the number of crypto users, the firm also expects the use of cryptocurrencies to make purchases by U.S. adults to increase to 3.6 million, a growth of 70 percent this yearDaily cryptocurrency market performance. Source: Coin360In another positive sign which could lead to increased adoption, Australian financial regulators have approved the first Bitcoin exchange-traded fund which will begin trading on April 27. The Australian Financial Review expects the fund to attract about $1 billion in inflows.Could the higher levels in Bitcoin and select altcoins continue to attract selling by the bears? Let’s study the charts of the top-10 cryptocurrencies to find out.BTC/USDTBitcoin turned around sharply from $38,536 on April 18, indicating strong buying at lower levels. The buyers continued their purchase and pushed the price to the 50-day simple moving average ($42,104).BTC/USDT daily chart. Source: TradingViewThe 20-day exponential moving average ($41,811) has flattened out and the relative strength index (RSI) is just below the midpoint, suggesting a balance between supply and demand.This equilibrium could tilt in favor of the buyers if the price rises and sustains above the 50-day SMA. That will increase the possibility of an up-move to $43,900. If bulls manage to overcome this barrier, the momentum may pick up and the BTC/USDT pair could rally to the 200-day SMA ($48,052).Contrary to this assumption, if the price turns down sharply from the current level, it will suggest that bears are active at higher levels. The sellers will then attempt to pull the pair to the support line of the ascending channel.ETH/USDTEther (ETH) broke below the 50-day SMA (3,000) on April 18 but the bears could not sustain the lower levels. The bulls purchased the dip and pushed the price back above the 50-day SMA.ETH/USDT daily chart. Source: TradingViewThe buyers drove the price above the 20-day EMA ($3,113) today but the long wick on the day’s candlestick suggests that bears continue to sell at higher levels. The bears are currently attempting to sustain the price below the 20-day EMA.If they succeed, the ETH/USDT pair could consolidate in a tight range between $2,883 and $3,166. This tight range trading is unlikely to continue for long and may result in a sharp range expansion within the next few days.A break below $2,883 could sink the pair to the uptrend line while a break above $3,166 could clear the path for a possible retest of the 200-day SMA ($3,491).BNB/USDTThe bulls purchased the drop below the 50-day SMA ($408) on April 18, indicating strong demand at lower levels. Sustained buying pushed Binance Coin (BNB) above the 20-day EMA ($419) on April 19 but the bulls are struggling to sustain the momentum.BNB/USDT daily chart. Source: TradingViewThe flattish moving averages and the RSI just above the midpoint suggest a range-bound action in the near term. If the price turns down from the current level or the overhead resistance, the bears will again attempt to sink the BNB/USDT pair below the 50-day SMA. A break and close below $391 could result in a decline to the strong support at $350.Alternatively, if the price rebounds off the 20-day EMA ($419), the bulls will attempt to push the pair above the strong resistance at $445 and challenge the 200-day SMA ($471).XRP/USDTThe long tail on Ripple’s (XRP) April 18 candlestick suggests strong buying at lower levels. The price reached the 50-day SMA ($0.78) on April 19 but the bears are defending this level with vigor. XRP/USDT daily chart. Source: TradingViewIf the price turns down from the current level, it will suggest that the XRP/USDT pair could remain range-bound between the 50-day SMA and $0.69 for some time. A break and close below $0.69 could open the doors for a possible drop to $0.60.Conversely, if the price turns up, the bulls will try to push and sustain the pair above $0.80. If they manage to do that, the pair could rise toward the overhead zone between the 200-day SMA ($0.87) and $0.91. The flat moving averages and the RSI near the midpoint do not give a clear advantage either to the bulls or the bears.SOL/USDTSolana (SOL) bounced off the support line of the ascending channel on April 18, indicating that the bulls are buying the dips to this level. The bulls pushed the price above the 20-day EMA ($107) on April 19 but are struggling to sustain the higher levels.SOL/USDT daily chart. Source: TradingViewThis suggests that the bears continue to sell on every minor rally. If the price breaks below the 50-day SMA ($101), the bears will make another attempt to sink the SOL/USDT pair below the ascending channel and retest the critical support at $75.Conversely, if the price rises from the current level, the bulls will attempt to challenge the overhead resistance at $122. A break and close above this level could open the doors for a potential rally to the 200-day SMA ($147).ADA/USDT Cardano (ADA) broke below the immediate support at $0.91 on April 18 but the bears could not keep the price down. This suggests that the bulls are attempting to form a higher low.ADA/USDT daily chart. Source: TradingViewIf buyers propel the price above the psychological level at $1, the bullish momentum could pick up. The ADA/USDT pair could then rally to $1.10 and later retest the critical resistance at $1.26. A break and close above this level will suggest the start of a new uptrend.Alternatively, if the price turns down from the overhead resistance, the bears will again attempt to pull the pair down. The pair could first drop to $0.87 and if this level cracks, the decline may extend to the strong support at $0.74.LUNA/USDTTerra’s LUNA token bounced off the strong support at $75 and reached the 20-day EMA ($91) on April 18. This suggests that the sentiment remains positive and traders are buying on dips.LUNA/USDT daily chart. Source: TradingViewThe relief rally continued on April 19 and the buyers pushed the price above the 50-day SMA ($93). The bulls will attempt to sustain the momentum and drive the LUNA/USDT pair to the psychological level at $100. If bulls clear this hurdle, the possibility of a retest of the all-time high increases.Conversely, if the price turns down from the current level or $100, the bears will try to pull the pair below the 20-day EMA. If they succeed, it will suggest that traders may be booking profits on rallies. That could result in a range formation for a few days.Related: BTC and ETH will break all-time highs in 2022 — Celsius CEOAVAX/USDTAvalanche (AVAX) dipped below the uptrend line on April 18 but the bears could not sustain the lower levels. Strong buying by the bulls ensured a recovery and the price reached the moving averages.AVAX/USDT daily chart. Source: TradingViewThe bears are mounting a stiff resistance at the moving averages. If the price continues lower, the bears will again try to sink and sustain the AVAX/USDT pair below the uptrend line. If they succeed, the decline could extend to $65.Contrary to this assumption, if the price turns up and breaks above the moving averages, it will suggest strong demand by the bulls. That could open the doors for a possible rally to $99. The bulls will have to overcome this barrier to signal the formation of an ascending triangle pattern.DOGE/USDTDogecoin (DOGE) once again rebounded off the 50-day SMA ($0.13) on April 18, suggesting that the bulls are defending the level aggressively. DOGE/USDT daily chart. Source: TradingViewThe rebound rose above the 20-day EMA ($0.14) on April 19 but the bulls are struggling to sustain the higher levels. This suggests that the bears are selling on rallies to the immediate resistance at $0.15. If the price slips back below the 20-day EMA, the bears will again try to sink the DOGE/USDT pair below the 50-day SMA. If they succeed, the pair could slide to $0.12.Conversely, if the price turns up from the current level and breaks above $0.15, the bulls will attempt to push the pair above the neckline. If they succeed, the pair will complete an inverse head and shoulders pattern, which has a pattern target at $0.25.DOT/USDTPolkadot (DOT) turned up on April 18 indicating that bulls are defending the immediate support at $17. The price has reached the moving averages which may act as a stiff hurdle.DOT/USDT daily chart. Source: TradingViewThe 20-day EMA ($19.15) and the 50-day SMA ($19.31) are flat and close to one another while the RSI is just below the midpoint, suggesting a balance between supply and demand.This balance could tilt in favor of the buyers if the DOT/USDT pair breaks and sustains above the 50-day SMA. The pair will then attempt to rally to the strong overhead resistance at $23.Conversely, if the price turns down from the current level, the bears will again attempt to pull the pair to the immediate support at $17 and then to $16.The views and opinions expressed here are solely those of the author and do not necessarily reflect the views of Cointelegraph. Every investment and trading move involves risk. You should conduct your own research when making a decision.Market data is provided by HitBTC exchange.

Čítaj viac

Price analysis 4/18: BTC, ETH, BNB, XRP, SOL, ADA, LUNA, AVAX, DOGE, DOT

Bitcoin (BTC) and most major altcoins have started the new week on a soft note and the Crypto Fear and Greed Index has dropped into the “extreme fear” zone, suggesting that investors are still nervous.Bitcoin has declined about 17% year-to-date while the Nasdaq 100 has dropped about 16% during the same period, indicating a tight correlation between the two. In comparison, gold has risen more than 10% in 2022 and its 50-day correlation coefficient with Bitcoin “is around minus 0.4, the lowest since 2018,” according to journalist Colin Wu.Daily cryptocurrency market performance. Source: Coin360Although the crypto price action has remained bearish, the declining balance of Bitcoin on the crypto exchanges indicates that long-term investors are unperturbed and continue to accumulate at every available opportunity. Data from on-chain analytics firm CryptoQuant suggests that the Bitcoin balance of 21 major exchanges dropped to its lowest level since July 2018 at 2.274 million Bitcoin as of April 17.Could buying emerge at lower levels or will bears build upon their advantage and sink prices lower? Let’s study the charts of the top-10 cryptocurrencies to find out.BTC/USDTBitcoin has been trading inside an ascending channel pattern for the past several days. The bulls defended the psychological level at $40,000 for the past few days but could not achieve a strong rebound off it. This suggests that demand dries up at higher levels.BTC/USDT daily chart. Source: TradingViewThe bears pulled the price below the immediate support at $39,200 on April 18 but the long tail on the candlestick indicates bulls are buying at lower levels. If the price rises back above $40,000, the bulls will make one more attempt to clear the 50-day simple moving average (SMA) ($42,167). If they succeed, the pair could rise to $43,900 and later attempt a rally to the 200-day SMA ($48,109).Conversely, if the recovery falters at $40,000, it will suggest that bears have flipped this level into resistance. That will enhance the prospects of a drop to the support line of the channel. The bulls are expected to defend this level with all their might because a break below it could open the doors for a possible drop to $32,917.ETH/USDT Ether’s (ETH) tight range trading between the 20-day exponential moving average (EMA) ($3,103) and the 50-day SMA ($2,991) resolved to the downside on April 18. The bulls have pulled the price below the immediate support at $2,950.ETH/USDT daily chart. Source: TradingViewThe downsloping 20-day EMA and the relative strength index (RSI) below 40 indicate that bears are in control. If the price sustains below the 50-day SMA, the ETH/USDT pair could slide to $2,817 and then to the uptrend line.Contrary to this assumption, if the price turns up and rises above the 50-day SMA, it will suggest that the bulls are attempting to trap the aggressive bears. A break and close above $3,150 could suggest that the correction may be over.BNB/USDTBNB turned down from the 20-day EMA ($417) and broke below the 50-day SMA ($407) on April 18 but the long tail on the daily candlestick suggests buying at lower levels.BNB/USDT daily chart. Source: TradingViewThe bulls will attempt to trap the aggressive bears and push the BNB/USDT pair above the zone between the 20-day EMA and $427. If they manage to do that, the pair could start its northward march toward $445.Conversely, if the price turns down from the current level or the 20-day EMA, it will suggest that bears are active at higher levels. The sellers will then try to sink the price below $391 and challenge the strong support at $350.XRP/USDTThe failure of the bulls to sustain Ripple (XRP) above the 50-day SMA ($0.78) on April 16 could have attracted selling by traders who may have purchased at lower levels. The price turned down and broke below the 20-day EMA ($0.76) on April 17.XRP/USDT daily chart. Source: TradingViewIf the price sustains below the 20-day EMA, the bears will attempt to sink the XRP/USDT pair to the strong support at $0.69. This is an important level for the bulls to defend because if it cracks, the selling could intensify and the pair may drop to $0.60. The 20-day EMA has started to turn down and the RSI is in the negative territory, suggesting that bears have a slight advantage. This negative view will invalidate if the price turns up from the current level and breaks above $0.80. That could clear the path for a move to $0.85.SOL/USDTSolana (SOL) attempted to rise above the 20-day EMA ($106) on April 17 but the long wick on the day’s candlestick suggests that bears are selling on rallies to this level. The selling picked up momentum on April 18 and the bears have pulled the price below the 50-day SMA ($100).SOL/USDT daily chart. Source: TradingViewThe downsloping 20-day EMA and the RSI in the negative territory suggest that bears have the upper hand. If the price breaks below the support line of the ascending channel, the SOL/USDT pair could drop to $86 and thereafter to $75.Conversely, if the price rebounds off the support line of the channel, the buyers will again attempt to push the pair above the 20-day EMA. If they succeed, it will suggest that the bears may be losing their grip. The pair could then rise to $122.ADA/USDT Cardano (ADA) repeatedly tried to rise above the psychological level at $1 in the past few days but the bears held their ground. This suggests that the bears have successfully flipped the level into resistance.ADA/USDT daily chart. Source: TradingViewThe selling resumed on April 18 and the bears have pulled the price below the immediate support at $0.91. If the price sustains below this level, the ADA/USDT pair could decline to the critical level at $0.74. The bulls are expected to defend this level with all their might because if they fail in their endeavor, the downtrend could resume and the next stop may be $0.68. Contrary to this assumption, if the price rises from the current level and breaks above $1, it will suggest a lack of selling at lower levels. The pair could then rise to $1.10 and later to $1.26.LUNA/USDTTerra’s LUNA token sharply rebounded off the strong support at $75 on April 18, indicating aggressive buying at this level. The bulls will now attempt to push the price to the 20-day EMA ($90) where they are likely to encounter strong selling by the bears.LUNA/USDT daily chart. Source: TradingViewIf the price turns down from the 20-day EMA, it will increase the possibility of a break below the strong support at $75. If that happens, the pair could retest the critical support at the 200-day SMA ($67). This is an important level to keep an eye on because a break below it could accelerate selling.On the other hand, a break and close above the 20-day EMA will be the first sign that the correction may be over. The buyers will then attempt to propel the pair to the psychological level at $100.Related: Decred price soars 45% in one day three weeks before a major hard forkAVAX/USDTAvalanche (AVAX) bounced off the uptrend line on April 15 but the failure to push the price above the moving averages may have attracted selling by the short-term traders. That pulled the price below the uptrend line today.AVAX/USDT daily chart. Source: TradingViewIf the price sustains below the uptrend line, the ascending triangle pattern will invalidate and the AVAX/USDT pair could drop to $65. If the price rebounds off this support, the pair could remain range-bound between $65 and $99 for a few more days.The downsloping 20-day EMA ($81) and the RSI near 39 indicate that the path of least resistance is to the downside. Conversely, if the price rises and sustains above the uptrend line, it will suggest that the ascending triangle pattern remains intact. The bulls will then make one more attempt to push the price above the moving averages.DOGE/USDTDogecoin (DOGE) turned down from $0.15 on April 15 indicating a lack of buying at higher levels. The price dipped back below the 20-day EMA ($0.14) on April 17 and has reached the 50-day SMA ($0.13).DOGE/USDT daily chart. Source: TradingViewIf bears sink the price below the 50-day SMA, the DOGE/USDT pair could drop to the strong support at $0.12 and later to the psychological level at $0.10. The RSI has dipped into the negative zone, indicating a slight advantage to sellers.Alternatively, if the price rebounds off the current level and rises above $0.15, the pair could attempt a rally to the 200-day SMA ($0.18). A break and close above this level could signal the start of a new up-move.DOT/USDTPolkadot (DOT) turned down from the overhead resistance at $19 on April 17, indicating that bears are selling on rallies to this level. The bears will now attempt to sink the price to the strong support at $16.DOT/USDT daily chart. Source: TradingViewThe 20-day EMA ($19) is sloping down and the RSI is below 40, suggesting that the momentum favors the bears. A break and close below $16 will be a huge negative as that could open the doors for a possible drop to $14.On the contrary, if the price rebounds off $16, the bulls will again attempt to push the DOT/USDT pair above $19. If they manage to do that, the pair could continue its range-bound action between $16 and $23 for some more time.The views and opinions expressed here are solely those of the author and do not necessarily reflect the views of Cointelegraph. Every investment and trading move involves risk. You should conduct your own research when making a decision.Market data is provided by HitBTC exchange.

Čítaj viac

Top 5 cryptocurrencies to watch this week: BTC, XRP, LINK, BCH, FIL

Bitcoin (BTC) and most major altcoins have been relatively quiet during the holiday period from Good Friday onward. This suggests that cryptocurrency traders are not initiating large bets during the period when the U.S. equities markets are closed. That could be because of the tight correlation between Bitcoin and the S&P 500 and the uncertainty about the equity market’s performance in the next week.While some analysts expect weakness in the near term, others believe that Bitcoin could be in a consolidation phase with a large portion of its upside in the four-year halving cycle yet to come. Josh Olszewicz, head of research at alternative asset management firm Valkyrie, said: “Interesting. Maybe we never got the blow-off top…because it hasn’t happened yet.”Crypto market data daily view. Source: Coin360Although Bitcoin’s price action has been lackluster in the past few days, some altcoins, which found a place in Coinbase’s list of 50 crypto assets under consideration for listing, have witnessed strong trending moves. This suggests that the action has become more coin-specific while the broader crypto market awaits fresh triggers to start a trending move.Could Bitcoin and select altcoins start a directional move in the next few days? Let’s study the charts of the top-5 cryptocurrencies that may be showing early signs of a recovery.BTC/USDTBitcoin formed an inside-day candlestick pattern on April 16, indicating indecision among the bulls and the bears. Usually, small range days are followed by a range expansion but it is difficult to predict the direction beforehand. BTC/USDT daily chart. Source: TradingViewIf the price breaks above $41,000 the bulls will attempt to push the BTC/USDT pair above the 20-day exponential moving average ($42,085). If they succeed, the pair could start an up-move to the overhead resistance at the 200-day simple moving average ($48,136) and later to the resistance line of the ascending channel.The downsloping 20-day EMA and the relative strength index (RSI) in the negative territory indicate a minor advantage to bears.If the price turns down and breaks below $39,200, the selling could intensify. The pair could then plummet to the support line of the channel. A break and close below this support could extend the decline to $32,917.BTC/USDT 4-hour chart. Source: TradingViewThe 4-hour chart shows that the price has been clinging to the 20-EMA, indicating that bulls are attempting a comeback. If the price breaks above the overhead resistance between the 50-SMA and $41,561, the pair could rally to the 200-SMA. The bears are expected to mount a strong defense at this level.This positive view will invalidate in the short term if the price turns down from the current level and breaks below $39,200. The pair could then resume its correction and drop to the strong support at $37,000.XRP/USDTRipple (XRP) rebounded sharply off the strong support at $0.69, indicating strong demand at lower levels. The bulls pushed the price above the 50-day SMA ($0.78) on April 15 but could not continue the up-move. However, a minor positive is that the bulls are attempting to sustain the price above the 20-day EMA ($0.77).XRP/USDT daily chart. Source: TradingViewThe flat 20-day EMA and the RSI near the midpoint suggest a balance between supply and demand. This balance will shift in favor of the bulls if the XRP/USDT pair rises and breaks above $0.80. That could propel the pair to the 200-day SMA ($0.88) and then to the strong resistance at $0.91.Contrary to this assumption, if the price breaks and sustains below the 20-day EMA, it will suggest that the bears are active at higher levels. The sellers will then attempt to pull the pair to the strong support at $0.69.XRP/USDT 4-hour chart. Source: TradingViewThe 4-hour chart shows that the bears are aggressively defending the overhead resistance at the 200-SMA but they have not been able to sink the pair below the 20-EMA. This suggests that bulls are buying on dips.If the buyers drive the price above the 200-SMA, the bullish momentum could pick up. The pair could then rally to $0.85 where the bears may erect a stiff barrier. On the downside, a break and close below the 20-EMA could invalidate the bullish view in the short term and sink the pair to the 50-SMA.LINK/USDTChainlink (LINK) rose above the downtrend line on March 30 but the bulls could not sustain the higher levels. Strong selling near $18 pulled the price back below the downtrend line but a minor positive is that the buyers purchased the dip near $13.50 and are attempting to form a higher low.LINK/USDT daily chart. Source: TradingViewThe first sign of strength will be a break and close above the 20-day EMA ($15). Such a move will suggest that the bears may be losing their grip. The LINK/USDT pair could then rise to $16 and later challenge the overhead resistance at $18. A break and close above this level could open the doors for a possible rally to the 200-day SMA ($21).Conversely, if the price turns down from the 20-day EMA the bears will attempt to pull the pair to the critical support at $12.50. A break and close below this level could signal the resumption of the downtrend. LINK/USDT 4-hour chart. Source: TradingViewThe pair has risen above the downtrend line on the 4-hour chart and the 20-EMA and the 50-SMA are on the verge of completing a bullish crossover. This suggests that the bulls are attempting a comeback. If the price sustains above the 20-EMA, the pair could rally to $16 where the bears may again pose a strong challenge. The bullish momentum could pick up if buyers overcome this barrier.Alternatively, if the price turns down and breaks below the 20-EMA, it will suggest strong selling at higher levels. The bears will then attempt to pull the pair below $13.50.Related: AMC Theatres mobile app accepts Dogecoin, Shiba Inu and moreBCH/USDTBitcoin Cash (BCH) has been trying to form a bottom for the past several days. The price rose sharply on April 13 and broke above the 20-day EMA ($339). Although the bulls could not build upon the up-move, a positive sign is that they have not allowed the price to dip below the 50-day SMA ($329).BCH/USDT daily chart. Source: TradingViewThe 20-day EMA is attempting to turn up and the RSI is above 53, indicating a minor advantage to the bulls. If buyers propel the price above $354, the up-move may resume and the BCH/USDT pair could rally to the overhead resistance at $395.The bears are likely to defend this level with vigor. If the price turns down from $395, the range-bound action may extend for a few more days.If the price turns down and breaks below the 50-day SMA, the bears will attempt to pull the pair down to the strong support at $259. BCH/USDT 4-hour chart. Source: TradingViewThe 4-hour chart shows that the pair rallied sharply from $290 to $353. This may have tempted short-term traders to book profits but a positive sign is that the bulls did not allow the price to slide below the 20-EMA. This suggests that the sentiment remains positive and traders are buying on dips.The rising 20-EMA and the RSI in the positive zone indicate advantage to buyers. If the price breaks above $354, the up-move may reach $380 and then $395.FIL/USDTFilecoin (FIL) has been range-bound in a downtrend. The bulls are attempting to form a basing pattern and the price has been consolidating between $16.50 and $27 for the past few days.FIL/USDT daily chart. Source: TradingViewThe 20-day EMA ($21) and the 50-day SMA ($20) are flattish and the RSI is near the midpoint, suggesting a balance between supply and demand. If bulls sustain the price above the 20-day EMA, the possibility of a rally to the overhead resistance at $27 increases. The bulls will have to push and sustain the price above this level to signal the start of a possible new uptrend.This positive view could invalidate in the short term if the price breaks below the 50-day SMA. The bears will then try to sink the FIL/USDT pair to the strong support at $16.50. A break and close below this level will indicate the resumption of the downtrend.FIL/USDT 4-hour chart. Source: TradingViewThe bears are defending the overhead resistance at $22 but a minor positive is that the bulls have not allowed the price to break below the 200-SMA. If the price rises from the current level and breaks above the $22 to $23 resistance zone, the bullish momentum could pick up and the pair may rally to $27.The 20-EMA and the 50-SMA are completing a bullish crossover and the RSI is in the positive territory, indicating advantage to buyers. This positive view may invalidate in the short term if the pair turns down and breaks below the 200-SMA.The views and opinions expressed here are solely those of the author and do not necessarily reflect the views of Cointelegraph. Every investment and trading move involves risk, you should conduct your own research when making a decision.

Čítaj viac

Price analysis 4/15: BTC, ETH, BNB, XRP, SOL, ADA, LUNA, AVAX, DOGE, DOT

Bitcoin (BTC) remains closely correlated with the S&P 500 but the institutional investors do not seem to be waiting for a turnaround in the United States’ equities market or decoupling to happen before buying more Bitcoin. Notably, 30,000 Bitcoin moved out of Coinbase Pro in a single day, suggesting strong institutional demand.MicroStrategy, the publicly listed company, which is the largest single-wallet holder of Bitcoin, does not seem to be content with its stash of 129,219 Bitcoin. In a letter to shareholders, the firm’s CEO Michael Saylor said that the company aims to “vigorously pursue” and “increase awareness” about its Bitcoin strategy.Daily cryptocurrency market performance. Source: Coin360Another entity that has been at the forefront of Bitcoin purchases in the past few days has been the Luna Foundation Guard (LFG), a nonprofit organization attached to Terra, which owns 42,530 Bitcoin. LFG was recently gifted $820 million worth of LUNA tokens by Terraform Labs, which some believe may be used to buy more Bitcoin.Do the huge BTC outflows from a pro-trader crypto exchange suggest that a bottom may be close by? Let’s study the charts of the top-10 cryptocurrencies to find out.BTC/USDTBitcoin’s recovery fizzled out at $41,561 on April 13, indicating that higher levels continue to trigger selling. The buyers are currently attempting to defend the psychological level at $40,000.BTC/USDT daily chart. Source: TradingViewThe 20-day exponential moving average (EMA) ($42,419) is sloping down and the relative strength index (RSI) is in the negative territory, indicating that the path of least resistance is to the downside.If the price plummets below $39,200, the selling could intensify and the BTC/USDT pair could drop to the support line of the ascending channel. The bulls are likely to defend this level aggressively.Contrary to this assumption, if the price turns up and breaks above the 20-day EMA, it will suggest accumulation at lower levels. The bulls will then attempt to push the pair to $45,400.ETH/USDTEther (ETH) has been sandwiched between the 20-day EMA ($3,144) and the 50-day simple moving average (SMA) ($2,975) for the past three days. This suggests that bulls are defending the 50-day SMA while bears are selling on rallies to the 20-day EMA.ETH/USDT daily chart. Source: TradingViewIf the price breaks and sustains below $2,950, the selling could accelerate and the ETH/USDT pair could drop to $2,817. This level might act as a support but if it cracks, the next stop could be the uptrend line.Conversely, if the price rebounds off the current level and rises above the 20-day EMA, the pair could rally to the overhead zone between the 200-day SMA ($3,491) and $3,600. This is an important zone to watch out for because a break and close above it could signal the start of a new up-move.BNB/USDTBNB broke above the 20-day EMA ($420) on April 13 but the bulls could not build upon this advantage. The bears pulled the price back below the 20-day EMA on April 14 but a minor positive is that the bulls have not given up much ground.BNB/USDT daily chart. Source: TradingViewThe flattish 20-day EMA and the RSI near the midpoint indicate a possible range-bound action in the near term. If the price rises above $427, the bulls will try to push the BNB/USDT pair to the 200-day SMA ($420) where the bears are expected to mount strong resistance. Contrary to this assumption, if the price turns down from the current level, the bears will try to sink the pair below $391. If they succeed, the decline could extend to the strong support at $350. The buyers are likely to defend this level with vigor. XRP/USDTRipple’s (XRP) rebound picked up momentum and reached the 50-day SMA ($0.78) on April 15. If the price sustains above the 50-day SMA, the next stop could be the strong resistance at $0.91.XRP/USDT daily chart. Source: TradingViewThe 20-day EMA ($0.77) is flattening out and the RSI is near the midpoint, indicating range-bound action in the near term. The XRP/USDT pair could remain stuck between $0.69 and $0.91 for the next few days.Contrary to this assumption, if the price turns down from the 50-day SMA, it will suggest that bears are selling on rallies. The pair could then drop to the critical level at $0.69. A break and close below this support could pull the pair down to $0.62.SOL/USDTSolana (SOL) has been stuck between the 20-day EMA ($108) and the 50-day SMA ($100) for the past three days but this tight-range trading is unlikely to continue for long.SOL/USDT daily chart. Source: TradingViewIf bears sink and sustain the price below the 50-day SMA, the selling could pick up momentum. The SOL/USDT pair could then decline to $86. The downsloping 20-day EMA and the RSI in the negative zone indicate advantage to sellers.On the other hand, if the price rebounds off the 50-day SMA, the bulls will try to push the pair above the 20-day EMA. If they succeed, it will suggest that the correction may be over. The pair has a chance to then rise to $122 and later attempt a rally to the 200-day SMA ($148).ADA/USDT Cardano (ADA) has been trading inside a tight range between $0.91 and $1 for the past three days. This suggests uncertainty about the next directional move.ADA/USDT daily chart. Source: TradingViewThe downsloping 20-day EMA ($1) and the RSI in the negative territory indicate that bears are in command. If the tight range resolves to the downside, the ADA/USDT pair could extend its decline to $0.86 and later to the critical support at $0.74. Contrary to this assumption, if the price turns up from the current level and breaks above the 20-day EMA, the pair could rise to $1.10. A break and close above this minor resistance could open the doors for a possible retest of $1.26. The buyers will have to overcome this barrier to signal a potential change in trend.LUNA/USDTTerra’s LUNA token turned down from $90 and broke below the support at $80 on April 14, indicating that bears are selling on every minor rally. The bears will now try to pull the price down to $75.LUNA/USDT daily chart. Source: TradingViewThe 20-day EMA ($94) and the 50-day SMA ($93) are about to complete a bearish crossover and the RSI is in the negative territory, indicating that bears have the upper hand. A break and close below $75 could sink the LUNA/USDT pair to the 200-day SMA ($66). The bulls are expected to defend this level with all their might.Alternatively, if the price turns up from the current level and breaks above the 20-day EMA, it will suggest that the bears may be losing their grip. The pair could then attempt to rise above the psychological level at $100.Related: Cardano price risks 30% drop in Q2 despite a ‘major’ hard fork aheadAVAX/USDTAvalanche’s (AVAX) bounce off the uptrend line could not rise above the moving averages, indicating that the bears are active at higher levels. The price is currently stuck between the moving averages and the uptrend line.AVAX/USDT daily chart. Source: TradingViewThis tight-range trading is unlikely to continue for long. The downsloping 20-day EMA ($83) and the RSI below 40 suggest that the bears have a slight edge. If the price turns down and breaks below the uptrend line, the selling could pick up momentum. The AVAX/USDT pair could then drop to the next support at $65.On the contrary, if the price bounces off the uptrend line with strength, the buyers will try to push the pair above the moving averages. If they succeed, the pair could rise to $90 and later to $93.DOGE/USDTAfter two failed attempts to close above the 20-day EMA ($0.14) on April 12 and 13, the bulls managed to conquer the level on April 14. The buyers will now try to push Dogecoin (DOGE) to $0.16 and then to the 200-day SMA ($0.18).DOGE/USDT daily chart. Source: TradingViewThe bears are likely to defend the 200-day SMA. If the price turns down from this resistance, it will suggest that the DOGE/USDT pair could remain stuck between the 50-day SMA ($0.13) and the 200-day SMA for a few days. The flat 20-day EMA and the RSI just above the midpoint also suggest a consolidation in the near term.This view will be invalidated in the short term if the price turns down from the current level or the overhead resistance and plummets below the 50-day SMA. That could pull the pair down to $0.12.DOT/USDTThe recovery attempt in Polkadot (DOT) lacks strength, indicating that demand dries up at higher levels. This increases the likelihood of the continuation of the correction. DOT/USDT daily chart. Source: TradingViewThe downsloping 20-day EMA ($19) and the RSI in the negative zone indicate that bears have the upper hand. If the price turns down from the current level and breaks below $17, the decline could extend to $16. This level is likely to attract strong buying. If the price rebounds off $16, the buyers will make another attempt to clear the overhead resistance at $19. If they succeed, it will suggest that the correction may be over. The DOT/USDT pair may then consolidate between $23 and $16 for some time.Alternatively, if the price breaks below $16, the next stop should be the critical support at $14.Market data is provided by HitBTC exchange.The views and opinions expressed here are solely those of the author and do not necessarily reflect the views of Cointelegraph.com. Every investment and trading move involves risk, you should conduct your own research when making a decision.

Čítaj viac

Price analysis 4/13: BTC, ETH, BNB, SOL, XRP, ADA, LUNA, AVAX, DOT, DOGE

Bitcoin (BTC) and major altcoins are attempting a recovery after the sharp fall on April 11. According to Glassnode’s recent weekly report, Bitcoin has witnessed a “modest volume of profit-taking by investors” since mid-February, which could “be providing sufficient headwinds to prices.”While some investors are booking profits, the Luna Foundation Guard, the nonprofit organization attached to Blockchain protocol Terra, has continued to grow its stockpile of Bitcoin. Terra added 2,508 Bitcoin on April 13 to take its total holding to 42,406 Bitcoin, just shy of Tesla’s corporate treasury at 43,200 Bitcoin.Daily cryptocurrency market performance. Source: Coin360Larger investors do not seem to be perturbed by the volatility and sharp declines in cryptocurrencies and are taking a long-term view. Pantera Blockchain Fund, which had plans to raise $600 million, has amassed about $1.3 billion, indicating huge demand.Will bulls be able to sustain the bounce in Bitcoin and altcoins? Let’s study the charts of the top-10 cryptocurrencies to find out.BTC/USDTAlthough Bitcoin broke below the psychological level at $40,000 on April 11, the bears could not build upon this momentum. This indicates that the bulls are buying at lower levels.BTC/USDT daily chart. Source: TradingViewThe relief rally could hit a wall at the 20-day exponential moving average (EMA) ($42,967). If the price turns down from this resistance, it will suggest that bears are selling on rallies. The downsloping 20-day EMA and the relative strength index (RSI) below 44 suggest a minor advantage to sellers. The bears will have to sink the price below $39,200 to resume the decline. The BTC/USDT pair could then drop to the support line of the ascending channel. On the contrary, if the price continues higher and breaks above the 20-day EMA, the pair could challenge the overhead resistance at $45,400.ETH/USDTThe bulls are attempting to arrest the decline at the 50-day simple moving average (SMA) ($2,958). Although Ether (ETH) attempted a rebound on April 12, the buyers could not sustain the higher levels.ETH/USDT daily chart. Source: TradingViewThe bulls are again attempting to extend the relief rally on April 13. The bounce is likely to face selling at the 20-day EMA ($3,172). If the price turns down from this level, the likelihood of a break below the 50-day SMA increases. If that happens, the ETH/USDT pair could decline to the uptrend line.Contrary to this assumption, if the price breaks above the 20-day EMA, it will suggest aggressive buying by the bulls. The pair could then attempt a rally to the 200-day SMA ($3,490). The pair may then consolidate between the 50-day SMA and the 200-day SMA for a few days.BNB/USDTBNB plunged below the 50-day SMA ($402) on April 11 but the bears could not capitalize on this breakdown. The bulls purchased the dip aggressively and pushed the price back above the 50-day SMA on April 12.BNB/USDT daily chart. Source: TradingViewThe buyers are attempting to push and sustain the price above the 20-day EMA ($420). If they succeed, the BNB/USDT pair could rally to the 200-day SMA ($470) where the bears may mount a strong resistance. That could keep the price inside the range between the 200-day SMA and the 50-day SMA for a few days.Conversely, if the price fails to sustain above the 20-day EMA, it will indicate selling at higher levels. The bears will then make one more attempt to sink the price below the immediate support at $391. If they manage to do that, the pair could slide to $350.SOL/USDTSolana (SOL) bounced off the 50-day SMA ($99) on April 12 but the bulls could not push the price above the 20-day EMA ($110). This suggests that bears are selling on rallies to the 20-day EMA.SOL/USDT daily chart. Source: TradingViewThe bears will now attempt to sink and sustain the price below the 50-day SMA. If they manage to do that, the SOL/USDT pair could drop to the strong support at $81. The bulls are expected to defend this level with all their might because a break and close below it could resume the downtrend.Contrary to this assumption, if the price rises from the current level and breaks above the 20-day EMA, the bulls will make another attempt to clear the overhead hurdle at $122.XRP/USDTRipple (XRP) bounced off the strong support at $0.69 on April 12 but the bulls could not sustain the recovery. This indicates that the bears are active at higher levels. The inside-day candlestick pattern on April 13 suggests indecision among the bulls and the bears.XRP/USDT daily chart. Source: TradingViewThe 20-day EMA ($0.77) is sloping down and the RSI is near 39, suggesting that the path of least resistance is to the downside. If the price breaks below the strong support at $0.69, the selling could pick up momentum. The XRP/USDT pair could then decline to $0.62.Conversely, if the price continues to move up, the pair will attempt to rise above the 50-day SMA ($0.78). If that happens, it will suggest that the pair could trade inside a large range between $0.69 and $0.91 for some more time. ADA/USDT Cardano (ADA) attempted a relief rally on April 12 but the bulls could not clear the overhead hurdle at the psychological level at $1. This indicates that bears are attempting to flip the $1 level into resistance.ADA/USDT daily chart. Source: TradingViewIf the price once again turns down from the overhead resistance and breaks below $0.91, the correction could resume. The ADA/USDT pair could then drop to $0.86 and later to the critical support at $0.74. The 20-day EMA ($1.04) is sloping down and the RSI is in the negative zone, suggesting advantage to bears.This negative view will be invalidated in the short term if the price turns up and breaks above the 20-day EMA. Such a move could open the doors for a possible rally to the overhead resistance at $1.26.LUNA/USDTTerra’s LUNA token formed an inside-day candlestick pattern on April 12 but the long wick on the day’s candlestick suggests that bears sold at higher levels. A minor positive is that the buyers are again trying to extend the recovery on April 13.LUNA/USDT daily chart. Source: TradingViewIf bulls push the price above $89, the LUNA/USDT pair could rise to the 20-day EMA ($96) where the bears are likely to mount a strong resistance. The downsloping 20-day EMA and the RSI in the negative zone indicate advantage to sellers. If the price turns down from the overhead resistance and breaks below $80, the correction could resume and the pair may slide to the strong support at $75. Alternatively, if the price continues to move up and breaks above the 20-day EMA, the pair could rally to the 61.8% Fibonacci retracement level at $104.Related: ApeCoin eyes 250% rally amid ‘bull pennant’ breakout, Robinhood APE listing rumorsAVAX/USDTThe bulls are attempting to arrest the decline in Avalanche (AVAX) at the uptrend line but the bounce is likely to encounter strong resistance from the bears near the moving averages.AVAX/USDT daily chart. Source: TradingViewIf the price fails to break above the moving averages within the next few days, the possibility of a break below the uptrend line increases. If that happens, the AVAX/USDT pair could decline to the next support at $65.This level is likely to act as a strong support as the bulls have defended it successfully on two previous occasions. A strong rebound off it will indicate that the pair may trade inside the range between $65 and $99 for a few more days.Alternatively, a break and close below $65 could intensify selling and the pair may drop to the critical support at $51.DOT/USDTPolkadot (DOT) is attempting a recovery after the sharp fall on April 11, which suggests buying at lower levels. However, the bulls are likely to face stiff resistance from the bears at higher levels.DOT/USDT daily chart. Source: TradingViewIf the price fails to rise above the immediate overhead resistance at $19, the bears will try to sink the DOT/USDT pair below the strong support at $16. If they succeed, the decline could extend to $14. The downsloping 20-day EMA ($19) and the RSI in the negative territory indicate that the path of least resistance is to the downside.Alternatively, if the price moves up sharply and breaks above the 20-day EMA, it will suggest accumulation at lower levels. The pair could then consolidate inside the range between $16 and $23 for a few more days.DOGE/USDTThe buyers are attempting to defend the 50-day SMA ($0.13) but the weak rebound off the strong support suggests a lack of buyers in Dogecoin (DOGE) at higher levels. This increases the possibility of a break below the 50-day SMA.DOGE/USDT daily chart. Source: TradingViewIf the price fails to sustain above the 20-day EMA ($0.14), the sellers will attempt to extend the decline by pulling the DOGE/USDT pair below the 50-day SMA. If they succeed, the pair could drop to $0.12 and then slide to the critical support at $0.10.Contrary to this assumption, if the price turns up sharply and rises above $0.15, it will suggest strong buying at the 50-day SMA. The pair could then remain stuck between the 200-day SMA ($0.18) and the 50-day SMA for a few days.The views and opinions expressed here are solely those of the author and do not necessarily reflect the views of Cointelegraph. Every investment and trading move involves risk. You should conduct your own research when making a decision.Market data is provided by HitBTC exchange.

Čítaj viac

Získaj BONUS 8 € v Bitcoinoch

nakup bitcoin z karty

Registrácia Binance

Burza Binance

Aktuálne kurzy