Autor Cointelegraph By Rakesh Upadhyay

Price analysis 4/29: BTC, ETH, BNB, SOL, LUNA, XRP, ADA, DOGE, AVAX, DOT

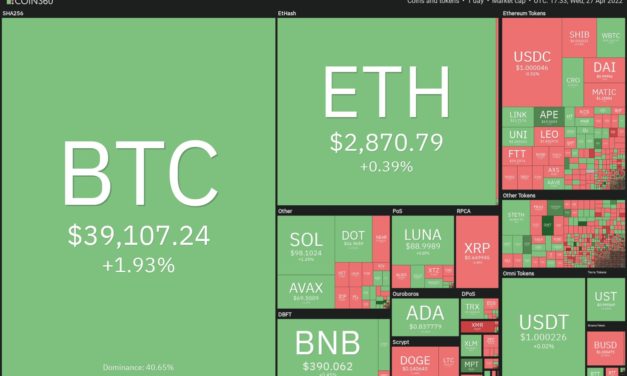
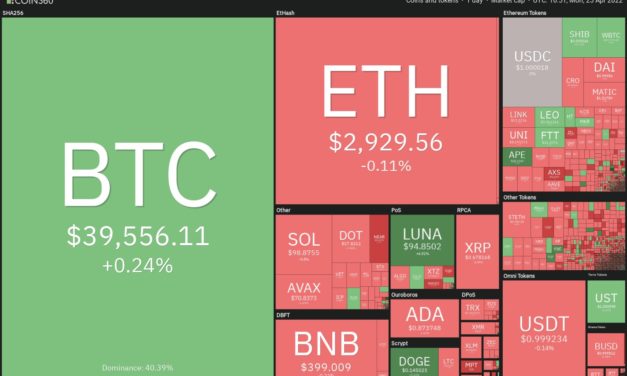
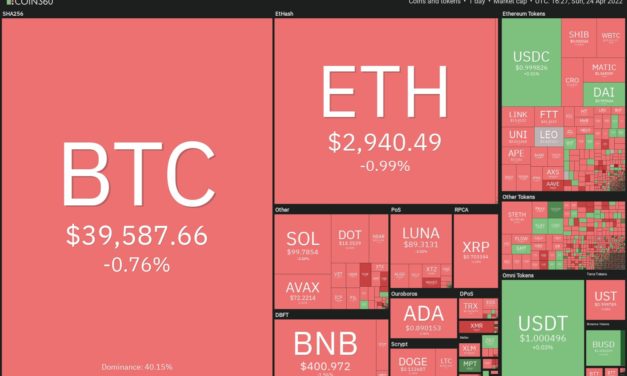
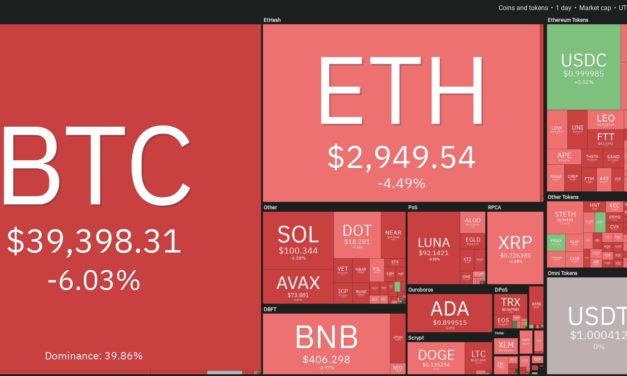
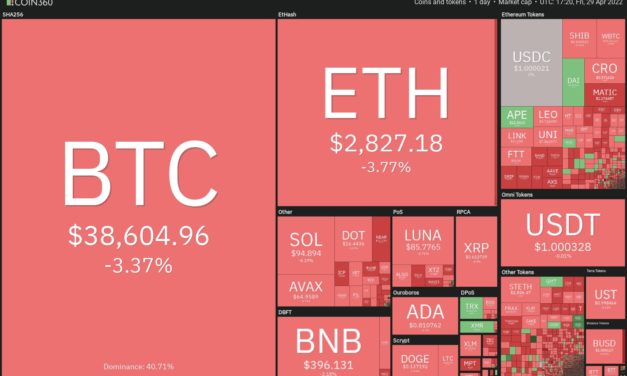
The U.S. dollar index (DXY) turned down from its 20-year high on April 29 but that has not changed the bearish price action seen in Bitcoin (BTC) and U.S. equity markets. Equities remain under pressure and this week Amazon stock saw its biggest intraday drop since 2014 after uncertainty over the U.S. Federal Reserve’s tightening measures placed investor sentiment back into choppy waters.If Bitcoin extends its correction, on-chain analysis platform Whalemap believes that the $25,000 to $27,000 zone may be the best place “to go all in” on Bitcoin.Long-term investors do not appear to be panicking over the current weakness in Bitcoin and on-chain data from CryptoQuant shows that the combined BTC reserves of 21 crypto exchanges has plummeted to levels not seen since September 2018.Daily cryptocurrency market performance. Source: Coin360The HODL mentality is not limited to Bitcoin investors alone. A nonfungible token survey report by CoinGecko showed that more than 50% of respondents said they have a HODL mentality because they believe NFTs could be important items in games. The report added that the Metaverse could become an $800 billion market in the next two years.Could Bitcoin and altcoins decline further or is a reversal on the cards? Let’s study the charts of the top-10 cryptocurrencies to find out.BTC/USDTBitcoin pulled back to the 20-day exponential moving average ($40,363) on April 28 but the long wick on the day’s candlestick suggests that bears are selling on rallies to this level.BTC/USDT daily chart. Source: TradingViewThe downsloping 20-day EMA and the relative strength index (RSI) below 41 indicate that the path of least resistance is to the downside. If bears sink and sustain the price below the support line of the channel, the BTC/USDT pair could extend its decline to $34,300 and later to $32,917.To invalidate this negative view, the buyers will have to push and sustain the price above the 50-day simple moving average ($41,981). If they succeed, the pair could start its northward journey to the 200-day SMA ($47,433) where the bears may again pose a stiff challenge.ETH/USDTEther (ETH) pulled back to the 20-day EMA ($2,991) in the past two days but the bulls could not push the price above it. This suggests that the sentiment remains negative and traders are selling on rallies.ETH/USDT daily chart. Source: TradingViewThe bears will now attempt to sink the price to the uptrend line. This is an important level for the bulls to defend because a break and close below it could invalidate the developing ascending triangle pattern. The ETH/USDT pair could then decline to $2,450.This negative view could invalidate in the short term if the price turns up and breaks above the 50-day SMA ($3,045). That could attract buyers who may then push the pair to the 200-day SMA ($3,464). A break and close above this level could signal the start of a new up-move.BNB/USDTBinance Coin (BNB) dropped below $391 on April 26 but the bears could not sustain the lower levels. The price rose back above the breakdown level on April 27. This suggests demand at lower levels.BNB/USDT daily chart. Source: TradingViewThe bulls pushed the price to the 50-day SMA ($410) on April 28 but could not clear this hurdle. This suggests that bears are selling on rallies. The bears will now attempt to pull the price below the $391 to $380 support zone. If they manage to do that, the BNB/USDT pair could drop to the strong support at $350. The buyers are expected to mount a strong defense at this level. The short-term trend could turn positive if bulls push and sustain the price above the 50-day SMA.SOL/USDTSolana (SOL) bounced off the support line of the ascending channel on April 27 but the bulls could not sustain the positive momentum and clear the overhead hurdle at the 20-day EMA ($101).SOL/USDT daily chart. Source: TradingViewThe bears now sense an opportunity and will try to sink the price below the support line of the channel. If they manage to do that, the selling could accelerate and the SOL/USDT pair could slide to the strong support at $75. This is an important level for the bulls to defend because a break and close below it could signal the resumption of the downtrend.This negative view could invalidate in the short term if the price turns up and breaks above the 20-day EMA. The pair could then rise to $110 and later attempt a rally to $122.LUNA/USDTThe failure of the bulls to push Terra’s LUNA token above the psychological resistance at $100 could have tempted short-term traders to book profits. That has pulled the price below the minor support at $86 today.LUNA/USDT daily chart. Source: TradingViewThe RSI has dipped into the negative zone, indicating that the bullish momentum has weakened. If bears sustain the price below $86, the LUNA/USDT pair could drop to the strong support at $75. The bulls are expected to defend the zone between $75 and the 200-day EMA ($69) aggressively.On the upside, the buyers will have to overcome the stiff barrier at $100 to set up a potential retest of the all-time high at $119. A break and close above this level could signal the resumption of the uptrend.XRP/USDTRipple (XRP) rebounded off the support at $0.62 on April 26 but the weak rebound suggested a lack of aggressive buying. The selling resumed today and the bears have pulled the price below the critical support. XRP/USDT daily chart. Source: TradingViewThe 20-day EMA ($0.71) is sloping down and the RSI is in the oversold zone, suggesting that the path of least resistance is to the downside. If the price sustains below $0.62, the XRP/USDT pair could plummet to $0.55 and later challenge the psychological support at $0.50. Contrary to this assumption, if the price rebounds off the current level, the buyers will make one more attempt to push the pair above the 20-day EMA. If they succeed, it will suggest that the pair may consolidate between $0.62 and $0.91 for some time.ADA/USDT Cardano (ADA) tried to start a relief rally from $0.81 on April 27 but failed to reach the 20-day EMA ($0.91). The selling resumed today and the bears will now attempt to pull the price to the strong support at $0.74.ADA/USDT daily chart. Source: TradingViewThe 20-day EMA is sloping down and the RSI is near the oversold territory, suggesting that bears have the edge. If bears sink the price below $0.74, the selling could intensify and the ADA/USDT pair could plummet to $0.68.Contrary to this assumption, if the price rebounds off $0.74, the bulls will try to push the pair above the 20-day EMA. If they succeed, the pair could rally to the psychological level at $1 which is likely to act as a stiff resistance.Related: 3 reasons why Dogecoin price can now gain 50% by SeptemberDOGE/USDTDogecoin (DOGE) has managed to stay above the 50-day SMA ($0.13) for the past three days but the bulls have not been able to sustain the price above the 20-day EMA ($0.14). This suggests that the bears are selling at higher levels.DOGE/USDT daily chart. Source: TradingViewThe failure to bounce may attract further selling which could pull the price below the 50-day SMA. If that happens, the DOGE/USDT pair could drop to $0.12 and later to the psychological support at $0.10.Contrary to this assumption, if the price rises and sustains above the 20-day EMA, the buyers will try to push the pair to the overhead resistance at $0.17. The bulls will have to clear this hurdle to signal a possible change in trend. AVAX/USDTAvalanche (AVAX) has declined to the strong support at $65. The bulls had defended this support on two previous occasions hence they will again try to arrest the decline at this level.AVAX/USDT daily chart. Source: TradingViewHowever, the bears are likely to have other plans. The downsloping 20-day EMA ($74) and the RSI near the oversold territory favor the bears. If the price breaks below $65, the AVAX/USDT pair could drop to the critical support at $51.Alternatively, if the price rebounds off $65, the pair is likely to hit a wall at the 20-day EMA. If the price turns down from this resistance, the prospects of a break below $65 increase. The bulls will have to push and sustain the price above the 20-day EMA to indicate that the bears may be losing control. The pair could then rise to the 200-day SMA ($85).DOT/USDTThe bulls are defending the support of the large range between $16 and $23 but haven’t been able to achieve a strong rebound off it. This suggests that demand dries up for Polkadot (DOT) at higher levels.DOT/USDT daily chart. Source: TradingViewThe downsloping 20-day EMA ($18) and the RSI in the negative territory indicate advantage to sellers. The bears will now attempt to pull the price below the $16 support and if they manage to do that, the DOT/USDT pair may drop to $14. The buyers will have to push and sustain the price above the 50-day SMA ($19) to signal that the corrective phase may be over. The pair could then start its journey toward the overhead resistance at $23.The views and opinions expressed here are solely those of the author and do not necessarily reflect the views of Cointelegraph. Every investment and trading move involves risk. You should conduct your own research when making a decision.Market data is provided by HitBTC exchange.

Čítaj viac

Price analysis 4/27: BTC, ETH, BNB, XRP, SOL, LUNA, ADA, AVAX, DOGE, DOT

The U.S. dollar index (DXY) has risen above the highs created in March 2020 and may next challenge the multi-year highs set in January 2017. Bitcoin’s (BTC) price action is generally inversely connected to DXY. Therefore, unless the dollar reverses its sharp uptrend, a strong recovery in Bitcoin may be difficult.Although Bitcoin has not confirmed a bottom, institutional investors seem to have started their purchases at lower levels. Canada’s Purpose Bitcoin exchange-traded fund added 1,132 BTC to its holdings, according to data analytics platform Coinglass. Behavior analytics resource Santiment also suggested that the crowd’s interest in buying the dip hit a six-week high.Daily cryptocurrency market performance. Source: Coin360The crypto sector has been under pressure in 2022 but that has not reduced venture-capital (VC) activity in different blockchain sectors. The first quarter of 2022 has witnessed VC investments of more than $14.6 billion in the blockchain industry, which is 48% of the total investments made by VC’s in 2021. This shows the long-term growth potential of the industry.Could Bitcoin and altcoins start a recovery from their respective support levels? Let’s study the charts of the top-10 cryptocurrencies to find out.BTC/USDTBitcoin’s recovery on April 26 stalled at the 20-day exponential moving average ($40,618), suggesting that the sentiment remains negative and traders are selling on rallies. A minor positive is that the price has rebounded off the support line of the ascending channel today indicating that bulls are attempting to defend this level. BTC/USDT daily chart. Source: TradingViewIf the bounce sustains, the bulls will again strive to push the price above the 20-day EMA and the 50-day simple moving average (S42,038). If they succeed, it will suggest that the BTC/USDT pair could extend its stay inside the channel for a few more days.Conversely, if the price turns down from the current level or the 20-day EMA and breaks below the channel, it will suggest that bears are in control. The pair could then slide to $34,300 and later to $32,917. ETH/USDTEther (ETH) once again turned down from the 20-day EMA ($3,014) on April 26, indicating that bears continue to sell on rallies to this level. The bears will now try to pull the price to the uptrend line.ETH/USDT daily chart. Source: TradingViewIf bears sink the price below the uptrend line, the ETH/USDT pair could slide toward $2,450. The bulls will attempt to stall the decline at this level but if they fail, the selling could accelerate and the pair may drop to $2,159.Alternatively, if the price rises from the current level, the buyers will make one more attempt to propel the pair above the 20-day EMA. If they manage to do that, the pair could rise to $3,200 and later attempt an up-move to the 200-day SMA ($3,470).BNB/USDTBinance Coin (BNB) closed below the immediate support at $391 on April 26, indicating near-term weakness. The bulls are currently attempting to push the price back above the breakdown level. BNB/USDT daily chart. Source: TradingViewIf they succeed, the price could rise to the 20-day EMA ($408). This is an important resistance to keep an eye on because if bulls clear this hurdle, the BNB/USDT pair could rise to $431 and later attempt a rally to $460.Contrary to this assumption, if bears flip the $391 level into resistance, the BNB/USDT pair could resume its downtrend and drop toward the strong support at $350. The downsloping 20-day EMA and the RSI in the negative zone indicate that the path of least resistance is to the downside.XRP/USDTRipple’s (XRP) long tail on the April 25 candlestick shows strong buying at lower levels. However, the bulls could not sustain the price above $0.70 on April 26, resulting in another sell-off.XRP/USDT daily chart. Source: TradingViewThe downsloping 20-day EMA ($0.72) and the RSI near the oversold zone indicate that bears have the upper hand. If the price breaks below the immediate support at $0.62, the XRP/USDT pair could plummet to the strong support at $0.55.Contrary to this assumption, if the price rebounds off the current level, the bulls will make another attempt to push and sustain the pair above the breakdown level at $0.69. If they succeed, the pair could rise to the 50-day SMA ($0.77).SOL/USDTThe bulls have been defending the support line of the ascending channel for the past two days but they haven’t been able to push Solana (SOL) above the 20-day EMA ($103). This suggests that demand dries up at higher levels.SOL/USDT daily chart. Source: TradingViewThe downsloping 20-day EMA and the RSI below 44 indicate advantage to sellers. If the price turns down from the current level or the 20-day EMA, it will increase the possibility of a drop below the ascending channel. If that happens, the SOL/USDT pair could plunge to the strong support at $75.Alternatively, if the price rises from the current level and breaks above the 20-day EMA, it will suggest accumulation at the support line. The pair could then rally to $110. A break and close above this level will suggest that the pair may extend its stay inside the channel for a few more days.LUNA/USDTTerra’s LUNA token has been oscillating above and below the 20-day EMA ($91) for the past few days. The buyers pushed the price above the 50-day SMA ($94) on April 25 but could not sustain the higher levels.LUNA/USDT daily chart. Source: TradingViewThe bears pulled the price back below the 20-day EMA on April 26. If the price slips and sustains below $86, the LUNA/USDT pair could continue to slide toward the strong support at $75. The buyers are likely to defend this level aggressively.If the price turns up from the current level and rises above the 50-day SMA, the bulls will again attempt to propel the pair above the psychological resistance at $100. If they succeed, the pair may rise to the all-time high at $119.The flattish 20-day EMA and the RSI just below the midpoint do not give a clear advantage either to the bulls or the bears.ADA/USDT After repeatedly failing to break above the psychological level at $1, Cardano (ADA) has gradually been dropping toward the strong support at $0.74.ADA/USDT daily chart. Source: TradingViewThe downsloping 20-day EMA ($0.93) and the RSI near the oversold territory indicate advantage to bears. The sellers will now attempt to sink the ADA/USDT pair below the strong support at $0.74. If they succeed, the pair could resume the downtrend.Contrary to this assumption, if the price rises from the current level or the $0.74 support, the bulls will attempt to push the pair above the 20-day EMA. If they do that, the pair could rise to $1. A break and close above this resistance could open the doors for a possible rally to $1.26.Related: Ex-BitMEX CEO explains how Bitcoin will have hit $1 million by 2030AVAX/USDTAvalanche (AVAX) has been trading between $65 and $99 for the past few days. The price has gradually drifted down toward the support of the range where the buyers are expected to mount a strong defense.AVAX/USDT daily chart. Source: TradingViewIf the price bounces off the current level, the bulls will attempt to push the AVAX/USDT pair above the 20-day EMA ($76). If they succeed, it will be the first indication that the bears may be losing their grip. A break and close above the 200-day SMA ($85) could open the doors for a potential rally to $99.Alternatively, if the price turns down from the current level or the 20-day EMA and breaks below $65, it could clear the path for a drop to $51. The downsloping 20-day EMA and the RSI in the negative zone indicate the path of least resistance is to the downside.DOGE/USDTDogecoin (DOGE) soared to the overhead resistance at $0.17 on April 25 but the bulls could not overcome this barrier. The failure to do so may have attracted profit-booking by short-term traders which pulled the price back below the 20-day EMA ($0.14) on April 26.DOGE/USDT daily chart. Source: TradingViewThe 20-day EMA is flat and the RSI is near the midpoint, suggesting a range-bound action in the near term. If the price breaks below the 50-day SMA ($0.13), the DOGE/USDT pair could drop to $0.12. The bulls are likely to defend this level with vigor but if they fail to arrest the decline, the next stop could be the psychological level at $0.10.The next trending move could start after the bulls push and sustain the pair above $0.17 or bears sink the price below the support at $0.10. Until then, volatile range-bound action is likely to continue.DOT/USDTPolkadot (DOT) has been stuck inside a range between $23 and $16 for the past several days. This means traders buy the dips to the support of the range and sell on rallies to the resistance level.DOT/USDT daily chart. Source: TradingViewThe price has bounced off the support and the buyers will now try to propel the DOT/USDT pair above the 50-day SMA ($19.39). If they succeed, it will suggest that the pair may extend its stay inside the range for a few more days.Conversely, if the price slips and sustains below $16, it will indicate that supply exceeds demand. The pair could then decline to the critical support at $14. This is an important level for the bulls to defend because a break below it could signal the resumption of the downtrend.The views and opinions expressed here are solely those of the author and do not necessarily reflect the views of Cointelegraph. Every investment and trading move involves risk. You should conduct your own research when making a decision.Market data is provided by HitBTC exchange.

Čítaj viac

Price analysis 4/25: BTC, ETH, BNB, XRP, SOL, LUNA, ADA, AVAX, DOGE, DOT

Bitcoin (BTC) continues to trade below $40,000 as bears try to flip the level into resistance. The soaring U.S. dollar index (DXY), which is usually inversely related to Bitcoin, favors the sellers. However, it is not all gloom and doom because the Bitcoin bulls seem to be taking clues from the Nasdaq (NDX) which has been hovering close to positive territory.Although risky assets have been on the receiving end for the past few days, Bitcoin hodlers are focusing on the long-term bullish projections and ignoring the short-term weakness. Glassnode data shows that Bitcoin’s supply that has not moved for at least a year has hit above “64% for the first time ever.”Daily cryptocurrency market performance. Source: Coin360While speaking to Bloomberg, SkyBridge Capital founder Anthony Scaramucci said that the firm is bullish on cryptocurrency markets “over the three to five years.” The hedge fund now plans to reposition itself by allocating a majority of its assets under management to digital assets and become the “leading cryptocurrency asset manager and adviser:”Could a further decline in Bitcoin and altcoins attract buying from long-term investors? What are the key levels to keep an eye on? Let’s study the charts of the top-10 cryptocurrencies to find out.BTC/USDTBitcoin dipped below the immediate support at $38,536 today but the bears could not build upon their advantage. The long tail on the day’s candlestick suggests strong buying near the support line of the ascending channel.BTC/USDT daily chart. Source: TradingViewThe buyers will now attempt to push the price above the 20-day exponential moving average ($40,974). If they manage to do that, the BTC/USDT pair could rise to $43,000.Conversely, if the price turns down from the 20-day EMA, it will suggest that the sentiment remains negative and bears are selling on rallies to strong overhead resistance levels. The pair could then decline to the support line of the channel.A break and close below the channel could accelerate selling and the pair may slide to the strong support zone between $34,300 and $32,917. The bulls are expected to defend this level with all their might.ETH/USDTEther (ETH) broke and closed below the 50-day simple moving average ($3,022) on April 21 indicating weakness. The buyers tried to push the price back above the 50-day SMA on April 22 but failed, suggesting that the bears have flipped the level into resistance. ETH/USDT daily chart. Source: TradingViewThe bears pulled the price below the immediate support at $2,883 today but the long tail on the day’s candlestick suggests that bulls are aggressively buying at lower levels. If buyers propel the price above the 20-day EMA ($3,045), the ETH/USDT pair could rise to $3,200 and thereafter rally to the 200-day SMA ($3,477).Conversely, if the price turns down from the psychological level at $3,000, it will suggest that bears continue to sell at higher levels. If the pair slips below $2,797, the pair could drop to the uptrend line.BNB/USDTBinance Coin (BNB) broke below the immediate support at $391 today but the long tail on the day’s candlestick shows that bulls are buying at lower levels.BNB/USDT daily chart. Source: TradingViewIf the price sustains and closes above $391, the bulls will strive to push the BNB/USDT pair above the 20-day EMA ($411). If they succeed, the pair could rally to the overhead resistance at $445.On the contrary, if the price turns down from the current level or the 20-day EMA and breaks below $382, it will suggest that bears are selling on rallies. That could pull the pair to the strong support at $350. The downsloping 20-day EMA and the relative strength index (RSI) in the negative zone suggest that bears have an edge.XRP/USDTRipple (XRP) broke below the strong support at $0.69 today, indicating that the range-bound action has resolved in favor of the sellers. The 20-day EMA ($0.74) has turned down and the RSI is near the oversold territory, indicating that bears are in command.XRP/USDT daily chart. Source: TradingViewIf the price sustains below $0.69, the XRP/USDT pair could drop to the immediate support at $0.62. If the price rebounds off this level but does not rise back above $0.69, it will suggest that bears have flipped the level into resistance. That will increase the possibility of a drop to the strong support at $0.54.Conversely, if the price turns up and rises back above $0.69, it will suggest that the markets have rejected the lower levels. The pair could then again attempt to break above the 50-day SMA ($0.78).SOL/USDTSolana’s (SOL) tight range trading resolved to the downside and the price has slipped to the support line of the ascending channel. This is an important level to keep an eye on.SOL/USDT daily chart. Source: TradingViewIf bears sink and sustain the price below the channel, the selling could intensify and the SOL/USDT pair could slide to the strong support at $75. The downsloping 20-day EMA ($104) and the RSI in the negative territory indicate that bears are in control.Conversely, if the price rebounds off the current level with strength, it will suggest that bulls continue to defend this support with vigor. The buyers will then again try to push the pair above the 20-day EMA. If they do that, the pair could rise toward $122.LUNA/USDTTerra’s LUNA token slipped below the 20-day EMA ($91) on April 23 but the bears could not make use of this advantage. This suggests that selling dries up at lower levels.LUNA/USDT daily chart. Source: TradingViewThe 20-day EMA ($91) is flat and the RSI is just above the midpoint, indicating a balance between supply and demand. If the price breaks above the 50-day SMA ($94), the bulls will make another attempt to clear the overhead hurdle at $100. If they succeed, the LUNA/USDT pair could start its march toward the all-time high at $119.The balance could tilt in favor of the sellers if the price turns down from the 50-day SMA and plummets below $87. That could pull the pair to the strong support at $75.ADA/USDT Cardano (ADA) has been stuck inside a large range between $0.74 and $1.26 for the past several days. This suggests that traders buy near the support and sell close to the resistance of the range.ADA/USDT daily chart. Source: TradingViewAfter failing to cross above the resistance at $1.26 on April 4, the ADA/USDT pair has been declining toward the support of the range. The downsloping 20-day EMA ($0.95) and the RSI in the negative territory indicate that bears are in control.The pair broke below the support at $0.87 today clearing the path for a possible drop to $0.74. This level is likely to attract strong buying by the bulls. If that happens, the bulls will try to push the pair above the 20-day EMA. If they manage to do that, it will suggest that the range-bound action may continue for a few more days.Related: Could XRP price lose another 70% by Q3?AVAX/USDTAvalanche (AVAX) broke and closed below the uptrend line on April 21 which invalidated the possible ascending triangle pattern. The bears pressed upon their advantage and pulled the price near the strong support at $65.AVAX/USDT daily chart. Source: TradingViewThe long tail on today’s candlestick suggests that bulls are buying the dips near $65. They will now attempt a relief rally which could hit a wall at the 20-day EMA ($77). If the price turns down from this resistance, it will suggest that the sentiment remains negative and traders are selling on rallies. The bears will then make one more attempt to sink the price below $65.Conversely, a break above the 20-day EMA will suggest that the AVAX/USDT pair could remain range-bound between $65 and $99 for some more time.DOGE/USDTDogecoin (DOGE) broke below the 50-day SMA ($0.13) on April 24 and the bears pulled the price to the strong support at $0.12 on April 25. The bulls bought this dip aggressively and have pushed the price back above the 50-day SMA.DOGE/USDT daily chart. Source: TradingViewIf buyers sustain the price above the 20-day EMA ($0.14), the DOGE/USDT pair could attempt to rally to $0.15 and later to the strong overhead resistance at $0.17. The 200-day SMA ($0.17) is placed just above this level, hence the bears are expected to mount a strong defense at $0.17.Alternatively, if the price turns down and breaks below the 50-day SMA, it will suggest that bears are unwilling to surrender and they continue to sell on rallies. The longer the price sustains below the 50-day SMA, the greater the possibility of a drop to the psychological level at $0.10.DOT/USDTPolkadot (DOT) turned down from the overhead resistance at $19 on April 24 and the bears are attempting to build upon this advantage and sink the price below the immediate support at $17.DOT/USDT daily chart. Source: TradingViewIf they manage to do that, the DOT/USDT pair could decline to the strong support at $16. The downsloping 20-day EMA ($19) and the RSI in negative territory indicate that bears have the upper hand.Contrary to this assumption, if the price turns up from the current level, the bulls will make one more attempt to clear the overhead hurdle. A break and close above the 50-day SMA ($19) could clear the path for a possible rally to $23.The views and opinions expressed here are solely those of the author and do not necessarily reflect the views of Cointelegraph. Every investment and trading move involves risk. You should conduct your own research when making a decision.Market data is provided by HitBTC exchange.

Čítaj viac

Top 5 cryptocurrencies to watch this week: BTC, DOT, XMR, APE, CAKE

Bitcoin (BTC) and several altcoins are trading in a tight range during the weekend, suggesting that investors are undecided about the next directional move. Traders may be waiting for Wall Street to open before placing large directional bets because Bitcoin has been tightly correlated with the S&P 500 in the past few days.The sharp fall in the U.S. equity markets on April 22 suggests that investors are increasingly nervous about the hawkish stance of central banks. The market expects a 250 basis points rate hike by the U.S. Federal Reserve in 2022. In addition, the European Central Bank is expected to raise rates for the first time since 2011, according to a Reuters source.Crypto market data daily view. Source: Coin360Coinglass data showed that funding rates across crypto derivatives exchanges remained negative during the weekend, signaling a bearish bias. The failure to sustain a recovery has pulled the Crypto Fear and Greed Index back into the “extreme fear” territory. Could Bitcoin attract strong buying at lower levels? If that happens, select altcoins could outperform to the upside. Let’s study the charts of the top-5 cryptocurrencies that show a positive chart structure.BTC/USDTBitcoin broke below the psychological support at $40,000 on April 22 but the bears have not been able to build upon this advantage. The successive inside-day candlestick patterns on April 23 and April 24 suggest indecision among the bulls and the bears. BTC/USDT daily chart. Source: TradingViewThe 20-day exponential moving average ($41,150) is sloping down and the relative strength index (RSI) is in the negative zone, indicating that sellers have a slight edge. If bears sink and sustain the price below $39,000, the BTC/USDT pair could drop to the support line of the ascending channel. The bulls are expected to defend this level with vigor.If the price rebounds off the support line with force, it will indicate strong demand at lower levels. The bulls will have to push and sustain the price above the 50-day simple moving average ($41,993) to indicate that the correction may be over. The pair may then attempt a rally to the 200-day SMA ($47,828).Alternatively, if the price breaks below the channel, the selling could intensify further and the pair may drop to $34,322 and later to $32,917.BTC/USDT 4-hour chart. Source: TradingViewThe 4-hour chart shows that the price is stuck inside a tight range between $39,177 and $39,980. This indicates that the bears are trying to flip the $40,000 level into resistance. The downsloping 20-EMA and the RSI in the negative territory suggest the path of least resistance is to the downside.If the price breaks below $39,177, the pair could slide to $38,536. A break and close below this level could open the doors for a drop to $37,000.Contrary to this assumption, if the price turns up from the current level and breaks above the 50-SMA, the bullish momentum could pick up and the pair may rise to the 200-SMA.DOT/USDTPolkadot (DOT) has been trading near the overhead resistance at $19 for the past few days. This suggests that the bears have successfully defended the level but a minor positive is that the bulls have not ceded much ground to the sellers.DOT/USDT daily chart. Source: TradingViewThe marginally downsloping 20-day EMA ($19) and the RSI in the negative zone suggest that bears have a slight edge. If the price turns down and breaks below $18, the possibility of a drop to the strong support at $16 increases.Conversely, if bulls thrust the price above the 50-day SMA ($19), the bullish momentum could pick up and the DOT/USDT pair may rally to the overhead resistance at $23. The bears are expected to mount a strong defense at this level.DOT/USDT 4-hour chart. Source: TradingViewThe 4-hour chart shows the formation of a descending triangle pattern which will complete on a break and close below $18. If that happens, the pair could decline to $17 and later to $16.Conversely, if the price turns up from the current level and rises above the downtrend line, it may invalidate the bearish setup. That could attract buying and the pair may rally to the 200-SMA.A break and close above this level could signal advantage to buyers. The pair may then attempt a rally to $23.XMR/USDTMonero (XMR) is correcting in an up-move. The price turned down from $290 on April 22, indicating that bears are posing a strong challenge near the psychological level at $300.XMR/USDT daily chart. Source: TradingViewThe XMR/USDT pair could first drop to the 20-day EMA ($245) which is likely to act as a strong support. If the price rebounds off this level with strength, it will indicate that bulls are buying on dips. The pair could then again attempt a break above the overhead resistance at $300. If that happens, the pair may rally to $340.Alternatively, if the price breaks below the 20-day EMA, the selling could intensify and the pair may slide to the 50-day SMA ($215).XMR/USDT 4-hour chart. Source: TradingViewThe pair has dropped below the 50-SMA, indicating profit-booking by short-term traders. If the price continues lower and breaks below $250, the selling could accelerate and the pair may drop to $240 and later to the 200-SMA.Any rebound is likely to face selling at the 20-EMA. The bulls will have to push and sustain the price above the 20-EMA to indicate that the correction may be over. The pair could then rise to $280 and later to $290.Related: Monero ‘falling wedge’ breakout positions XMR price for 75% rallyAPE/USDTApeCoin (APE) broke out of the symmetrical triangle pattern on April 19, indicating that the indecision among the bulls and the bears resolved in favor of the buyers.APE/USDT daily chart. Source: TradingViewThe 20-day EMA ($13.67) has turned up and the RSI is in the positive zone, indicating that bulls are in command. There is a minor resistance at $18.44 from where the APE/USDT pair turned down on April 23.If the price turns up from the current level, the bulls will attempt to push the pair above $18.44. If they succeed, the pair could climb toward $20 and later to $24. This positive view could invalidate in the short term if the price turns down and breaks below the 20-day EMA. APE/USDT 4-hour chart. Source: TradingViewThe 4-hour chart shows that the pair turned down from $18 but rebounded sharply off the 20-EMA. This suggests that the sentiment remains positive and traders are buying on dips. If the price sustains above $17, the bulls will attempt to resume the up-move.Although the rising 20-EMA indicates advantage to buyers, the RSI has formed a negative divergence suggesting that the positive momentum may be weakening. If the price turns down from the current level and slips below the 20-EMA, the selling could intensify and the pair may slide toward the 50-SMA. CAKE/USDTPancakeSwap (CAKE) recently bounced off the downtrend line, indicating that the bulls had flipped the level into support. The price broke above the 20-day EMA and is attempting to reach the 200-day SMA ($11.52).CAKE/USDT daily chart. Source: TradingViewThe 20-day EMA ($8.69) and the 50-day SMA ($7.71) are turning up gradually and the relative strength index is in the positive territory, suggesting that bulls have the upper hand. If buyers drive and sustain the price above the 200-day SMA, the CAKE/USDT pair could rise to $13.50 and later to $15.Contrary to this assumption, if the price turns down from the 200-day SMA, it will suggest that the bears have not yet given up and they continue to sell on rallies. The pair may then drop to the 20-day EMA. If the price rebounds off this support, it will increase the possibility of a break above the 200-day SMA. This positive view could invalidate if the price breaks below the 50-day SMA.CAKE/USDT 4-hour chart. Source: TradingViewThe moving averages on the 4-hour chart have turned up and the RSI is in the positive territory, indicating that bulls have the upper hand. If the price turns up from the current level or the 20-EMA, the buyers will try to push the pair above the psychological level at $10. If they succeed, the pair could pick up momentum.Contrary to this assumption, if the price turns down from the current level, the bears will attempt to pull the pair below the 20-EMA. If they do that, the pair may slide to the 50-SMA and later to the 200-SMA. A break and close below this support could suggest that the bears are back in the game.The views and opinions expressed here are solely those of the author and do not necessarily reflect the views of Cointelegraph. Every investment and trading move involves risk, you should conduct your own research when making a decision.

Čítaj viac

Price analysis 4/22: BTC, ETH, BNB, XRP, SOL, ADA, LUNA, AVAX, DOGE, DOT

Bitcoin (BTC) turned down sharply on April 21, maintaining its tight correlation with the U.S. equity markets, which reversed direction after U.S. Federal Reserve Chair Jerome Powell hinted that a 50 basis point rate hike was “on the table” in May. The selling has continued today as investors trim risky assets in expectation of an aggressive stance from central banks to curb surging inflation.Veteran trader Peter Brandt said in a tweet recently that the Nasdaq 100 (NDX) was showing a similar formation it made before plunging in the year 2000. If history repeats itself then the NDX could witness a sharp correction. That may be negative for the crypto markets in the short term because of the close correlation between Bitcoin and the NDX. Daily cryptocurrency market performance. Source: Coin360The subdued price action in cryptocurrencies and the weak-macro environment have resulted in reduced Google searches for the term Bitcoin and Ethereum. Even crypto trading volumes have been in a declining trend for some time. According to Blockchain.com, the total exchange volumes on major crypto exchanges plunged to $165.8 billion on April 19, the lowest level since October 2020.Could Bitcoin and altcoins continue their downward move or is it time for a relief rally? Let’s study the charts of the top-10 cryptocurrencies to find out.BTC/USDTBitcoin broke above the 50-day simple moving average ($41,977) on April 21 but the bulls could not sustain the higher levels as seen from the long wick on the day’s candlestick. The price reversed direction from $42,976 and settled below the 20-day exponential moving average ($41,478).BTC/USDT daily chart. Source: TradingViewThe selling has continued today and the bears are attempting to pull the price down to the support line of the ascending channel pattern. The downsloping 20-day EMA and the relative strength index (RSI) in the negative zone suggest that bears have the upper hand. If the price breaks below the support line of the channel, the selling could intensify and the BTC/USDT pair could drop to $33,000.Conversely, if the price turns up from the current level or the support line, it will suggest that bulls are actively buying at lower levels.The bulls will have to push and sustain the price above $43,000 to signal strength. The pair could then rise to the 200-day SMA ($47,965) and later challenge the resistance line of the channel.ETH/USDTEther (ETH) has been stuck between the 20-day EMA ($3,087) and the 50-day SMA ($3,003) for the past few days. Several efforts to break out of this tight range have been unsuccessful which suggests that bulls are buying on dips while bears are selling on rallies.ETH/USDT daily chart. Source: TradingViewThe downsloping 20-day EMA and the RSI in the negative territory give a slight edge to the sellers. If the price slips below $2,883, the possibility of a drop to the uptrend line of the developing ascending triangle pattern increases. The bulls are likely to mount a strong defense at this level. If the price rebounds off the uptrend line, the buyers will make another effort to propel the ETH/USDT pair above the 20-day EMA.If they succeed, the pair could rally to the 200-day SMA ($3,486). A break and close above this level will complete the ascending triangle pattern, resulting in a potential trend change.BNB/USDTThe long wick on the April 20 candlestick shows that bears are selling on rallies near the overhead resistance at $445. Binance Coin (BNB) continued to move down and broke below the 50-day SMA ($408) on April 21.BNB/USDT daily chart. Source: TradingViewIf bears sink the price below $391, the selling could accelerate and the BNB/USDT pair may drop to the strong support at $350. If the price rebounds off this level with strength, it will suggest that the pair could remain range-bound between $350 and the 200-day SMA ($471) for some more time. Alternatively, if the price rebounds off the strong support zone between the 50-day SMA ($408) and $391, the bulls will endeavor to drive the pair to $445 and then to the 200-day SMA. A break and close above this level could signal a potential trend change.XRP/USDTRipple (XRP) has been stuck in a range between $0.69 and $0.91 for the past few days. Although the price rebounded off the support of the range on April 12, the bulls could not clear the overhead hurdle at the 50-day SMA ($0.78), indicating a lack of demand at higher levels.XRP/USDT daily chart. Source: TradingViewThe bears will now strive to pull the XRP/USDT pair below the $0.69 support. If they manage to do that, the pair could drop to $0.62 and later to $0.54. The 20-day EMA ($0.76) has started to turn down and the RSI is in the negative zone, suggesting that the path of least resistance is to the downside.Alternatively, if the price rebounds off $0.69 with force, it will indicate strong accumulation by the bulls. The buyers will then again try to overcome the overhead barrier at $0.80 and push the pair to $0.91.SOL/USDTSolana (SOL) broke above the 20-day EMA ($105) on April 19 but the bulls could not sustain the higher levels. The bears pulled the price back below the 20-day EMA on April 20.SOL/USDT daily chart. Source: TradingViewThe selling has continued and the bears are trying to sustain the price below the 50-day SMA ($101). If that happens, the SOL/USDT pair could drop to the support line of the ascending channel. This is an important level to keep an eye on because if it gives way, the pair could drop to the strong support at $75.Contrary to this assumption, if the price bounces off the current level or the support line of the channel, the buyers will again try to push the pair above $111. If they can pull it off, the pair could rally to $122.ADA/USDT Cardano (ADA) has been consolidating in a downtrend. The price turned down from the 50-day SMA ($0.97) on April 21, indicating that the bears are aggressively defending the overhead resistance at $1.ADA/USDT daily chart. Source: TradingViewThe downsloping 20-day EMA ($0.97) and the RSI below 40 indicate that bears have the upper hand. If sellers sink the price below $0.87, the selling could pick up momentum and the ADA/USDT pair could drop to the critical support at $0.74. This is an important level for the bulls to defend because if it cracks, the downtrend may resume.The bulls will have to push and sustain the price above $1 to indicate that the bears may be losing their grip. The pair could then rise to $1.10 and later attempt a rally to the stiff overhead resistance at $1.26.LUNA/USDTTerra’s LUNA token turned down from the psychological resistance at $100 on April 21 but a minor positive is that the bulls have not allowed the price to sustain below the 20-day EMA ($91).LUNA/USDT daily chart. Source: TradingViewThe buyers will now again attempt to push the LUNA/USDT pair above $100. If that happens, the bullish momentum could pick up and the pair may rally toward the all-time high at $119. The bears are likely to mount a strong defense at this level.On the other hand, if the price turns down from the current level or the overhead resistance at $100, the prospects of a break below the support at $88 increase. If the price sustains below this level, the pair could drop to the strong support at $75. A break and close below the 200-day SMA ($68) could signal a potential trend change.Related: Bitcoin follows fresh US stocks dive as analysis ‘expects’ BTC price to take $37.5K liquidityAVAX/USDTAvalanche (AVAX) had been trading between the 20-day EMA ($80) and the uptrend line for the past few days. Usually, such tight-range trading results in a sharp trending move.AVAX/USDT daily chart. Source: TradingViewThe downsloping 20-day EMA and the RSI in the negative territory indicate that bears have an edge. If the price sustains below the uptrend line, the developing ascending triangle pattern will invalidate. That could sink the AVAX/USDT pair to the strong support at $65. Alternatively, if the pair rises from the current level, the buyers will make one more attempt to push the price above the moving averages. If they succeed, the pair could rally to the overhead resistance zone at $99 to $104.DOGE/USDTDogecoin (DOGE) has been range-bound in a downtrend. The price turned down from $0.15 on April 20 and plunged to the 50-day SMA ($0.13) on April 21. This suggests that demand dries up at higher levels.DOGE/USDT daily chart. Source: TradingViewThe repeated retest of a support level tends to weaken it. If the price breaks below the 50-day SMA, the bears will attempt to pull the DOGE/USDT pair to the strong support at $0.12. The bulls are expected to defend this level with vigor but if the support gives way, the decline could extend to the critical level at $0.10.On the contrary, if the price rebounds off the 50-day SMA, the bulls will try to push the pair above the overhead resistance at $0.15. If they manage to do that, the pair could rise to the overhead resistance at $0.17.DOT/USDTPolkadot (DOT) has been range-bound inside a large range between $16 and $23 for the past several days. The bulls pushed the price above the 50-day SMA ($19) on April 20 and 21 but could not sustain the higher levels. DOT/USDT daily chart. Source: TradingViewThis suggests that bears are selling on rallies. If the price slips below the immediate support at $18, the DOT/USDT pair could decline to $17. The gradually downsloping 20-day EMA ($19) and the RSI just below the midpoint suggest a slight advantage to sellers.Alternatively, if bulls push and sustain the price above the 50-day SMA, the pair could attempt a rally to the overhead resistance at $23. The bulls will have to clear this hurdle to suggest the start of a new up-move.The views and opinions expressed here are solely those of the author and do not necessarily reflect the views of Cointelegraph. Every investment and trading move involves risk. You should conduct your own research when making a decision.Market data is provided by HitBTC exchange.

Čítaj viac

Získaj BONUS 8 € v Bitcoinoch

nakup bitcoin z karty

Registrácia Binance

Burza Binance

Aktuálne kurzy