Autor Cointelegraph By Rakesh Upadhyay

Price analysis 6/8: BTC, ETH, BNB, ADA, XRP, SOL, DOGE, DOT, AVAX, SHIB

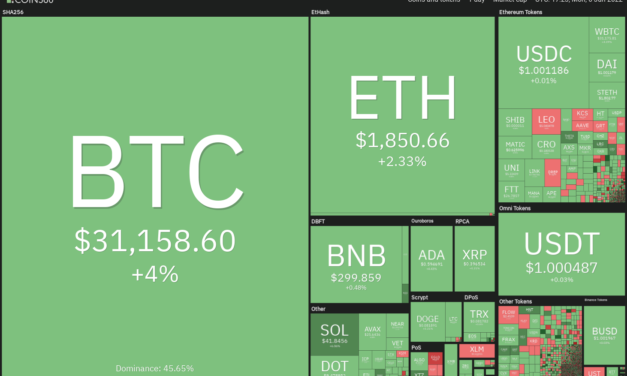
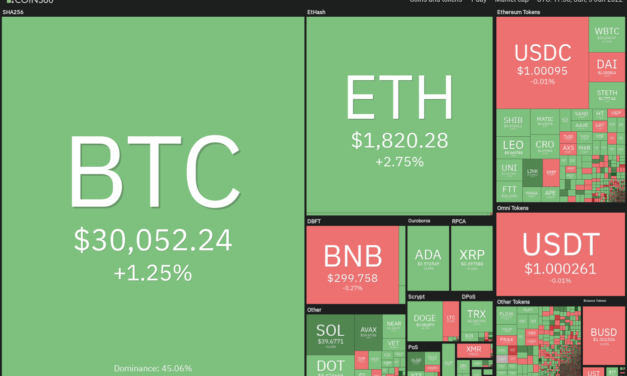
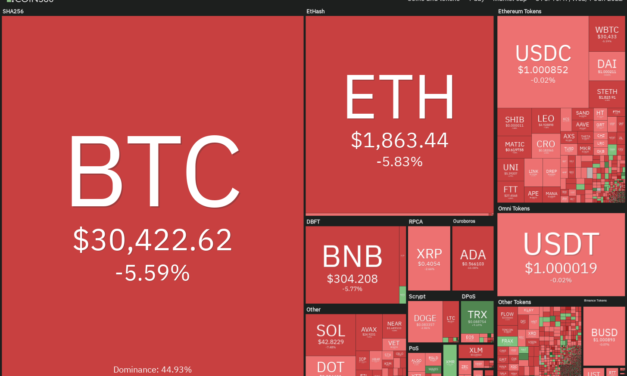
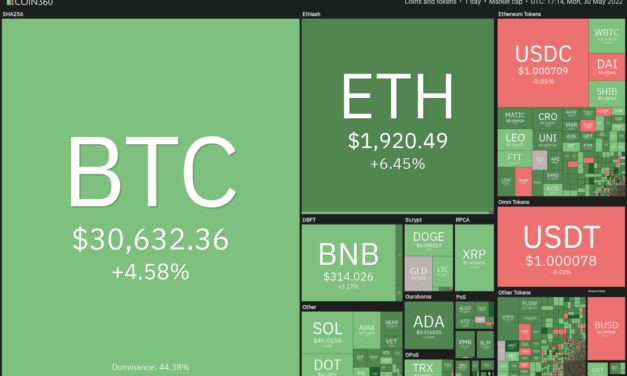
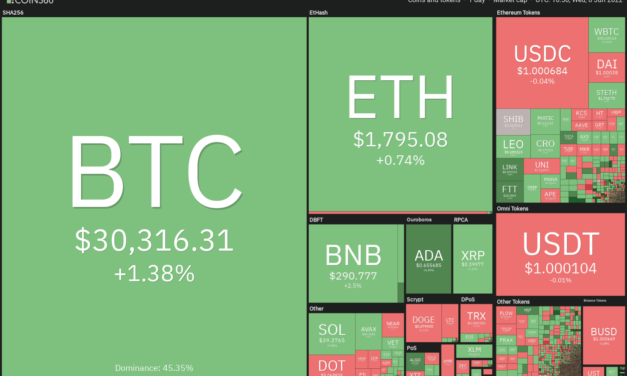
Bitcoin (BTC) continues to trade in a range with the local tops and bottoms coinciding with increased whale activity in the region, according to on-chain analytics resource Whalemap.The range-bound action in Bitcoin has kept the analysts guessing and a few expect the consolidation to continue for some more time, while others anticipate another leg lower.A June 6 Glassnode report said that the aggregated realized losses from long-term holders reflected more than 0.006% of the market capitalization on May 29. This is in comparison to the peak of 0.015% of the market capitalization reached during the 2018 to 2019 bear market.Daily cryptocurrency market performance. Source: Coin360Along with the quantum of losses, investors may also have to be prepared for a longer duration of subdued prices. The duration of the current loss for long-term investors is only one month old, while the previous losses remained roughly for a year.Could the lackluster trading action in Bitcoin and other major altcoins continue? Let’s study the charts of the top-10 cryptocurrencies to find out.BTC/USDTBitcoin plunged below the 20-day exponential moving average (EMA) ($30,565) on June 7 but a positive sign is that the bulls aggressively purchased the dip to the trendline of the ascending triangle pattern. This resulted in a strong recovery as seen from the long tail on the day’s candlestick. The ascending triangle pattern remains intact favoring the buyers.BTC/USDT daily chart. Source: TradingViewHowever, a minor negative is that the bulls could not build upon the momentum on June 8. This gave an opportunity to the bears who have again pulled the price back below the 20-day EMA. This suggests that bears continue to sell in the zone between the 20-day EMA and $32,659.If bears sink the price below the trendline, the BTC/USDT pair could drop to $28,630 where buying may emerge. If that happens, it will suggest that the pair may remain range-bound between $32,659 and $28,630 for a few more days.The next directional move is likely to begin on a break above $32,659 or below $28,630. Until then, volatile range-bound action is likely to continue.ETH/USDTEther (ETH) turned down from the 20-day EMA ($1,908) on June 6, indicating that bears are not willing to cede ground to the bulls. The sellers then tried to sink the price below the critical support of $1,700 on June 7 but the long tail on the candlestick shows aggressive buying by the bulls near the support.ETH/USDT daily chart. Source: TradingViewThe price is currently coiling between the downsloping 20-day EMA and $1,700. This is likely to result in a range expansion that could set the stage for the next directional move.If buyers drive the price above the 20-day EMA, the ETH/USDT pair could rally to $2,159. The bears may again mount a strong defense at this level. If the price turns down from it, the pair may spend some time inside the $2,159 to $1,700 range.A break above $2,159 will be the first sign that the pair may have bottomed out while a break below $1,700 could signal the resumption of the downtrend.BNB/USDTBNB turned down from the resistance line of the symmetrical triangle pattern on June 6 and plunged below the support line. This suggests that the bears continue to sell aggressively at higher levels.BNB/USDT daily chart. Source: TradingViewThe bears pulled the price below the immediate support at $286 on June 7 but the long wick on the day’s candlestick shows strong buying at lower levels. The bulls are attempting to push the price back above the support line on June 8. If they manage to do that, the BNB/USDT pair could try to rise above the resistance line and trap the aggressive bears. Conversely, if the price turns down from the current level, it will suggest that the bears have flipped the support line into resistance. That could increase the possibility of a drop to $265.ADA/USDT The long wick on Cardano’s (ADA) June 6 and 7 candlestick shows that bears are selling the rallies to the 50-day simple moving average (SMA) ($0.65). Although bears tried to pull the price below the 20-day EMA ($0.58) on June 7, the bulls held their ground.ADA/USDT daily chart. Source: TradingViewThe buyers are again attempting to push the price above the 50-day SMA. If they succeed, the ADA/USDT pair could rally to the breakdown level of $0.74. This is an important level for the bears to defend because a break and close above it could suggest a potential change in trend. The pair could then rally toward the psychological level of $1.Contrary to this assumption, if the price turns down from the 50-day SMA or $0.74, the bears will attempt to pull the pair below the 20-day EMA and gain the upper hand.XRP/USDTRipple (XRP) formed an outside-day candlestick pattern on June 7, with the price rebounding off the strong support at $0.38 and closing near the overhead resistance at the downtrend line.XRP/USDT daily chart. Source: TradingViewHowever, buyers could not build upon this move and push the price above the downtrend line on June 8. This suggests that bears continue to sell near resistance levels. The bears will again attempt to sink the price below $0.38.If they succeed, the XRP/USDT pair will complete a descending triangle pattern. That could result in a decline to the May 12 intraday low of $0.33. If this support cracks, the next stop could be the pattern target of $0.30.This negative view could be invalidated in the short term if bulls propel the price above the 20-day EMA. The pair could then rally to $0.46.SOL/USDTSolana’s (SOL) attempt to start a recovery met with stiff resistance at the 20-day EMA ($45), which suggests that the trend remains negative and traders are selling on rallies.SOL/USDT daily chart. Source: TradingViewThe bears will try to pull the price below the crucial support zone between $37 and $35. If they manage to do that, the SOL/USDT pair could resume its downtrend. The pair could then decline to $30.On the contrary, if the price rebounds off the support zone, it will suggest that bulls are accumulating at lower levels. A break above the 20-day EMA will be the first sign that the selling pressure may be reducing. The pair could then rise to $50 and later to $60.DOGE/USDTDogecoin (DOGE) once again turned down from the 20-day EMA ($0.08) on June 6, indicating that bears are selling on rallies. A minor positive is that the bulls purchased the dip on June 7, indicating buying at lower levels.DOGE/USDT daily chart. Source: TradingViewThe DOGE/USDT pair has been stuck in a tight range between the 20-day EMA and $0.07, indicating uncertainty among the bulls and the bears. Usually, tight ranges resolve with an expansion but it is difficult to predict the direction of the breakout.If the price rises above the 20-day EMA, buyers who may be waiting on the sidelines could enter and push the pair toward the psychological level of $0.10. On the contrary, if the price slips below $0.07, the pair may resume the downtrend.Related: Ethereum ‘double Doji’ pattern hints at a 50% ETH price rally by SeptemberDOT/USDTPolkadot (DOT) attempted to rise above the 20-day EMA ($10) on June 6 but the long wick on the day’s candlestick shows strong selling by the bears.DOT/USDT daily chart. Source: TradingViewThe DOT/USDT pair dipped below the support line on June 7, indicating that the symmetrical triangle resolved in favor of the sellers. The pair could next drop to the strong support at $8.50 where the buyers will try to stall the decline.This negative view could invalidate in the short term if the price turns up from the current level and rises above the resistance line of the triangle. Such a move will suggest that the break below the support line may have been a bear trap. The pair could then rise to the 50-day SMA ($12.35).AVAX/USDTThe buyers tried to push Avalanche (AVAX) above the 20-day EMA ($28) on June 6 but the long wick on the day’s candlestick shows that the bears are defending the level aggressively.AVAX/USDT daily chart. Source: TradingViewThe price is getting squeezed between the 20-day EMA and the strong support at $21 but this tight range trading is unlikely to continue for long. If bulls drive the AVAX/USDT pair above the 20-day EMA, it will suggest the start of a recovery that may reach $37. The positive divergence on the relative strength index (RSI) also supports a relief rally in the near term.Alternatively, if the range expands to the downside and the price plummets below $21, the pair could resume its downtrend and drop to $18.SHIB/USDTThe bears tried to sink Shiba Inu (SHIB) below the strong support of $0.000010 on June 7 but the bulls successfully defended the level as seen from the long tail on the day’s candlestick.SHIB/USDT daily chart. Source: TradingViewThe longer the price trades below the 20-day EMA ($0.000012), the greater the possibility of a break below $0.000010. If that happens, the SHIB/USDT pair could drop to $0.000009 where the bulls may attempt to stall the decline. To invalidate the bearish view, the bulls will have to push and sustain the price above the 20-day EMA. If they manage to do that, the pair could rally to $0.000014 where the bears are likely to mount a strong defense.The views and opinions expressed here are solely those of the author and do not necessarily reflect the views of Cointelegraph. Every investment and trading move involves risk. You should conduct your own research when making a decision.Market data is provided by HitBTC exchange.

Čítaj viac

Price analysis 6/6: BTC, ETH, BNB, XRP, ADA, SOL, DOGE, DOT, AVAX, SHIB

After nine successive weeks of red weekly candles, Bitcoin (BTC) printed a green weekly candle on June 5. Leading into this week, buyers kept up their momentum with a strong weekly open that boosted BTC price to $31,800.Going forward, traders might keep a close eye on the Consumer Price Index (CPI) data for May, which is due on June 10. Depending on the figures, this could keep the volatility elevated as investors digest the report and speculate on the next possible move of the United States Federal Reserve.Daily cryptocurrency market performance. Source: Coin360Analysts are divided about the next directional move for Bitcoin. While some believe a bottom has been made, others anticipate another leg down. For analyst Bob Loukas, the price action in the summer could remain uninteresting and he expects the new cycle to begin late in the year.Could bulls sustain higher levels or will bears sell aggressively and pull the price down? Let’s study the charts of the top-10 cryptocurrencies to find out.BTC/USDTAfter two small range days on June 4 and 5, the range expanded on June 6 and Bitcoin soared above the 20-day exponential moving average (E($30,510). The bulls are attempting to push the price to the overhead resistance at $32,659.BTC/USDT daily chart. Source: TradingViewThe price action of the past few days has formed an ascending triangle pattern, which will complete on a break and close above $32,659. If that happens, the BTC/USDT pair could start a new up-move. The pattern target of the breakout from the triangle is $38,618.The 20-day EMA has flattened out and the relative strength index (RSI) is near the midpoint, suggesting that the selling pressure is reducing.This positive view could invalidate if the price turns down sharply and plunges below the trendline of the triangle. The pair could then drop to the strong support at $28,630 where the bulls may try to arrest the decline. A break and close below this support could tilt the advantage in favor of the bears.ETH/USDTEther (ETH) bounced off $1,737 on June 3, indicating that bulls are attempting to defend the crucial support of $1,700. The buyers are attempting to push the price above the overhead resistance at the 20-day EMA ($1,930) on June 6.ETH/USDT daily chart. Source: TradingViewIf they succeed, the ETH/USDT pair could pick up momentum and rally to $2,016. Above this level, the pair could reach the stiff overhead resistance at $2,159. The bears are likely to defend this level aggressively. If the price turns down from this resistance, the pair could consolidate between $2,159 and $1,700 for a few more days.The long wick on the June 6 candlestick suggests that bears continue to defend the 20-day EMA. This indicates that the sentiment remains negative and traders are selling on rallies. The bears will now try to pull the pair below $1,700 and resume the downtrend.BNB/USDTBNB has formed a symmetrical triangle pattern, indicating indecision among the bulls and the bears. The bulls are attempting to push the price above the resistance line but the bears are not willing to cede ground.BNB/USDT daily chart. Source: TradingViewIf the price turns down from the overhead resistance, the bears will again try to pull the BNB/USDT pair below the support line. If they manage to do that, the pair could decline to $265 where buying may emerge.Alternatively, if bulls push and sustain the price above the resistance line, it will suggest that the sellers are losing their grip. The pair could then rally to the breakdown level of $350. This is an important level to keep an eye on because a break and close above it could signal that the downtrend may be over.XRP/USDTRipple (XRP) has been trading inside a bearish descending triangle pattern. The bulls are attempting to push the price above the downtrend line but the bears are posing a strong challenge as seen from the long wick on the day’s candlestick.XRP/USDT daily chart. Source: TradingViewIf bulls propel the price above the downtrend line, it will negate the bearish pattern. That could cause a short squeeze, pushing the XRP/USDT pair to $0.46 and later to the psychological level at $0.50.Conversely, if the price turns down from the downtrend line, the pair could drop to the $0.38 support. If bears pull the price below $0.38, the descending triangle pattern will complete. The pair could then decline to the important support at $0.33. A break and close below this support could resume the downtrend.ADA/USDT Cardano (ADA) had been sustaining above the 20-day EMA ($0.56) for the past few days suggesting accumulation by the bulls. Buying picked up on June 6 and the bulls are trying to push the price above the 50-day SMA ($0.66).ADA/USDT daily chart. Source: TradingViewIf they succeed, the ADA/USDT pair could rally to the breakdown level of $0.74. This level may again act as a major hurdle but if the bulls overcome it, the recovery could pick up momentum. The pair could then rally to $0.90.The 20-day EMA has flattened out and the RSI is just above the midpoint, suggesting a slight edge to buyers. This bullish view could invalidate in the short term if the price turns down and breaks below the 20-day EMA. If that happens, the pair could gradually slide toward the strong support at $0.44. SOL/USDTSolana (SOL) plunged below the critical support of $37 on June 4 but a minor positive is that the bulls purchased at lower levels. This may have caught the aggressive bears off-guard, which resulted in a strong recovery as seen from the long tail on the day’s candlestick.SOL/USDT daily chart. Source: TradingViewThe RSI has formed a positive divergence, indicating that the bearish momentum may be reducing. The bulls are attempting to push the price above the 20-day EMA ($46). If they succeed, the SOL/USDT pair could rally to $55 and thereafter to $60.On the contrary, if the price turns down from the 20-day EMA, it will suggest that the trend remains negative and bears are selling on rallies. The bears will then make one more attempt to resume the downtrend by pulling the pair below $35.DOGE/USDTDogecoin (DOGE) is stuck between the 20-day EMA ($0.08) and $0.08 for the past few days but this tight range trading is unlikely to continue for long.DOGE/USDT daily chart. Source: TradingViewIf buyers push the price above the 20-day EMA, the DOGE/USDT pair could rally toward the psychological resistance at $0.10. This level may again act as a hurdle but if bulls overcome it, the pair could rally to $0.12.Contrary to this assumption, if the price turns down from the 20-day EMA, it will suggest that bears continue to sell on minor rallies. If bears sink the price below $0.08, the pair could drop to $0.07. A break and close below this support will suggest the resumption of the downtrend.Related: Is Cardano ready for a go at $1? June’s hard fork FOMO lifts ADA price to weekly highsDOT/USDTPolkadot (DOT) has formed a symmetrical triangle, which usually acts as a continuation pattern. The buyers are attempting to push the price above the 20-day EMA ($10) and challenge the resistance line of the triangle.DOT/USDT daily chart. Source: TradingViewA break and close above the triangle will be the first indication of a potential trend change. The DOT/USDT pair could rise to $12 and then attempt a rally to the breakdown level of $14. The bears are likely to defend this level aggressively.Alternatively, if the price turns down from the overhead resistance and breaks below the triangle, it will suggest that bears are in control. The pair could then decline to $8 and later retest the May 12 intraday low of $7.30.AVAX/USDTAvalanche (AVAX) bounced off $22.14 on June 4, indicating that bulls are defending the $21.35 support with vigor. The buyers have pushed the price above the downtrend line and are attempting to clear the overhead hurdle at the 20-day EMA ($28).AVAX/USDT daily chart. Source: TradingViewIf they manage to do that, the AVAX/USDT pair could pick up momentum and start its northward journey toward $33 and then $37. Such a move will suggest that the bulls are back in the game.Contrary to this assumption, if the price turns down from the 20-day EMA, it will suggest that bears remain active at higher levels. The pair could then slide toward $21.35. A break and close below this support could start the next leg of the downtrend.SHIB/USDTThe buyers have successfully defended the $0.000010 support for the past several days but they have not been able to push Shiba Inu (SHIB) above the 20-day EMA ($0.000012). This suggests that buying dries up at higher levels.SHIB/USDT daily chart. Source: TradingViewThe tight range trading between $0.000010 and the 20-day EMA is unlikely to continue for long. If bears sink the price below $0.000010, the SHIB/USDT pair could retest the May 12 intraday low at $0.000009. A break and close below this level could signal the resumption of the downtrend.Alternatively, if buyers propel the price above the 20-day EMA, the pair could rally to the overhead resistance at $0.000014. The bears are expected to mount a strong defense at this level. The views and opinions expressed here are solely those of the author and do not necessarily reflect the views of Cointelegraph. Every investment and trading move involves risk. You should conduct your own research when making a decision.Market data is provided by HitBTC exchange.

Čítaj viac

Top 5 cryptocurrencies to watch this week: BTC, ADA, XLM, XMR, MANA

The bears are trying to extend Bitcoin’s (BTC) record of nine consecutive red weekly candles to ten weeks, but the bulls are trying to avert this negative occurrence. Although sentiment remains negative, Arthur Hayes, former CEO of derivatives giant BitMEX, anticipates Bitcoin to bottom out in the range of $25,000 to $27,000.On-chain data from Glassnode shows that smart money may have started accumulating Bitcoin. The net outflows from major cryptocurrency exchanges reached 23,286 Bitcoin on June 3, the highest since May 14.Crypto market data daily view. Source: Coin360Another positive sign of accumulation is that investment into Bitcoin exchange-traded products (ETPs) was strong in May and has only risen further in the first two days of June, according to an Arcane Research report. The ETPs hold 205,000 Bitcoin under management, which is a new record.Could Bitcoin turn up and start a recovery? If that happens, could select altcoins follow the leader? Let’s study the charts of the top-5 cryptocurrencies that may lead the relief rally.BTC/USDTBitcoin plunged below the 20-day exponential moving average ($30,459) on June 1. The bulls attempted to push the price back above the 20-day EMA on June 2 and June 3 but the bears did not relent. BTC/USDT daily chart. Source: TradingViewThe bears will try to pull the price below the strong support at $28,630. If they manage to do that, the BTC/USDT pair could drop to the vital support at $26,700. The buyers are expected to defend this support zone with all their might because if they fail to do that, the downtrend may resume.On the upside, the bulls will have to push and sustain the price above $32,659 to suggest that a new uptrend could be starting. The bullish momentum could pick up on a break and close above the 50-day simple moving average ($33,778). The pair could then rally to the pattern target of $36,688 and thereafter to $40,000.BTC/USDT 4-hour chart. Source: TradingViewThe 4-hour chart shows that the price action is getting squeezed. Although bulls pushed the price above the 20-EMA, they are facing stiff resistance at the 50-SMA. This suggests that bears are active at higher levels.A minor positive in favor of the bulls is that they have not allowed the price to break below the support at $29,282. If the price rises from the current level and breaks above the downtrend line, the bulls will attempt to push the pair to the 200-SMA. Conversely, if the price breaks below $29,282, the next stop could be $28,630.ADA/USDTCardano (ADA) broke above the downtrend line on May 31 but the bulls could not sustain the higher levels as seen from the long wick on the day’s candlestick. ADA/USDT daily chart. Source: TradingViewAlthough the bears have successfully defended the downtrend line, a minor positive is that the bulls have held the ADA/USDT pair above the 20-day EMA ($0.56). This increases the possibility of a break above the downtrend line. If that happens, the pair could rally to the 50-day SMA ($0.67) where the bears may again pose a strong challenge. A break and close above this level will suggest a potential change in trend. The pair could then rally to the breakdown level of $0.74.Contrary to this assumption, if the price turns down and plummets below $0.53, the bears will try to pull the pair to $0.50 and later to $0.44.ADA/USDT 4-hour chart. Source: TradingViewThe 4-hour chart shows that the price has been squeezed between the 200-SMA and the 50-SMA but this tight range trading is unlikely to continue for long. If bulls propel the price above the 200-SMA, the pair could attempt a rally to $0.64. A break and close above this level could open the doors for a possible rally to $0.69.Conversely, if the price turns down and breaks below $0.53, the selling could pick up momentum. The pair may then decline to $0.50 and later to $0.47.XLM/USDTStellar (XLM) rallied above the 20-day EMA ($0.14) on May 30, which was the first indication that the selling pressure may be reducing. The bears stalled the up-move near the 50-day SMA ($0.15) but they haven’t been able to sink and sustain the price below the 20-day EMA.XLM/USDT daily chart. Source: TradingViewThis suggests that the bulls are buying the dips to the 20-day EMA. If bulls drive the price above the 50-day SMA, it will suggest the start of a sustained recovery. The XLM/USDT pair could then attempt a rally to $0.18 and later to the 200-day SMA ($0.21).This positive view will invalidate in the short term if the price turns down and breaks below $0.13. Such a move will suggest that demand dries up at higher levels. That could pull the pair down to $0.12. If this support also gives way, the bears will try to resume the downtrend by sinking the pair below the psychological level of $0.10.XLM/USDT 4-hour chart. Source: TradingViewThe 4-hour chart shows the price is trading inside a symmetrical triangle. If bulls push the price above the resistance line of the triangle, the pair could rally to $0.15 and thereafter attempt a rally to the pattern target of $0.17.Alternatively, if the price turns down from the current level, the bears will try to sink the pair below the support line of the triangle. If they do that, the selling could intensify and the pair may slide to the strong support at $0.13.Related: 3 reasons Ethereum price risks 25% downside in JuneXMR/USDTMonero’s (XMR) failure to rise above the 50-day SMA ($202) may have tempted short-term traders to book profits. That has pulled the price down to the 20-day EMA ($189).XMR/USDT daily chart. Source: TradingViewThe bulls are attempting to defend the 20-day EMA but the lack of a strong bounce off it suggests weak demand. If the price sustains below the 20-day EMA, the next stop could be the uptrend line. A break and close below this support could pull the price down to $167.On the contrary, if the price rebounds off the current level, the buyers will attempt to overcome the resistance zone between the 50-day SMA and $210. If they manage to do that, the XMR/USDT pair could extend its rally to $230.XMR/USDT 4-hour chart. Source: TradingViewThe pair has been declining inside a descending channel, suggesting a minor advantage to sellers. If bears sink the price below the channel, the negative momentum may pick up and the pair could slide to $167.Alternatively, if the price rebounds off the support line, the buyers will try to propel the pair above the channel. If they manage to do that, the pair could again attempt a break above the overhead resistance at $210.MANA/USDTDecentraland (MANA) has failed to break above the 20-day EMA ($1.06) for the past several days but a minor positive is that the bulls have not given up much ground. This suggests that the bulls are buying on dips as they anticipate a move higher.MANA/USDT daily chart. Source: TradingViewIf bulls propel the price above the 20-day EMA, it will suggest that the bears are losing their grip. The MANA/USDT pair could then rise to the overhead resistance at $1.36. This is an important level to keep an eye on because a break and close above it could signal that a bottom may be in place. The pair could then rally to $1.68.Conversely, if the price turns down and breaks below $0.90, it will suggest that the bears are in no mood to surrender their advantage. The pair could then retest the crucial support at $0.60. The bears will have to pull the price below this support to indicate the resumption of the downtrend.MANA/USDT 4-hour chart. Source: TradingViewThe 4-hour chart shows that the pair has been trading inside a tight range between $0.94 and $1.04. The gradually downsloping 20-EMA and the RSI in the negative territory suggest a slight advantage to sellers. If bears pull the price below $0.94, the pair could drop to $0.90. On the contrary, if bulls push the price above $1.04, it will suggest that demand exceeds supply. That could open the doors for a possible rally to the stiff overhead resistance at $1.15. If the price turns down from this level, the pair may oscillate between $0.90 and $1.15 for some more time. A break and close above $1.15 could suggest that buyers have the upper hand.The views and opinions expressed here are solely those of the author and do not necessarily reflect the views of Cointelegraph. Every investment and trading move involves risk, you should conduct your own research when making a decision.

Čítaj viac

Price analysis 6/1: BTC, ETH, BNB, XRP, ADA, SOL, DOGE, DOT, AVAX, SHIB

Bitcoin (BTC) has made a tentative start to the month of June, suggesting that bears have not gone into hibernation just yet. Although Bitcoin is trading nearly 55% off its all-time high of $69,000, whales and institutions remain cautious and have not jumped into the market with gusto, according to BlockTrends analyst Caue Oliveira.According to CryptoQuant contributor Venturefounder, if Bitcoin repeats the historical patterns seen after the previous halving cycles, then a bottom may be formed between $14,000 and $21,000 in the next six months. Thereafter, Bitcoin may chop around the $28,000 to $40,000 range for a large part of the next year and be around $40,000 during the halving.Daily cryptocurrency market performance. Source: Coin360Crypto’s bear market has not stopped Goldman Sachs from exploring the possibility of integrating its derivatives products into FTX.US derivatives offerings. This suggests that the investment bank expects derivatives demand to pick up in the future.Has Bitcoin started a bottoming formation? Is the short-term downtrend in altcoins over? Let’s study the charts of the top-10 cryptocurrencies to find out.BTC/USDTBitcoin reached the overhead resistance at $32,659 on May 31 but the bulls could not clear this hurdle. The Doji candlestick pattern on May 31 indicates uncertainty among the buyers and sellers.BTC/USDT daily chart. Source: TradingViewThis uncertainty resolved in favor of the bears on June 1 and they pulled the price below the 20-day exponential moving average (EMA) ($30,741). If the price sustains below the 20-day EMA, the next stop could be $28,630. The buyers are expected to defend this level with all their might.If the price rebounds off $28,600, the BTC/USDT pair could again attempt a rally to $32,659. If that happens, the pair may consolidate between these two levels for a few days.The next trending move could begin if the price breaks above or below the range. If the price soars above $32,659, the rally could reach the 50-day simple moving average (SMA) ($34,629). The downtrend could resume on a break below the $28,630 to $26,700 support zone.ETH/USDTThe bears stalled Ether’s (ETH) relief rally at the 20-day EMA ($2,009) on May 31, indicating that they are not allowing the bulls to get a foothold.ETH/USDT daily chart. Source: TradingViewThe bears will try to pull the price to the vital support at $1,700. This is an important level for the bulls to defend because if it cracks, the ETH/USDT pair could witness panic selling. The pair could then resume its downtrend and plummet to $1,300.Alternatively, if the price rebounds off $1,700, it will suggest that the bulls are buying proactively at these levels. The bulls will then again try to push the price above the 20-day EMA and challenge the stiff resistance at $2,159.BNB/USDTBNB rose above the immediate resistance of $320 on May 30 but the bulls have not been able to build upon this move. This indicates that bears are posing a strong challenge at $325.BNB/USDT daily chart. Source: TradingViewThe sellers have pulled the price to the uptrend line. This is an important level to keep an eye on in the near term. If the price rebounds off this level, it will suggest that bulls are accumulating on dips. That could enhance the prospects of a break above $325. Contrary to this assumption, if bears sink the price below the uptrend line, the BNB/USDT pair could drop to the strong support zone between $286 and $265. A break below $265 could send the pair tumbling to the vital support at $211.XRP/USDTRipple (XRP) rose above the downtrend line on May 30 but the bulls could not clear the overhead hurdle at the 20-day EMA ($0.43). This suggests that bears are not willing to surrender their advantage.XRP/USDT daily chart. Source: TradingViewThe bears will try to sink the price below the downtrend line. If that happens, the XRP/USDT pair could decline to $0.38. The buyers are likely to defend this level and a bounce off it will point to a possible consolidation in the near term.On the contrary, if the price rebounds off the downtrend line, it will suggest that bulls are attempting to flip this level to support. If that happens, the possibility of a break above the 20-day EMA increases. The pair could then rally to the psychological resistance at $0.50.ADA/USDT Cardano (ADA) broke above the 20-day EMA ($0.56) on May 30 and followed it up with another sharp up-move on May 31. This pushed the price to the 50-day SMA ($0.70) but the long wick on the day’s candlestick suggests that bears are selling near this level.ADA/USDT daily chart. Source: TradingViewThe bears will try to pull the price back below the 20-day EMA and trap the aggressive bulls. If that happens, the ADA/USDT pair could drop to $0.44 where buying may emerge. That could suggest a consolidation inside the large range between $0.44 and $0.74. The flattening 20-day EMA and the relative strength index (RSI) just below the midpoint also indicate a range-bound action in the near term.The bulls may gain the upper hand if the price rebounds off the 20-day EMA and breaks above $0.74. Such a move will suggest that the downtrend may be over.SOL/USDTSolana’s (SOL) relief rally is facing stiff resistance from the bears near the psychological level at $50. This suggests that bears have not yet given up and they continue to sell on rallies.SOL/USDT daily chart. Source: TradingViewThe bears will try to pull the price to the strong support at $40. The bulls are expected to buy the dips to this level. If the price rebounds off this support, the buyers will again try to push the SOL/USDT pair above the 20-day EMA ($51). If they succeed, the pair could rally to $60 and thereafter attempt an up-move to the breakdown level of $75.On the other hand, if bears sink the price below $40, the pair could drop to the May 12 intraday low of $37. The pair could resume its downtrend if bears pull the price below this crucial support.DOGE/USDTDogecoin’s (DOGE) price has been trading near the 20-day EMA ($0.09) for the past two days but the bulls have failed to achieve a breakout. This suggests that bears are defending the 20-day EMA with vigor.DOGE/USDT daily chart. Source: TradingViewThe bears will try to sink the price to the strong support at $0.07. This level has held on two previous occasions; hence, the bulls will again try to defend it. If the price rebounds off this support, the DOGE/USDT pair may remain stuck inside a range between $0.10 and $0.07 for some time.If bulls drive the price above $0.10, it will suggest that the downtrend could be weakening. The pair could then rally to $0.12. Conversely, the downtrend could resume on a break below $0.07.Related: Axie Infinity V-shape recovery fizzles as AXS price drops 20% from three-week highDOT/USDTPolkadot (DOT) is facing resistance at the 20-day EMA ($10.55) but the bulls have not allowed the price to sustain below $10. This suggests strong demand at lower levels.DOT/USDT daily chart. Source: TradingViewIf bulls push and sustain the price above the 20-day EMA, the DOT/USDT pair could rally to $12. This level may act as a minor hurdle but if crossed, the recovery could reach the strong overhead resistance at $14.Contrary to this assumption, if the price turns down and sustains below $10, the decline could extend to the strong support at $8. A strong bounce off this support will suggest that the pair may remain range-bound between $8 and $12 for some time.AVAX/USDTAvalanche (AVAX) turned down from the downtrend line on May 31, suggesting that bears continue to defend the level with vigor. The bears will now try to pull the price below the strong support zone of $23.51 to $21.35.AVAX/USDT daily chart. Source: TradingViewIf they succeed, the AVAX/USDT pair will complete a descending triangle pattern, indicating the start of the next leg of the downtrend. The pair could then decline to $20.Although the downsloping 20-day EMA ($31.33) favors the bears, the positive divergence on the RSI suggests that the bearish momentum may be weakening. If the price turns up from the current level and breaks above the 20-day EMA, buying could resume. The bulls will then try to propel the pair to $38. SHIB/USDTShiba Inu’s (SHIB) recovery is facing stiff resistance at the 20-day EMA ($0.000012), suggesting that the sentiment remains negative and bears are selling on rallies.SHIB/USDT daily chart. Source: TradingViewThe bears will try to pull the price to the strong support at $0.000010. This level is likely to attract aggressive buying by the bulls. If the price rebounds off $0.000010, the SHIB/USDT pair could rally toward the 20-day EMA.If buyers push the price above the 20-day EMA, the pair could rise to $0.000014 and later to the breakdown level of $0.000017. On the downside, the bears will have to sink the price below $0.000009 to signal the resumption of the downtrend.The views and opinions expressed here are solely those of the author and do not necessarily reflect the views of Cointelegraph. Every investment and trading move involves risk. You should conduct your own research when making a decision.Market data is provided by HitBTC exchange.

Čítaj viac

Price analysis 5/30: BTC, ETH, BNB, XRP, ADA, SOL, DOGE, DOT, AVAX, SHIB

After creating the dubious record of nine successive red weekly closes, Bitcoin (BTC) is attempting to make amends by starting a price recovery to end the losing streak. Analysts have repeatedly said that investors should not fear a bear market because it is one of the best times to invest in fundamentally strong projects in preparation for the next bull phase. CryptoQuant CEO Ki Young Ju highlighted that unspent transaction outputs (UTXOs) that are older than six months reflect 62% of the realized cap, which is similar to the level seen during the March 2020 crash. Hence, Ki said that Bitcoin may be close to forming a cyclic bottom.Daily cryptocurrency market performance. Source: Coin360In the current bearish environment, it is difficult to fathom a Bitcoin rally to $250,000 but billionaire investor Tim Draper is still bullish. While speaking on a YouTube show on May 24, Draper said that if more retailers start accepting Bitcoin, participation from women will increase as they will buy things with Bitcoin. According to Draper, this could boost Bitcoin’s price above his target objective of $250,000.With several analysts calling for a bottom in Bitcoin, is it a good time to buy? Could the crypto markets start a recovery in the short term? Let’s study the charts of the top-10 cryptocurrencies to find out.BTC/USDTBitcoin broke above the downtrend line on May 30 and the bulls are attempting to sustain the price above the 20-day exponential moving average (EMA) ($30,562). If they succeed, it will be the first indication that the bears may be losing their grip.BTC/USDT daily chart. Source: TradingViewIf the price sustains above the 20-day EMA, the BTC/USDT pair could rise to $32,659 and later to the 50-day simple moving average (SMA) ($34,954). The 20-day EMA is flattening out and the relative strength index (RSI) has risen above 46, suggesting that bulls are attempting a comeback.Conversely, if the price turns down from the 20-day EMA, it will suggest that the sentiment remains negative and traders are selling on rallies. The bears will then make another attempt to pull the pair below $28,630 and challenge the May 12 intraday low at $26,700. A break below this support could signal the resumption of the downtrend.ETH/USDTEther (ETH) bounced off the vital support at $1,700 on May 28 and is marching toward the 20-day EMA ($2,026). This suggests that bulls are attempting to start a sustained recovery.ETH/USDT daily chart. Source: TradingViewThe RSI is showing a bullish divergence suggesting that the selling pressure may be reducing. The buyers will try to push the price above the 20-day EMA and challenge the breakdown level at $2,159. If bulls fail to clear this hurdle, the BNB/USDT pair may turn down and consolidate between $1,700 and $2,159.If bulls thrust the price above $2,159, it will suggest that $1,700 may be the bottom in the short term. The pair could then rally to the 50-day SMA ($2,504). This bullish view could be invalidated if the price turns down and plummets below $1,700.BNB/USDTBNB took support near the immediate support at $286 on May 27, suggesting that traders are buying the dips. The bulls will now again attempt to push the price above the overhead resistance at $320.BNB/USDT daily chart. Source: TradingViewIf they succeed, the BNB/USDT pair could rally to $350. The longer the price sustains above $320, the greater the possibility that the bottom has been made on May 12. If bulls overcome the barrier at $350, the rally could reach $400.On the other hand, if the price turns down from the current level or $350, it will suggest that bears are selling on rallies. That could again pull the price to the immediate support at $286. If this support cracks, the pair could decline to $260.XRP/USDTAlthough Ripple (XRP) dipped below $0.38 on May 26, the bears could not maintain the selling pressure. This started a recovery on May 28, which has reached the downtrend line. XRP/USDT daily chart. Source: TradingViewThe bears have repeatedly mounted a strong defense at the downtrend line; hence, this is an important resistance to keep an eye on. If the price reverses direction from the downtrend line, the bears will try to pull the XRP/USDT pair below $0.37 and challenge the crucial support at $0.33.On the contrary, if buyers drive and sustain the price above the 20-day EMA ($0.43), it will suggest that the sellers may be losing their grip. The pair could then rally to the psychological level at $0.50.ADA/USDT Cardano (ADA) broke below the minor support at $0.46 on May 27 but the bears could not build upon the advantage. The bulls purchased this dip and started a recovery on May 28.ADA/USDT daily chart. Source: TradingViewThe relief rally picked up momentum on May 30 and the bulls are attempting to push the price above the 20-day EMA ($0.54). If they succeed, it will suggest that the ADA/USDT pair is attempting to form a bottom. The pair could then rise to $0.61 and later attempt a rally to the breakdown level of $0.74.This positive view could be negated if the price turns down from the 20-day EMA. If that happens, the bears will again try to sink the pair below $0.40 and start the next leg of the downward move.SOL/USDTSolana (SOL) recovered from $40 on May 28, indicating that lower levels continue to attract buying by the bulls. The buyers will now try to push the price to the 20-day EMA ($53).SOL/USDT daily chart. Source: TradingViewIf bulls propel the price above the 20-day EMA, it will suggest that the downtrend could be weakening. The SOL/USDT pair may then rise to $60 and thereafter rally to the 50% Fibonacci retracement level of $66. On the contrary, if the price turns down from the current level or the 20-day EMA, it will suggest that bears continue to sell on rallies. That could increase the possibility of a retest of $37.37. A break below this support may start the next leg of the downtrend.DOGE/USDTDogecoin (DOGE) plunged below $0.08 on May 26 but made a strong comeback on May 27. This suggests aggressive buying at lower levels but the bears are not ready to give up their advantage as they continue to defend the 20-day EMA ($0.09) with vigor.DOGE/USDT daily chart. Source: TradingViewThe bulls will again try to push the price above the 20-day EMA. If they do that, the DOGE/USDT pair could rise to the psychological level at $0.10. This level may again act as a resistance but if bulls overcome this hurdle, the pair could rally to $0.12.Alternatively, if the price turns down from the 20-day EMA or $0.10, it will suggest that bears are active at higher levels. That could pull the pair down to $0.08 and later to the May 12 intraday low of $0.06. Related: Bitcoin ‘ready’ for $32.8K after consolidation as BTC price gains 6.3%DOT/USDTPolkadot (DOT) formed a Doji candlestick pattern on May 27, suggesting indecision among the bulls and the bears. This uncertainty resolved to the upside and bulls pushed the price to the overhead resistance at $10.37.DOT/USDT daily chart. Source: TradingViewIf buyers propel the price above the overhead resistance, it could open the doors for a possible rally to $12. If bulls clear this hurdle, the next stop could be $14. A break and close above this resistance could indicate that the DOT/USDT pair may have bottomed out.This positive view could invalidate if the price turns down sharply from the current level and breaks below $8.56. That could result in a decline to the May 12 intraday low of $7.30. The bears will have to sink the price below this level to indicate the resumption of the downtrend.AVAX/USDTAvalanche (AVAX) dipped below the strong support at $23.51 on May 26 but the bears could not capitalize on this advantage. The bulls bought the dip on May 27 and started a recovery on May 28.AVAX/USDT daily chart. Source: TradingViewThe bulls will attempt to push the price to the 20-day EMA ($32.42), which is an important level to keep an eye on. If the price turns down from this resistance, the bears will try to retest the May 27 intraday low at $21.35. If this support cracks, the AVAX/USDT pair could slide to the psychological level at $20.The RSI is showing a positive divergence, indicating that the selling pressure could be reducing. If bulls push the price above the 20-day EMA, the pair could rally to $38 and later attempt an up-move to $46.SHIB/USDTThe bulls successfully defended the support at $0.000010 on May 27, which resulted in a rebound on May 28. Shiba Inu (SHIB) continued its recovery and has reached the 20-day EMA ($0.000012), which is likely to act as a strong resistance.SHIB/USDT daily chart. Source: TradingViewIf the price turns down from the 20-day EMA, the bears will again attempt to sink the SHIB/USDT pair below $0.000010. If that happens, the pair could retest the critical support at $0.000009.Alternatively, if bulls push the price above the 20-day EMA, it will suggest that the downtrend may be weakening. The pair could then attempt a rally to $0.000014 and later to the breakdown level at $0.000017. The bulls will have to clear this overhead hurdle to signal a potential change in trend.The views and opinions expressed here are solely those of the author and do not necessarily reflect the views of Cointelegraph. Every investment and trading move involves risk. You should conduct your own research when making a decision.Market data is provided by HitBTC exchange.

Čítaj viac

Získaj BONUS 8 € v Bitcoinoch

nakup bitcoin z karty

Registrácia Binance

Burza Binance

Aktuálne kurzy