Autor Cointelegraph By Rakesh Upadhyay

Top 5 cryptocurrencies to watch this week: BTC, UNI, XLM, THETA, HNT

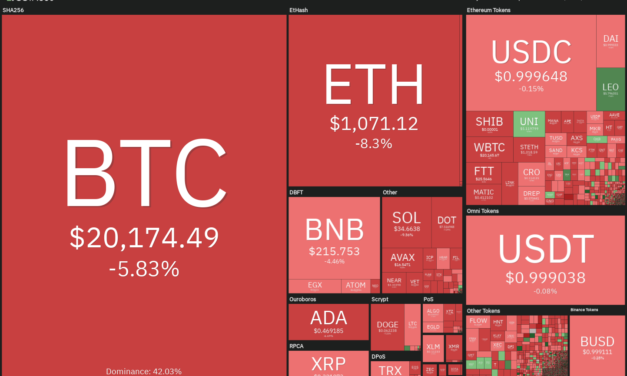
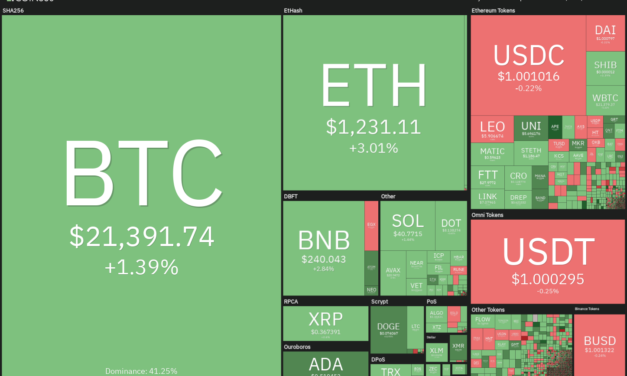
The United States equities markets witnessed a sharp comeback last week, led by the Nasdaq Composite which gained 7.5%. The S&P was up about 6.5% for the week while the Dow Jones Industrial Average managed a gain of 5.4%.Continuing its tight correlation with the equities market, the crypto markets are also attempting a relief rally. Bitcoin (BTC) has seen a modest recovery but some altcoins have risen sharply in the past week. This suggests that investors are taking advantage of the sharp fall in the price to accumulate altcoins at lower levels.Crypto market data daily view. Source: Coin360Smaller-sized investors have been using the decline in Bitcoin to build their position to at least one Bitcoin. Glassnode data shows that the number of Bitcoin wallet addresses having more than one Bitcoin rose by 873 between June 15 to June 25.Could the recovery in Bitcoin and altcoins pick up momentum? Let’s study the charts of the top-5 cryptocurrencies that could charge higher in the short term.BTC/USDTBitcoin’s relief rally is facing stiff resistance near $22,000 as seen from the long wick on the June 26 candlestick. This indicates that the bears are not willing to give up their advantage and are selling on rallies.BTC/USDT daily chart. Source: TradingViewThe sellers will try to pull the price toward the vital support of $20,000. This is an important level to watch out for because a bounce off it will suggest that bulls are attempting to form a higher low. That could enhance the prospects of a break above the 20-day exponential moving average ($23,155). If that happens, the BTC/USDT pair could indicate a potential trend change. The bulls will then try to drive the price toward the 50-day simple moving average ($27,424).On the contrary, if the price turns down and plummets below $20,000, it will suggest that bears remain in control. The sellers will then try to sink the BTC/USDT pair to the crucial level of $17,622.BTC/USDT 4-hour chart. Source: TradingViewThe failure of the bulls to push the price to the 38.2% Fibonacci retracement level of $23,024 suggests a lack of demand at higher levels. The moving averages have flattened out and the relative strength index (RSI) is just above the midpoint, suggesting a range-bound action in the near term.If the price slips below the moving averages, the pair could drop to $20,000. A break below this support could signal weakness.Alternatively, if the price rebounds off the moving averages, it will suggest that bulls are buying on dips. The bulls will then attempt to push the price toward $23,024. If this level is crossed, the next stop could be the 50% retracement level of $24,693.UNI/USDTUniswap (UNI) rebounded sharply from $3.33 on June 18 and has reached the stiff overhead resistance at $6.08. The bears are defending the level aggressively but a minor positive is that the bulls have not given up much ground.UNI/USDT daily chart. Source: TradingViewThe moving averages are close to completing a bullish crossover and the RSI is in the positive zone, indicating that the path of least resistance is to the upside.If buyers drive the price above $6.08, the bullish momentum could pick up and the UNI/USDT pair could rally to $8. This level could again act as a stiff hurdle but if bulls overcome it, the next stop could be $10.On the contrary, if the price turns down from the current level and breaks below the 20-day EMA ($4.90), it will suggest that the trend remains negative and traders are selling near resistance levels. The pair could then decline toward $4.UNI/USDT 4-hour chart. Source: TradingViewThe bears are attempting to stall the recovery near the overhead resistance at $6.08 but the rising moving averages on the 4-hour chart suggest that bulls have the upper hand in the near term.If the rebound off the 20-EMA sustains, it could increase the possibility of a break above $6.08. If that happens, the pair could pick up momentum and rally to $6.66 and then to $7.34.Another possibility is that the pair turns down and breaks below the 20-EMA. In that case, the pair could slide to the 50-SMA. A break below this support could invalidate the bullish view.XLM/USDTStellar (XLM) has been in a strong downtrend but the bulls are attempting to form a bottom near $0.10. The buyers pushed the price above the 20-day EMA ($0.12) on June 24 but could not clear the hurdle at the 50-day SMA ($0.13).XLM/USDT daily chart. Source: TradingViewA minor positive is that bulls have not allowed the price to slip back below the 20-day EMA ($0.12). The flattening 20-day EMA and the RSI near the midpoint suggest that bulls are attempting a comeback.If buyers drive the price above the 50-day SMA, the XLM/USDT pair could attempt a rally to the overhead resistance at $0.15. If this level is cleared, it may signal the start of a new uptrend.This positive view could invalidate in the short term if the price continues lower and breaks below the 20-day EMA. The pair could then slip to $0.11.XLM/USDT 4-hour chart. Source: TradingViewThe moving averages on the 4-hour chart are sloping up and the RSI is in the positive territory, suggesting advantage to buyers. The buyers will have to propel the price above $0.13 to open the doors for a possible rally to $0.14 and then $0.15.Contrary to this assumption, if the price slips below the 20-EMA, the pair could drop to the uptrend line. A break below this support could tilt the advantage back in favor of the bears. The pair could then slide to $0.11.Related: How low can Ethereum price drop versus Bitcoin amid the DeFi contagion?THETA/USDTTheta Network (THETA) has been consolidating in a tight range between $1 and $1.55 for the past several days. The longer the time spent inside a range, the stronger will be the breakout from it.THETA/USDT daily chart. Source: TradingViewBoth moving averages are on the verge of completing a bullish crossover and the RSI is in the positive territory. This suggests that bulls have a slight edge. If buyers push the price above $1.55, it will suggest the start of a new up-move. The THETA/USDT pair could then rise to the pattern target of $2.10.Contrary to this assumption, if the price turns down from $1.55, it will suggest that bears continue to defend the resistance aggressively. That could keep the pair stuck inside the range for a few more days.THETA/USDT 4-hour chart. Source: TradingViewThe 4-hour chart shows that the price turned down from the overhead resistance at $1.55 but a positive sign is that the bulls are attempting to defend the 20-EMA. This suggests that the sentiment is turning positive and traders are buying the dips.If the price rebounds off the current level, the bulls will again try to clear the overhead hurdle at $1.55. If they can pull it off, it could suggest the start of a new uptrend. Conversely, if the price breaks below the 20-EMA, the pair could drop to the 50-SMA. HNT/USDTHelium (HNT) has formed a symmetrical triangle pattern, indicating indecision among the bulls and the bears. Usually, the symmetrical triangle acts as a continuation pattern but in some cases it indicates a reversal.HNT/USDT daily chart. Source: TradingViewThe moving averages have completed a bullish crossover and the RSI is in the positive territory, suggesting that bulls have a slight edge. The price has been stuck between the resistance line of the triangle and the 20-day EMA ($10.50) for the past few days. This is a positive sign as it shows a change in sentiment from selling on rallies to buying on dips.If buyers propel the price above the resistance line of the channel, it will suggest a potential change in trend. The HNT/USDT pair could then rally to $16.50 and later to the pattern target of $18.50. This positive view could invalidate in the short term if the price turns down and plummets below the 20-day EMA. That could open the doors for a possible drop to the support line of the triangle.HNT/USDT 4-hour chart. Source: TradingViewThe bulls are struggling to sustain the price above $12, which suggests that bears are defending the overhead zone between $12.50 and $13.50 with vigor. If the price slips below the uptrend line, it could tilt the short-term advantage in favor of sellers.Alternatively, if the price rebounds off the 20-EMA, it will suggest that bulls are buying on dips. The bulls will then make one more attempt to clear the overhead zone. If they succeed, it will suggest the start of a new up-move.The views and opinions expressed here are solely those of the author and do not necessarily reflect the views of Cointelegraph. Every investment and trading move involves risk, you should conduct your own research when making a decision.

Čítaj viac

Price analysis 6/24: BTC, ETH, BNB, XRP, ADA, SOL, DOGE, DOT, SHIB, LEO

The United States equity markets and the cryptocurrency space are witnessing a relief rally this week. Supporting the rise in risky assets is the U.S. dollar index (DXY), which retreated from its multi-year high. Generally, cryptocurrencies move inverse to the price of the U.S. dollar, but this week’s bounce does not necessarily mean that bulls’ grip over the market has come to an end.Citing on-chain data, CryptoQuant senior analyst Julio Moreno, said that Bitcoin (BTC) miners may have already capitulated. Historical data suggests that miner capitulation usually precedes market bottoms. Daily cryptocurrency market performance. Source: Coin360Another on-chain metric that indicates that Bitcoin’s price may have reached an attractive level is the Mayer Multiple. The metric is calculated by dividing the price of Bitcoin by the 200-day moving average value. It points to whether Bitcoin is overbought, undervalued or fairly priced. On June 22, the indicator’s reading was 0.5 and according to crypto entrepreneur Kyle Chasse, Bitcoin’s price has dipped below this reading only on 3% of all trading days.Several on-chain indicators are suggesting that Bitcoin may be close to a bottom. Let’s study the charts of the top-10 cryptocurrencies to find out what the technicals suggest!BTC/USDTBitcoin is attempting a recovery in a downtrend but the bulls are struggling to push the price to the 38.2% Fibonacci retracement level of $23,024. This suggests that demand dries up at higher levels. BTC/USDT daily chart. Source: TradingViewThe first hurdle for the bulls is likely to be $21,723 and then the 20-day exponential moving average (EMA ($23,529). During strong downtrends, bears sell on rallies to this level. Hence, it becomes an important level to keep an eye on. If the price turns down sharply from the 20-day EMA, it will suggest that the bears are in command. The sellers will then make another attempt to sink the BTC/USDT pair to the crucial level at $17,622. Conversely, if buyers propel the price above the 20-day EMA, it will suggest that the bears may be losing their grip. That could open the doors for a possible rally to the 50-day simple moving average (SMA) ($27,995).ETH/USDTEther (ETH) had been trading between $1,200 and $1,050 since June 20. This tight range trading resolved to the upside on June 24 as bulls attempt to push the price to the 20-day EMA ($1,332). ETH/USDT daily chart. Source: TradingViewThis level is likely to attract strong resistance from the bears. If the price turns down sharply from the 20-day EMA, it will suggest that the sentiment remains negative and traders are selling on rallies. The bears will then try to pull the price to $1,050. A break and close below this support could retest the vital support at $881.Alternatively, if bulls drive the price above the 20-day EMA, the likelihood of a rally to the breakdown level of $1,700 increases.BNB/USDTThe bears tried to pull BNB below $211 on June 22 but the bulls held their ground. This started a relief rally that hareached the 20-day EMA ($243).BNB/USDT daily chart. Source: TradingViewIf bulls push the price above the 20-day EMA, it will increase the possibility that the break below $211 may have been a bear trap. The BNB/USDT pair could then rally to the 50-day SMA ($284) where the bears may again mount a strong resistance.Another possibility is that the price turns down sharply from the 20-day EMA. If that happens, the bears will try to pull the pair below $211 and challenge the June 18 intraday low of $183. A break below this support could indicate the start of a downtrend to $150.XRP/USDTThe tight range trading in Ripple (XRP) resolved to the upside with a break above the 20-day EMA ($0.35) on June 24. This suggests that the bears may be losing their grip.XRP/USDT daily chart. Source: TradingViewThe buyers tried to propel the price above the 50-day SMA ($0.40) on June 24 but the long wick on the day’s candlestick suggests that bears continue to defend the level aggressively. If the price turns down and breaks below the 20-day EMA, the XRP/USDT pair could drop to $0.35.Contrary to this assumption, if the price turns up and breaks above the 50-day SMA, it will suggest the start of a new up-move. The pair could first rally to $0.46 and then make a dash toward $0.56.ADA/USDT Cardano (ADA) has been oscillating between the 20-day EMA ($0.50) and the strong support of $0.44 for the past few days but this tight range trading is unlikely to continue for long.ADA/USDT daily chart. Source: TradingViewThe RSI has been gradually climbing higher, suggesting that the bearish momentum could be weakening. That enhances the prospects of a break above the moving averages. If that happens, the ADA/USDT pair could climb toward $0.70.Contrary to this assumption, if the price turns down from the 20-day EMA, it will suggest that bears are defending the level aggressively. The sellers will then try to pull the pair below the strong support zone of $0.44 to $0.40 and resume the downtrend.SOL/USDTSolana (SOL) turned down from the 20-day EMA ($36) on June 22 but the bears could not sustain the lower levels. The bulls purchased the dip and pushed the price back above the 20-day EMA on June 23.SOL/USDT daily chart. Source: TradingViewIf bulls sustain the price above the 20-day EMA, the SOL/USDT pair could rise to the 50-day SMA ($45). The flattish 20-day EMA and the RSI near the midpoint suggest that the bears may be losing their grip. A break and close above the 50-day SMA will indicate that the downtrend could be over.Contrary to this assumption, if the price fails to sustain above the 20-day EMA, it will suggest that bears are active at higher levels. If sellers pull the price below $33, the pair could slide to $27.DOGE/USDTDogecoin (DOGE) has been trading near the 20-day EMA ($0.06) since June 21. This suggests that the bulls are not closing their positions as they anticipate a break above the 20-day EMA. DOGE/USDT daily chart. Source: TradingViewThe RSI has been gradually rising toward the midpoint and the 20-day EMA is flattening out, which suggests that the bulls are attempting a comeback.If bulls thrust the price above the 20-day EMA, the DOGE/USDT pair could rally to the 50-day SMA ($0.08) where the bears may again pose a strong challenge. The bulls will have to clear this hurdle to open the doors for a possible up-move to $0.10.Alternatively, if the price turns down from the 20-day EMA, the bears will try to pull the pair below $0.06 and challenge the psychological support at $0.05.Related: Bitcoin gives ‘encouraging signs’ — Watch these BTC price levels nextDOT/USDTPolkadot (DOT) bounced off the $7.30 support on June 23, indicating that bulls are attempting to form a higher low. The price has reached the 20-day EMA ($8.15), which is an important barrier for the bulls to overcome.DOT/USDT daily chart. Source: TradingViewThe RSI has risen above 45 and the 20-day EMA is flattening out. This suggests that the bearish momentum could be weakening. If bulls push the price above the moving averages, the DOT/USDT pair could attempt a rally to the overhead resistance at $12.44. This level may again act as a strong resistance and if the price turns down from it, the pair could remain stuck between $12.44 and $7.30 for a few days. The bears will have to sink the price below the $7.30 to $6.36 support zone to indicate the start of the next leg of the downtrend.SHIB/USDTThe bears tried to pull the price below the 20-day EMA ($0.000009) on June 22 but the bulls held their ground. Shiba Inu (SHIB) rebounded off the 20-day EMA on June 23 but the buyers could not push the price above the 50-day SMA ($0.000011).SHIB/USDT daily chart. Source: TradingViewThe 20-day EMA has flattened out and the RSI is just above the midpoint, indicating equilibrium between buyers and sellers. This balance could tilt in favor of the bulls if they propel the price above the 50-day SMA. The SHIB/USDT pair could then rally to the overhead resistance at $0.000014.Conversely, if the price turns down and plummets below the 20-day EMA, it will suggest that bears have gained the upper hand. The pair could then slide to $0.000008.LEO/USDUNUS SED LEO (LEO) repeatedly rose above the resistance line of the descending channel between June 22 and 24 but the bulls could not sustain the higher levels.LEO/USD daily chart. Source: TradingViewThis suggests that the bears are aggressively defending the resistance line of the channel. The failure to sustain the price above the channel may tempt short-term traders to book profits.That could pull the price to the 20-day EMA ($5.39). If the price rebounds off this support, the bulls will again attempt to push the LEO/USD pair above the channel. If they succeed, the next stop could be $6.50 and then $6.80.On the contrary, if the price turns down and breaks below the 20-day EMA, it will suggest that the pair may remain stuck inside the channel for a few more days.The views and opinions expressed here are solely those of the author and do not necessarily reflect the views of Cointelegraph. Every investment and trading move involves risk. You should conduct your own research when making a decision.Market data is provided by HitBTC exchange.

Čítaj viac

Price analysis 6/22: BTC, ETH, BNB, ADA, XRP, SOL, DOGE, DOT, LEO, SHIB

Bitcoin (BTC) continues to face a tough battle near the psychological level of $20,000 as the bulls and the bears attempt to assert their supremacy. Trading firm QCP Capital said in their latest market circular that funding rates on derivatives markets were stable and bearish conditions were fading.Another ray of hope for the Bitcoin bulls is that Bitcoin miners may be capitulating as the recent decline in the price has made some mining machines unprofitable. Data from Arcane Research shows that public Bitcoin mining companies that had only sold 30% of their mined production from January to April of this year had dumped 100% of their Bitcoin production in May. Some analysts believe that miners giving up was a bullish signal.Daily cryptocurrency market performance. Source: Coin360However, one metric suggests that Bitcoin may not have bottomed out. Historically, Bitcoin signals a bottom when less than 50% of the Bitcoin addresses remain profitable. Glassnode data as of June 20 shows that 56.2% of Bitcoin addresses are in profit, increasing concerns of another down leg.Could Bitcoin and the altcoins sustain the recovery or will bears pull the price lower? Let’s study the charts of the top-10 cryptocurrencies to find out.BTC/USDTThe bulls are attempting to start a recovery in Bitcoin but the long wick on the June 21 candlestick suggests that bears are not willing to surrender their advantage. BTC/USDT daily chart. Source: TradingViewA minor positive is that the bulls are buying the dips to $20,000 on June 22. If the price rebounds off the current level, the buyers will try to drive the BTC/USDT pair above $22,000. That could open the doors for a possible rally to the 20-day exponential moving average (EMA)($24,076). This level is likely to act as a stiff resistance but if bulls overcome this barrier, the next stop could be the 50-day simple moving average (SMA) ($28,678).This bullish view could be negated if the price turns down and breaks below $19,600. That could enhance the prospects of a retest of the June 18 intraday low of $17,622.ETH/USDTEther’s (ETH) bounce off the June 18 intraday low of $881 turned down from $1,194 on June 21, suggesting that bears have not yet given up and they continue to sell on rallies.ETH/USDT daily chart. Source: TradingViewIf bulls don’t not give up much ground from the current level, the ETH/USDT pair could again attempt a rally to the 20-day EMA ($1,368). This is an important level to keep an eye on because bears tend to defend the 20-day EMA during downtrends.If the price turns down from the 20-day EMA, the bears will again try to pull the pair to $1,000 and then $881. A break below this level could signal the resumption of the downtrend. On the other hand, if bulls push the price above the 20-day EMA, the pair could rise to $1,700. BNB/USDTBNB has been sustaining above the crucial support of $211 since June 19 but the bulls are struggling to push the price higher. The long wick on the June 21 candlestick suggests that bears continue to sell on rallies.BNB/USDT daily chart. Source: TradingViewIf bears sink the price below $211, the BNB/USDT pair could decline to $200 and then to the June 18 intraday low of $183. This is an important level to watch out for because if the price dips below it, the pair could plummet to $150.Conversely, if the price rebounds off $211 or $200, it will suggest that bulls continue to buy on dips. The bulls will then make one more attempt to clear the overhead hurdle at the 20-day EMA. If they succeed, it will suggest that the break below $211 may have been a bear trap.ADA/USDT Cardano’s (ADA) bounce from the $0.44 to $0.40 support zone fizzled out near the 20-day EMA ($0.51) on June 21. This suggests that the bears continue to defend the level aggressively.ADA/USDT daily chart. Source: TradingViewThe sellers will now attempt to sink the price below the support zone. If they manage to do that, it will suggest the start of the next leg of the downtrend. The ADA/USDT pair could then slip to $0.33 and later to $0.30.Alternatively, if the price again rebounds off the support zone, it will suggest that bulls continue to accumulate on dips. The buyers will then make one more attempt to push the pair above the moving averages and start a rally to $0.70.XRP/USDTRipple (XRP) has been range-bound between $0.28 and $0.35 for the past few days. This suggests a state of equilibrium between the bulls and the bears.XRP/USDT daily chart. Source: TradingViewThe longer the time spent inside the range, the stronger will be the breakout from it. If the price continues lower and breaks below the support of the range at $0.28, it could suggest the resumption of the downtrend. The RSI is showing a positive divergence, indicating that the bearish momentum may be weakening. If bulls push the price above $0.35, it will suggest the start of a new up-move. The XRP/USDT pair could then rise to the 50-day SMA ($0.41) and later rally to $0.45. SOL/USDTSolana’s (SOL) recovery on June 21 rose above the 20-day EMA ($36) but the long wick on the day’s candlestick shows that bears are selling at higher levels.SOL/USDT daily chart. Source: TradingViewThe price remains below the 20-day EMA on June 22 but the bulls have not given up much ground. This suggests that the buyers expect a break above the 20-day EMA. If that happens, the SOL/USDT pair could rally to the 50-day SMA ($47) where the bears may again mount a strong defense.Conversely, if the price fails to rise above the 20-day EMA, it could attract profit-booking from short-term traders. That may pull the pair to $30 and later to $27.DOGE/USDTDogecoin (DOGE) started a recovery on June 19 and reached the 20-day EMA ($0.06) on June 21. Although bulls pushed the price above the 20-day EMA, they could not sustain the higher levels.DOGE/USDT daily chart. Source: TradingViewThat may have attracted profit-booking from the short-term bulls and selling by the aggressive bears. The sellers will now attempt to sink the DOGE/USDT pair below $0.06 and challenge the vital support at $0.05.Alternatively, if the price rebounds off $0.06, it will suggest that the sentiment has changed from selling on rallies to buying on dips. That could increase the possibility of a break above the 20-day EMA. If that happens, the pair may rally to the 50-day SMA ($0.08).Related: Bitcoin price wicks below $20K as whales send 50K BTC to exchangesDOT/USDTPolkadot (DOT) turned down from th 20-day EMA ($8.20) on June 21, suggesting that bears continue to defend the level aggressively. The sellers will now try to pull the price below the immediate support at $7.30.DOT/USDT daily chart. Source: TradingViewIf they succeed, the DOT/USDT pair could drop to the crucial support at $6.36. This is an important level to keep an eye on because a break below it could start the next leg of the downtrend to $4.23.On the contrary, if the price rebounds off $7.30, it will suggest that bulls are trying to form a higher low. That could enhance the prospects of a break above the 20-day EMA. The pair could then rally to the 50-day SMA ($9.78). If this level is also crossed, the next stop could be $12.44.LEO/USDThe bulls pushed UNUS SED LEO (LEO) above the resistance line of the descending channel on June 22 but the long wick on the day’s candlestick suggests that bears are selling at higher levels.LEO/USD daily chart. Source: TradingViewThe 20-day EMA ($5.29) has started to turn up and the RSI is near the overbought territory, indicating that bulls have the upper hand. If the price sustains above the channel, it could open the doors for a possible up-move to $6.50.Conversely, if the price fails to sustain above the channel, traders may book profits and that could pull the LEO/USD pair to the 20-day EMA. Such a move will suggest that the pair may remain stuck inside the channel for a few more days.SHIB/USDTThe failure to sink Shiba Inu (SHIB) below $0.000007 may have tempted short sellers to book profits and aggressive bulls to start buying. That may have resulted in the sharp rally on June 21.SHIB/USDT daily chart. Source: TradingViewTraders pushed the price above the 20-day EMA ($0.000010) but could not clear the hurdle at the 50-day SMA ($0.000012). This suggests that bears are defending the level aggressively.The sellers are attempting to pull the price back below the 20-day EMA. If they manage to do that, it will suggest that the recent recovery may have been a bear market rally. The SHIB/USDT pair could then drop toward $0.000007.The 20-day EMA is flattening out and the RSI is near the midpoint suggesting a range-bound action in the near term. The bulls will have to push and sustain the price above the 50-day SMA to signal a potential trend change.The views and opinions expressed here are solely those of the author and do not necessarily reflect the views of Cointelegraph. Every investment and trading move involves risk. You should conduct your own research when making a decision.Market data is provided by HitBTC exchange.

Čítaj viac

Price analysis 6/20: BTC, ETH, BNB, ADA, XRP, SOL, DOGE, DOT, LEO, AVAX

The crypto markets have been in a strong bear phase for the past several months but JPMorgan Chase analysts expect that to change and they projected significant upside from the current levels. The analysts cited the rising share of all stablecoins in the total crypto market for their bullish outlook.Unperturbed by the current fall, retail traders have been adding Bitcoin (BTC) to their portfolios. The number of wallet addresses holding one Bitcoin surged by 13,091 to a record high of 865,254. Similarly, the number of addresses holding about 0.1 Bitcoin has also witnessed a sharp rise in the past 10 days, according to data from Glassnode. Daily cryptocurrency market performance. Source: Coin360Bitcoin’s sharp recovery from the June 18 fall shows strong buying at lower levels and according to Whalemap, this has led to the formation of a new “whale level” which may act as a short-term support. Could the recovery in Bitcoin and major altcoins continue in the near term? Let’s study the charts of the top-10 cryptocurrencies to find out.BTC/USDTBitcoin plunged below $20,000 on June 18 but made an equally sharp recovery on June 19, indicating aggressive buying at lower levels. If bulls sustain the price above $20,000, it could improve sentiment and attract more buyers.BTC/USDT daily chart. Source: TradingViewThe BTC/USDT pair could first rise to the 38.2% Fibonacci retracement level of $23,024 and then to the 20-day exponential moving average ($24,890). The bears are likely to defend this zone with all their might.If the price turns down from this zone, the sellers will make another attempt to pull the pair below $20,000. A break and close below $17,622 could start the next leg of the downtrend.Alternatively, if buyers push the price above the 20-day EMA, it will signal a potential change in trend. The pair could then rally to the 50-day simple moving average ($29,386) where the bears may mount a strong defense.ETH/USDTEther (ETH) plummeted below the psychological level of $1,000 on June 18 which suggests that the downtrend remains intact. A minor positive is that the bulls purchased the dip as seen from the long tail on the day’s candlestick.ETH/USDT daily chart. Source: TradingViewThe buyers sustained the momentum on June 19 and pushed the price back above $1,000. The ETH/USDT pair could rise to $1,250 and later to the 20-day EMA ($1,429). This remains the critical resistance to watch out for.If the price turns down from the current level or the 20-day EMA, it will suggest that the bears are active at higher levels. The sellers will then try to pull the pair to the June 18 intraday low of $881. A break and close below this level could signal the resumption of the downtrend.BNB/USDTBinance Coin (BNB) broke and closed below the strong support at $211 on June 18 but the bears could not build upon this advantage. This suggests that lower levels continue to attract buyers.BNB/USDT daily chart. Source: TradingViewThe bulls pushed the price back above the breakdown level of $211 on June 19. If buyers sustain this level, it will suggest that the breakdown on June 18 may have been a bear trap. If bears rush to cover their positions, it could cause a short squeeze and push the BNB/USDT pair toward the 20-day EMA ($251). If bulls overcome this barrier, the pair could rise to the 50-day SMA ($297).Contrary to this assumption, if the price turns down from the current level and breaks below $211, it will suggest that bears are selling on minor rallies. The bears will then try to sink the pair below $183 and resume the downtrend.ADA/USDT The bulls once again successfully defended the $0.44 to $0.40 zone on June 18. That started a recovery in Cardano (ADA) which has reached the 20-day EMA ($0.52).ADA/USDT daily chart. Source: TradingViewIf bulls drive the price above the moving averages, the ADA/USDT pair could rise to the overhead resistance zone between $0.70 and $0.74. The bears are likely to defend this zone with all their might. If the price turns down from it, the pair could remain stuck in a wide range between $0.40 and $0.74 for a few days. The next trending move could begin after bulls push the price above $0.74 or bears pull the pair below $0.40. XRP/USDTRipple (XRP) slipped below $0.29 on June 18 but the bears could not capitalize on the advantage. This suggests that selling dries up at lower levels. XRP/USDT daily chart. Source: TradingViewThe bulls may attempt to push the price to the overhead resistance zone between the 20-day EMA ($0.35) and the breakdown level of $0.38. The bears are likely to defend this zone aggressively but if bulls bulldoze their way through, the XRP/USDT pair could rally to the overhead resistance at $0.46.This positive view could invalidate if the price turns down from the current level or the overhead zone. The bears will then make another attempt to sink and sustain the price below $0.29.SOL/USDTSolana (SOL) remains in a downtrend but the bulls are attempting to start a recovery. The price has reached the 20-day EMA ($36) which is an important level to keep an eye on.SOL/USDT daily chart. Source: TradingViewThe positive divergence on the relative strength index (RSI) indicates that the bearish momentum may be weakening. If buyers propel the price above the 20-day EMA, the SOL/USDT pair could rally to the 50-day SMA ($49). This level may again act as a resistance but if bulls clear this hurdle, the next stop could be $60.On the contrary, if the price turns down from the current level, it will suggest that bears continue to defend the 20-day EMA with vigor. The bears will have to pull the pair below $25 to signal the start of the next leg of the downtrend.DOGE/USDTThe bears pulled Dogecoin (DOGE) below the psychological support at $0.05 on June 18 but they could not sustain the lower levels. This suggests that bulls are buying on dips.DOGE/USDT daily chart. Source: TradingViewBuyers will try to push the price to the 20-day EMA ($0.07) which could act as a stiff barrier. If the price turns down from this level, it will suggest that bears remain in command. The sellers will then make one more attempt to sink and sustain the price below $0.05. If they succeed, the DOGE/USDT pair could drop to $0.04.Conversely, a break and close above the 20-day EMA will be the first indication that the bulls are on a comeback. The pair could then rise to the 50-day SMA ($0.09) which may again act as a stiff resistance.Related: Ethereum analyst warns of ‘clean fakeout’ despite 30% ETH price reboundDOT/USDTThe bears tried to sink Polkadot (DOT) below the support at $6.36 on June 18 but the bulls held their ground. Strong buying at lower levels pushed the price back above the breakdown level of $7.30 on June 19.DOT/USDT daily chart. Source: TradingViewThe bulls will attempt to push the price above the 20-day EMA ($8.33). If they succeed, it will suggest the start of a sustained recovery. The DOT/USDT pair could then rise to the 50-day SMA ($10.06) and later to the overhead resistance at $12.44. The positive divergence on the RSI is also pointing toward a possible relief rally.Contrary to this assumption, if the price turns down from the 20-day EMA, the bears will again try to sink the pair below $6.36 and resume the downtrend. The next support on the downside is $4.23.LEO/USDUNUS SED LEO (LEO) dipped below the support line of the descending channel on June 18 but the long tail on the day’s candlestick suggests aggressive buying at lower levels. LEO/USD daily chart. Source: TradingViewThe bulls sustained their momentum and pushed the price above the moving averages on June 20. If the LEO/USD pair maintains above the moving averages, the next stop could be the resistance line of the channel. The buyers will have to push the price above this level to indicate the start of a new up-move.Contrary to this assumption, if the price turns down from the resistance line, it will suggest that bears are defending the level aggressively. That could keep the pair stuck inside the channel for a few more days.AVAX/USDTAvalanche (AVAX) slipped below the support at $14.50 on June 18 but the bears could not sustain the lower levels. The bulls are attempting a rebound on June 20 which could reach the 20-day EMA ($20).AVAX/USDT daily chart. Source: TradingViewIf the price turns down from the 20-day EMA, it will suggest that bears remain in control and they are selling on rallies. The bears will then make one more attempt to sink the price below $13.71 and resume the downtrend. The next support on the downside is $13.Conversely, if bulls thrust the price above the 20-day EMA, it will suggest that the bears may be losing their grip. The AVAX/USDT pair could then attempt a rally to the 50-day SMA ($30) where the bears may again pose a challenge.The views and opinions expressed here are solely those of the author and do not necessarily reflect the views of Cointelegraph. Every investment and trading move involves risk. You should conduct your own research when making a decision.Market data is provided by HitBTC exchange.

Čítaj viac

Top 5 cryptocurrencies to watch this week: BTC, SOL, LTC, LINK, BSV

Bitcoin (BTC) plummeted to $17,622 on June 18. This marked the first time in Bitcoin’s history that it has fallen below its previous cycle high. The United States Federal Reserve’s aggressive monetary tightening, a crisis at crypto lending platform Celsius and liquidity issues at investment fund Three Arrows Capital are creating a sense of panic among traders.Markets commentator Holger Zschaepitz said that Bitcoin has crashed more than 80% four times in history. That puts the current fall of about 74% within historical standards. Previous bear markets have bottomed out just below the 200-week moving average, according to market analyst Rekt Capital. If history repeats itself, Bitcoin is unlikely to stay at the current depressed levels for a long time.Crypto market data daily view. Source: Coin360Coinglass data suggests that Bitcoin’s 39% loss in June of this year is the worst ever since 2013. While several investors expect Bitcoin to bottom out soon, crypto critic Peter Schiff warned that the selling could continue and the largest cryptocurrency may drop to $3,000.Could bulls arrest the decline in Bitcoin in the short term? If that happens, let’s study the charts of the top-5 cryptocurrencies that may outperform the other coins.BTC/USDTBitcoin plummeted below the crucial support of $20,111 on June 18, indicating the resumption of the downtrend. A minor positive is that the bulls purchased the dip as seen from the long tail on the day’s candlestick.BTC/USDT daily chart. Source: TradingViewThe buyers are attempting to push the price back above the breakdown level of $20,111. If they manage to do that, it will suggest that the drop to $17,622 on June 18 may have been a bear trap. The BTC/USDT pair could then rally to $23,362 where the bears may again mount a strong resistance.The relative strength index (RSI) has been trading in the oversold zone for the past few days which suggests a relief rally in the near term.This positive view could invalidate if the price turns down from $20,111. That will suggest the bears have flipped the level into resistance and increase the possibility of a break below $17,622. The next support on the downside is $16,000.BTC/USDT 4-hour chart. Source: TradingViewThe positive divergence on the RSI suggests that the bears may be losing their grip. The 4-hour chart shows that the price has recovered to the 20-exponential moving average. This is an important level for the bears to watch out for because a break and close above it could push the pair to the overhead resistance zone between the 50-simple moving average and $23,362. Conversely, if the price fails to sustain above the 20-EMA, it will suggest that bears are active at higher levels. The sellers will then again try to pull the pair to $17,622.SOL/USDTSolana (SOL) has been in a strong downtrend but the positive divergence on the RSI suggests that the bearish momentum could be weakening. SOL/USDT daily chart. Source: TradingViewThe bulls will try to push the price above the 20-day EMA ($36). If they succeed, it will suggest that the bulls are on a comeback. The SOL/USDT pair could thereafter rise to the 50-day SMA ($50) where the bears may again mount a strong defense.On the contrary, if the price turns down from the 20-day EMA, it will suggest that the bears are in no mood to surrender their advantage. The sellers will then again try to sink the price below $25 and start the next leg of the downtrend.SOL/USDT 4-hour chart. Source: TradingViewThe bulls have pushed the price above the moving averages on the 4-hour chart and will attempt to clear the overhead hurdle at the downtrend line. If they do that, it will suggest that the downtrend may have ended in the short term. The buyers will then try to push the price to $42.50 and later to $45.Conversely, if the price turns down from the current level or the downtrend line and breaks below the moving averages, it will suggest that bears continue to defend the overhead resistance aggressively. That could pull the price to $27.50 and later to $25.LTC/USDTThe bears attempted to sink Litecoin (LTC) below the strong support at $40 on June 18 but the long tail on the day’s candlestick suggests that the bulls are defending the level aggressively.LTC/USDT daily chart. Source: TradingViewThe relief rally has reached the 20-day EMA ($55) which is an important level to keep an eye on because a break and close above it could suggest a potential change in trend. The LTC/USDT pair could thereafter rise to the 50-day SMA ($68).Contrary to this assumption, if the price turns down from the 20-day EMA, it will suggest that the trend remains negative and traders are selling on rallies. The bears will then make another attempt to sink the pair below $40 and resume the downtrend.LTC/USDT 4-hour chart. Source: TradingViewThe price has broken out of a symmetrical triangle pattern on the 4-hour chart. Although this setup usually acts as a continuation pattern, sometimes it indicates a possible reversal. The moving averages have completed a bullish crossover, suggesting advantage to buyers. If buyers sustain the price above the triangle, the pair could rise to the pattern target of $62.This positive view could invalidate in the short term if the price turns down and re-enters the triangle. Such a move will suggest that the break above the triangle may have been a bull trap.Related: Elon Musk’s support for Dogecoin grows stronger following $258B lawsuitLINK/USDTChainlink (LINK) is in a downtrend but it is trying to form a bottom near $5.50. The bears pulled the price below this level on June 13, June 14 and June 18 but they could not sustain the lower levels. This suggests that bulls are buying on dips.LINK/USDT daily chart. Source: TradingViewThe positive divergence on the RSI suggests that the bearish momentum may be weakening. The buyers will try to push the price toward the downtrend line, which is likely to act as a stiff resistance.If the price turns down from the downtrend line, the bears will again attempt to sink and sustain the LINK/USDT pair below the $5.50 support. If that happens, it will suggest the resumption of the downtrend.Alternatively, if buyers thrust the price above the downtrend line, it will suggest a potential trend change. The pair could then rise to $10 and later to $12.LINK/USDT 4-hour chart. Source: TradingViewThe rebound in the pair has reached the 50-SMA which may act as a minor resistance. The 20-EMA is flattening out and the RSI is near the midpoint, suggesting that the bears may be losing their grip.If buyers push the price above the 50-SMA, the pair could rise to $7.51. A break and close above this resistance will complete a double bottom pattern in the short term. This reversal setup has a pattern target of $9.50.To invalidate this bullish view, the bears will have to pull and sustain the price below the strong support at $5.50. BSV/USDBitcoin SV (BSV) has formed a broadening pattern and the buyers are attempting to push the price above the resistance of the setup. The RSI is showing a positive divergence, indicating that the bearish momentum is weakening.BSV/USD daily chart. Source: TradingViewThe BSV/USD pair could rally to the resistance line where the bears may try to stall the recovery. If that happens, it will suggest that bears continue to sell on rallies. That could keep the pair stuck inside the broadening formation for some more time.Conversely, if bulls drive the price above the resistance line, it will suggest that the pair may have bottomed out. The pair could then start a new up-move which could push the pair to $80 and then $87. BSV/USD 4-hour chart. Source: TradingViewThe 4-hour chart shows that the pair has been trading inside a large range between $45 and $66. After a failed attempt by the bears to pull the pair below the range, the bulls will attempt to push the price above the resistance.If they succeed, the pair could start a new up-move. The pattern target of this setup is $87. Another possibility is that the price turns down from $66. If that happens, it will suggest that the pair may remain range-bound for some more time.The views and opinions expressed here are solely those of the author and do not necessarily reflect the views of Cointelegraph. Every investment and trading move involves risk, you should conduct your own research when making a decision.

Čítaj viac

Získaj BONUS 8 € v Bitcoinoch

nakup bitcoin z karty

Registrácia Binance

Burza Binance

Aktuálne kurzy