Autor Cointelegraph By Rakesh Upadhyay

Price analysis 7/4: BTC, ETH, BNB, XRP, ADA, SOL, DOGE, DOT, LEO, SHIB

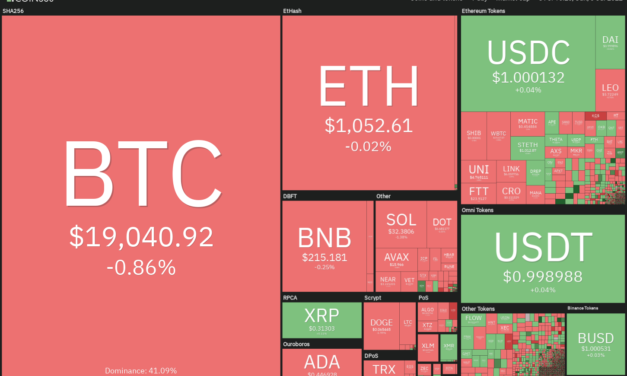
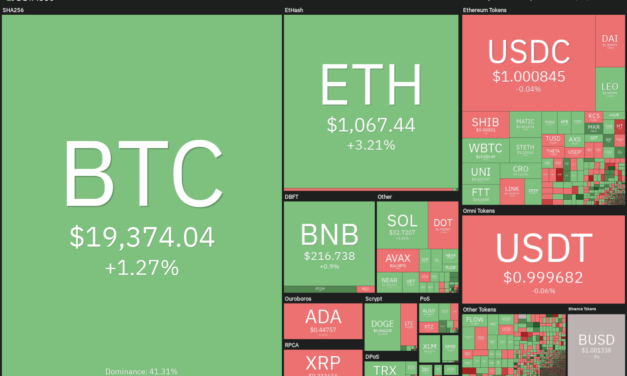
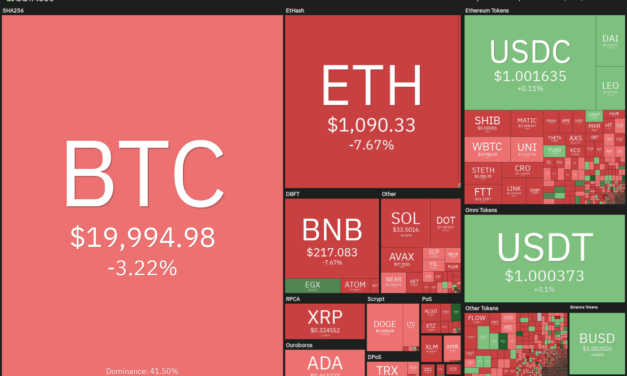
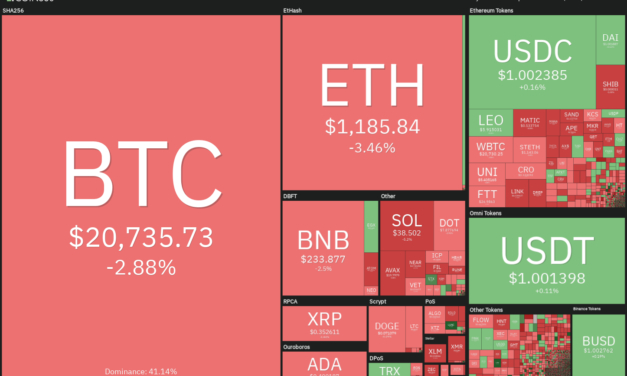
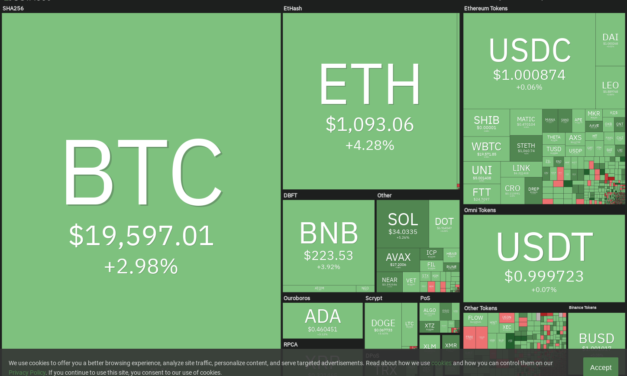
The crypto markets have remained relatively stable over the weekend and on July 4, which is a holiday for the United States financial markets due to Independence Day. Although Arthur Hayes, former CEO of derivatives platform BitMEX, was expecting a “mega crypto dump” around July 4, it has not materialized.The drop in Bitcoin’s (BTC) volatility in the past few days has resulted in the squeezing of the Bollinger Band’s width. This indicates a possible increase in volatility in the next few days, according to popular analyst Matthew Hyland. Daily cryptocurrency market performance. Source: Coin360Meanwhile, crypto investors seem to be waiting for clues from the U.S. equities markets and the U.S. dollar. Bitcoin’s correlation coefficient with the dollar in the week ending July 3 slumped to 0.77 below zero, the lowest level in seventeen months. The majority of the analysts surveyed by JP Morgan expect the dollar to end at or below the current price levels of about 105. Any weakness in the dollar could be beneficial for Bitcoin.Could bulls start a recovery in the short term? Let’s study the charts of the top-10 cryptocurrencies to find out.BTC/USDTThe failure of the bears to extend Bitcoin’s decline below $19,637 suggests a lack of sellers at lower levels. The bulls will now attempt to push the price back above the resistance at $19,637.BTC/USDT daily chart. Source: TradingViewIf that happens, the BTC/USDT pair could rise to the 20-day exponential moving average (EMA) ($21,255). This level could again act as a stiff resistance but if bulls clear this hurdle, the pair may rise to the overhead zone between $22,000 and $23,362. A break above this zone could open the doors for a possible rally to the 50-day simple moving average (SMA) ($25,710). The bulls will have to overcome this barrier to signal a potential trend change.On the contrary, if the price turns down from the 20-day EMA, it will suggest that the sentiment remains bearish and traders are selling on rallies. That could increase the possibility of a retest of the critical support at $17,622. If this support cracks, the decline could extend to $15,000.ETH/USDTEther (ETH) slipped below the psychological level at $1,000 on June 30 but the bears could not capitalize on this weakness. This suggests that bulls are buying on dips.ETH/USDT daily chart. Source: TradingViewThe bulls will now try to push the price above the 20-day EMA ($1,192) and gain the upper hand. If they do that, the ETH/USDT pair could rise to $1,280 and then to the 50-day SMA ($1,535). This level could again act as a strong resistance. The bulls will have to propel the price above $1,700 to signal the start of a new up-move.Conversely, if the price turns down from the 20-day EMA, it will suggest that the sentiment remains negative and bears are selling on rallies. The bears will then try to sink the price below $998 and challenge the critical support at $881.BNB/USDTThe buyers have successfully defended the support at $211 since June 29, indicating strong demand at lower levels. The bulls are presently attempting to push BNB above the 20-day EMA ($231). BNB/USDT daily chart. Source: TradingViewIf they succeed, it will suggest that the BNB/USDT pair may have bottomed out at $183. The buyers will then attempt to drive the pair to the 50-day SMA ($266). A break and close above this resistance could signal a potential change in trend.Contrary to this assumption, if the price turns down from the 20-day EMA, it will suggest that bears are selling on every minor rally. The bears will then again try to sink the price below $211 and gain the upper hand.XRP/USDTXRP has been trading inside a symmetrical triangle pattern, indicating indecision among the bulls and the bears. The symmetrical triangle usually acts as a continuation pattern but on some occasions, it also behaves as a reversal pattern.XRP/USDT daily chart. Source: TradingViewThe price has rebounded off the support line of the triangle and the bulls will attempt to push the XRP/USDT pair above the 20-day EMA ($0.33). If they succeed, the pair could rise to the resistance line of the triangle. A break and close above this level could suggest the start of a new up-move. The pair could then rally to $0.48.Another possibility is that the price turns down sharply from the 20-day EMA and breaks below the support line of the triangle. That could pull the pair down to the critical support at $0.28. If this level cracks, the next stop could be $0.23.ADA/USDT Although Cardano (ADA) has been trading near the $0.44 level since June 30, the bears have not been able to pull and sustain the price below the support. This suggests that bulls are buying the dips toward $0.44.ADA/USDT daily chart. Source: TradingViewThe buyers are currently attempting to push the price above the 20-day EMA ($0.48). If they accomplish this task, the ADA/USDT pair could rise to the 50-day SMA ($0.51). This is an important level to keep an eye on because a break and close above it could suggest that the bears may be losing their grip.Alternatively, if the price turns down from the moving averages, it will suggest that bears are active at higher levels. The sellers will then try to sink the pair below $0.44 and challenge the critical level at $0.40.SOL/USDTSolana (SOL) has been trading just below the 20-day EMA ($35) for the past few days but the bears have not been able to capitalize on this weakness. This suggests a lack of sellers at lower levels.SOL/USDT daily chart. Source: TradingViewThe buyers will now attempt to push the price above the 20-day EMA. If they can pull it off, the SOL/USDT pair could rise to the 50-day SMA ($40). A break and close above this resistance could open the doors for a possible rally to the psychological level at $50.On the other hand, if the price turns down from the moving averages, it will suggest that the sentiment remains negative and traders are selling on minor rallies. The bears will then try to pull the pair below $30. If they do that, the pair could decline to $27 and then to $25.DOGE/USDTDogecoin (DOGE) has been clinging to the 20-day EMA ($0.07) for the past few days. This suggests that the bulls are buying the intraday dips as they expect a move higher.DOGE/USDT daily chart. Source: TradingViewThe 20-day EMA has flattened out and the relative strength index (RSI) is near the midpoint, indicating that the selling pressure may be reducing. The bulls will attempt to push the price above the 50-day SMA ($0.07) and challenge the immediate resistance at $0.08. If this level is crossed, the DOGE/USDT pair could rise to $0.10.On the contrary, if the price turns down from the current level or the 50-day SMA, it will suggest that the bears are defending the moving averages with vigor. The sellers will then try to sink the pair below $0.06 and gain the upper hand.Related: Hodlers and whales: Who owns the most Bitcoin in 2022?DOT/USDTPolkadot (DOT) has been trading between $7.30 and $6.36 since June 30. This suggests that bulls are buying at lower levels but the bears have not allowed the price to rise above the range.DOT/USDT daily chart. Source: TradingViewAlthough the downsloping 20-day EMA ($7.52) indicates advantage to sellers, the positive divergence on the RSI indicates that the bearish momentum could be weakening. If buyers drive the price above the 20-day EMA, the DOT/USDT pair could rally to the 50-day SMA ($8.63). This bullish view could be invalidated if the price turns down and plummets below the crucial support at $6.36. If that happens, the pair could resume its downtrend toward the next support at $5.LEO/USDThe bulls and the bears are battling it out for supremacy near the resistance line of the descending channel. UNUS SED LEO (LEO) dipped to the 20-day EMA ($5.65) on July 2 but the bulls successfully defended the level.LEO/USD daily chart. Source: TradingViewThe buyers are again attempting to clear the resistance line of the channel. The rising 20-day EMA and the RSI in the positive territory indicate that the path of least resistance is to the upside. If the price sustains above $6, the LEO/USD pair could pick up momentum and rally to $6.50. Above this level, the rally could extend to the pattern target at $6.90.Contrary to this assumption, if the price once again turns down from $6, it will suggest that bears are aggressively defending this level. The bears will then attempt to sink the pair below the 20-day EMA. If they manage to do that, the pair could slide to the 50-day SMA ($5.30).SHIB/USDTShiba Inu (SHIB) has been trading close to the psychological level at $0.000010. This suggests that the bulls are attempting to form a higher low near this support.SHIB/USDT daily chart. Source: TradingViewThe 20-day EMA ($0.000010) is flat and the RSI is near the midpoint, indicating a balance between supply and demand. If the price breaks above the 50-day SMA ($0.000010), the SHIB/USDT pair could rally to $0.000012. This level could again act as a stiff barrier but if cleared, the pair could rise to $0.000014.Conversely, if the price turns down from the moving averages, the bears will try to pull the pair below $0.000009. If they succeed, the pair could retest the critical support at $0.000007.The views and opinions expressed here are solely those of the author and do not necessarily reflect the views of Cointelegraph.com. Every investment and trading move involves risk, you should conduct your own research when making a decision.

Čítaj viac

Top 5 cryptocurrencies to watch this week: BTC, SHIB, MATIC, ATOM, APE

The bears are attempting to sink Bitcoin (BTC) below $19,000 to further cement their advantage over the crypto market. Analysts watching Bitcoin’s MVRV-Z Score, a metric which measures how high or low Bitcoin’s price is relative to “fair value,” expect an even deeper fall before the bottom is finally reached.However, economist, trader and entrepreneur Alex Krueger pointed out that Bitcoin’s volume hit an all-time high in June. Usually, the highest volume in a downtrend is indicative of capitulation and that “creates major bottoms.” If Bitcoin follows the historical pattern of the 2018 bear market, Krueger expects the bottom to form in July.Crypto market data daily view. Source: Coin360Due to the tight correlation between Bitcoin and the S&P 500, crypto traders will have to keep a close eye on the performance of the United States equities markets next week, which may be influenced by the release of minutes from the U.S. Federal Reserve’s last meeting and the June jobs report.Could Bitcoin form a higher low and lead the crypto markets toward the path of recovery? Let’s study the charts of the top-5 cryptocurrencies that indicate the possibility of a relief rally in the short term.BTC/USDTThe long wick on Bitcoin’s July 1 candlestick shows that bears continue to sell on rallies near the 20-day exponential moving average ($21,396). Although bears pulled the price below $19,637, they have not been able to build upon the momentum.BTC/USDT daily chart. Source: TradingViewThe bulls are attempting to push the price back above $19,637. If they succeed, the BTC/USDT pair could again rise toward the 20-day EMA. A break and close above $22,000 could indicate a potential trend change. The pair could then attempt a rally to the 50-day simple moving average ($25,938).On the contrary, if the price turns down from the current level, it will suggest that bears remain in control. The sellers will then strive to pull the price below $18,626. If they do that, the pair could slide to the important support zone of $17,960 to $17,622.This is an important zone for the bulls to defend because a failure to do so could start the next leg of the downtrend. The pair could then slide to $15,000. BTC/USDT 4-hour chart. Source: TradingViewThe 4-hour chart shows that bears are aggressively defending the 20-EMA. Both moving averages are sloping down and the relative strength index (RSI) is in the negative zone, indicating that bears have the upper hand. A break below $18,626 could further strengthen the bears.This bearish view could be negated in the short term if bulls push the price above the 20-EMA. The pair could then rise to the 50-SMA where the bears may again pose a strong challenge. If the price rises above this resistance, the pair could rally to $21,000 and thereafter to $22,000.SHIB/USDTShiba Inu (SHIB) has been trading in a tight range near the moving averages as the bulls attempt to form a higher low near $0.000009. Usually, a tight range trading is followed by a range expansion.SHIB/USDT daily chart. Source: TradingViewIf the price breaks above the 50-day SMA ($0.000010), the SHIB/USDT pair could pick up momentum and rally to $0.000012 and then toward $0.000014. A break and close above this level could signal a potential change in trend.Contrary to this assumption, if the price breaks below $0.000009, it could trap the bulls who may have bought the break above the 50-day SMA. That could clear the path for a possible retest of $0.000007. A break below this crucial support may indicate the resumption of the downtrend.SHIB/USDT 4-hour chart. Source: TradingViewThe 4-hour chart shows the formation of a symmetrical triangle pattern. The pair has been stuck between the 20-EMA and the support line of the triangle. If bears sink and sustain the price below the support line, the pair could drop to $0.000009. A break below this support could signal that bears are back in the driver’s seat.Conversely, if bulls push the price above the 20-EMA, the pair could rise to the resistance line of the triangle. If this level is crossed, the pair could rise to $0.000011 and then dash toward $0.000012.MATIC/USDTPolygon (MATIC) turned down from the strong overhead resistance of $0.61 on June 26 and the bears pulled the price below the 20-day EMA ($0.50) on June 28. A minor positive is that the bulls did not allow the bears to build upon their advantage and bought the dip on June 30.MATIC/USDT daily chart. Source: TradingViewSince then, the MATIC/USDT pair has been trading near the 20-day EMA. This suggests that the bulls are attempting to push the price back above the level. If they succeed, the pair could again try to clear the hurdle at $0.61. The RSI has made a positive divergence, indicating that the bears may be losing their grip. A break above $0.61 could clear the path for a possible rally to $0.75.Contrary to this assumption, if the price turns down from the current level and slips below $0.41, it will suggest that the recent recovery may have been a bear market rally. The sellers will then attempt to pull the price back toward the crucial support at $0.31.MATIC/USDT 4-hour chart. Source: TradingViewThe buyers pushed the price above the downtrend line and the 20-EMA but could not clear the psychological level of $0.50. This attracted selling and the bears have pulled the price to $0.45. If this support cracks, a retest of $0.41 is likely.On the contrary, if the price rebounds off the current level, it will suggest that the bulls are buying on dips. The bulls will then make another attempt to clear the overhead resistance at $0.50. If they succeed, the pair could rally to $0.55 and then to $0.61.Related: Bitcoin’s inverse correlation with US dollar hits 17-month highs — what’s next for BTC?ATOM/USDTAfter a prolonged downtrend, Cosmos (ATOM) is attempting to form a bottom. The buyers pushed the price above the 20-day EMA ($7.84) on July 1 but the 50-day SMA ($8.81) is likely to act as a strong barrier.ATOM/USDT daily chart. Source: TradingViewThe flattish 20-day EMA and the RSI near the midpoint indicate that the selling pressure may be reducing. If buyers thrust the price above the 50-day SMA, the bullish momentum may pick up and the ATOM/USDT pair could rally to $10.84 and then to $12.50. A break and close above this level could suggest a potential trend change.This bullish could invalidate in the short term if the price turns down from the current level and breaks below $6.89. If that happens, the pair could again retest the critical support at $5.55.ATOM/USDT 4-hour chart. Source: TradingViewThe 4-hour chart shows that bulls are attempting to flip the 50-SMA into support. If the price rises from the current level and breaks above $8.38, the bulls could challenge the immediate resistance at $8.75. A break above this level could signal the resumption of the up-move. The pair could then rise to $9.Conversely, if the price turns down and plummets below the moving averages, it will suggest that bears continue to sell at higher levels. The pair could then slide toward $7.18 and then $6.89. APE/USDTBuyers pushed and closed ApeCoin (APE) above the 20-day EMA ($4.69) on June 27 but they could not build upon the recovery. The bears pulled the price back below the 20-day EMA on June 29 but a positive sign is that the bulls have not given up much ground. APE/USDT daily chart. Source: TradingViewThis suggests that the buyers are not dumping their position as they anticipate a move higher. The flattening 20-day EMA and the RSI just below the midpoint suggest that the selling pressure could be reducing.If buyers drive the price above the 20-day EMA, it could tilt the advantage in their favor. The APE/USDT pair could then rally to the 50-day SMA ($5.72) where the bears are expected to mount a strong defense.Contrary to this assumption, if the price turns down from the current level and plummets below $4.21, the next stop could be $3.85.APE/USDT 4-hour chart. Source: TradingViewThe 4-hour chart shows a symmetrical triangle formation, indicating indecision among buyers and sellers. Both moving averages are flat and the RSI is near the midpoint, suggesting a status of equilibrium.If the price dips below the triangle, it will suggest that bears have asserted their supremacy. The pair could then decline to the pattern target of $3.78.Alternatively, if the price rises from the current level and breaks above the triangle, it could signal advantage to the bulls. The pair could then rise to $5.38 and later to $5.57.The views and opinions expressed here are solely those of the author and do not necessarily reflect the views of Cointelegraph. Every investment and trading move involves risk, you should conduct your own research when making a decision.

Čítaj viac

Price analysis 7/1: BTC, ETH, BNB, XRP, ADA, SOL, DOGE, DOT, LEO, SHIB

Bitcoin dropped 56.2% in the second quarter of 2022, according to crypto analytics platform Coinglass. That makes it Bitcoin’s worst quarter since the third quarter of 2011 when BTC price fell by 67%. A large part of the damage was done in the month of June when Bitcoin plunged 37%, the worst monthly drawdown since September 2011.It is not all gloom and doom for crypto investors. On June 29, JPMorgan strategist Nikolaos Panigirtzoglou said that the “Net Leverage metric” suggests that crypto’s deleveraging may be on its last legs. The eagerness of crypto companies with stronger balance sheets to bail out crypto firms in distress is also a positive sign.Daily cryptocurrency market performance. Source: Coin360Another positive view on Bitcoin came from Deutsche Bank analysts. In a recent report, the strategists said that the S&P 500 could recover lost ground and rally to the levels seen in January. This could benefit Bitcoin due to its close correlation with the S&P 500.Could the downtrend resume or will lower levels attract buyers? Let’s study the charts of the top-10 cryptocurrencies to find out.BTC/USDTBitcoin plummeted below the immediate support at $19,637 on June 30 but the long tail on the candlestick indicates strong buying at lower levels. The bulls tried to build upon the momentum on July 1 and push the price toward the overhead resistance at $22,000 but the long wick on the candlestick shows that bears are active at higher levels.BTC/USDT daily chart. Source: TradingViewIf the price sustains below $19,637, the likelihood of a retest of the critical support at $17,622 increases. The downsloping moving averages and the relative strength index in the oversold zone indicate that bears are in control.A break and close below $17,622 could signal the resumption of the downtrend. The next support is at $15,000.This negative view could invalidate in the short term if the price rises above the 20-day exponential moving average (EMA) ($21,907). Such a move could clear the path for a possible rally to the 50-day simple moving average (S($26,361).ETH/USDTEther (ETH) dipped below the immediate support of $1,050 on June 30 but the bulls purchased the dip. The buyers tried to extend the recovery on July 1 but the long wick on the candlestick shows that bears are selling on minor rallies.ETH/USDT daily chart. Source: TradingViewThe bears will try to pull the price below the psychological level of $1,000. If they succeed, the selling could pick up momentum and the ETH/USDT pair could drop to the important support at $881. If this level gives way, the pair could resume the downtrend. The next support is at $681.Contrary to this assumption, if the price rebounds off the current level or $1,000, the bulls will attempt to push the pair above the 20-day EMA. If they can pull it off, it will suggest that bears may be losing their grip. The bullish momentum could pick up on a break above $1,280.BNB/USDTBNB dipped below the strong support at $211 on June 30 but the lower levels attracted strong buying as seen from the long tail on the day’s candlestick.BNB/USDT daily chart. Source: TradingViewThe buyers tried to extend the recovery on July 1 but the long wick on the candlestick shows that bears are defending the 20-day EMA ($234) aggressively. The downsloping 20-day EMA and the RSI in the negative territory indicate advantage to sellers.If the price sustains below $211, the BNB/USDT pair could retest the crucial support at $183. If this support cracks, the downtrend could resume. The next support is at $150.This negative view could invalidate in the short term if the price turns up and breaks above the 20-day EMA. That could clear the path for a possible rally to the 50-day SMA ($271).XRP/USDTRipple (XRP) attempted a recovery on June 30 but the bulls could not push the price above the overhead resistance at $0.35. This suggests that bears are not willing to let go of their advantage.XRP/USDT daily chart. Source: TradingViewThe XRP/USDT pair could drop to the strong support at $0.28 where the bulls are likely to mount a strong defense. If the price rebounds off $0.28, it will suggest that bulls continue to buy at lower levels. The bulls will then make one more attempt to push the price above the 50-day SMA ($0.37).Conversely, if bears sink the price below $0.28, the next leg of the downtrend could begin. The pair could then decline to $0.23.ADA/USDT Cardano (ADA) bounced off $0.44 on June 30 but the bulls could not clear the 20-day EMA ($0.49) on July 1. This suggests that bears continue to defend the moving averages with vigor.ADA/USDT daily chart. Source: TradingViewThe downsloping 20-day EMA and the RSI in the negative zone indicate that the path of least resistance is to the downside. If the price slips below $0.44, the ADA/USDT pair could drop to the critical support of $0.40. The bulls are expected to defend this level with all their might because if the support cracks, the pair could resume its downtrend. The next support is at $0.33.Alternatively, if the price rebounds off $0.44 or $0.40, the buyers will again try to clear the overhead resistance at the moving averages. If they succeed, the pair could start a relief rally toward $0.70.SOL/USDTSolana (SOL) dipped below the immediate support at $33 on June 30 but the long tail on the candlestick shows strong buying at lower levels. The buyers tried to push the price above the 20-day EMA ($36) on July 1 but the bears did not relent. SOL/USDT daily chart. Source: TradingViewThe sellers will try to gain the upper hand by pulling the price below $30. If they manage to do that, the SOL/USDT pair could drop to $27 and later to the crucial support at $25.86. A break and close below this level could signal the resumption of the downtrend.Another possibility is that the price rebounds off $30. That will indicate accumulation at lower levels. The bulls will then try to clear the overhead hurdle at the moving averages and push the price to $50.DOGE/USDTDogecoin (DOGE) is witnessing a tough battle between the bulls and the bears near the 20-day EMA ($0.07). The RSI is just below the midpoint and the 20-day EMA has flattened out, indicating a minor advantage to sellers.DOGE/USDT daily chart. Source: TradingViewIf the price slips below $0.06, it will suggest that bears are back in the driver’s seat. The sellers will then attempt to sink the DOGE/USDT pair below the important support at $0.05 and resume the downtrend. The next support is at $0.04.On the contrary, if the price rises from the current level, the buyers will again attempt to clear the overhead hurdle at the 50-day SMA ($0.08). If they succeed, it will suggest that the bears may be losing their grip. The pair could then rally to the strong overhead resistance at $0.10.Related: What bear market? This token is quietly making new highs, up 300% against Bitcoin in 2022DOT/USDTPolkadot (DOT) broke and closed below the strong support at $7.30 on June 29. The buyers tried to push the price back above the level on June 30 but failed. This suggests that bears are selling on every minor rally.DOT/USDT daily chart. Source: TradingViewThe 20-day EMA ($7.74) has started to turn down and the RSI is in the negative territory, indicating that bears are in command. If the price breaks below $6.36, the DOT/USDT pair could start the next leg of the downtrend. The next support is at $5.Contrary to this assumption, if the price rebounds off the current level, the bulls will again attempt to clear the overhead resistance at the 20-day EMA. If they succeed, the pair could rally to the 50-day SMA ($8.89).LEO/USDUNUS SED LEO (LEO) turned down on June 30 but the bulls did not allow the price to slip back into the descending channel. This indicates that buyers are trying to flip the resistance line into support. LEO/USD daily chart. Source: TradingViewThe breakout from the channel indicates the start of a new up-move. The buyers pushed the price to $6.50 on July 1 but the long wick on the candlestick shows that bears are selling on rallies. If bulls sustain the price above $6, the LEO/USD pair may again rise to $6.50. If this level is cleared, the rally could extend to the pattern target of $6.90.To invalidate this bullish view, the bears will have to pull the price below the 20-day EMA ($5.63). If that happens, the pair may drop to the 50-day SMA ($5.27).SHIB/USDTShiba Inu (SHIB) closed below $0.000010 on June 28 but the bears could sustain the lower levels. The bulls bought the dip but are struggling to push the price above the 50-day SMA ($0.000010) SHIB/USDT daily chart. Source: TradingViewBoth moving averages have flattened out and the RSI is just below the midpoint. This suggests a status of equilibrium between the buyers and sellers. If the price breaks below $0.000009, it will suggest an advantage to bears. The SHIB/USDT pair could then decline to the crucial support of $0.000007. Alternatively, if bulls drive the price above the 50-day SMA, the pair could rise to $0.000012. This level may again act as a resistance but if crossed, the rally may reach $0.000014.The views and opinions expressed here are solely those of the author and do not necessarily reflect the views of Cointelegraph. Every investment and trading move involves risk. You should conduct your own research when making a decision.Market data is provided by HitBTC exchange.

Čítaj viac

Price analysis 6/29: BTC, ETH, BNB, XRP, ADA, SOL, DOGE, DOT, SHIB, LEO

The United States equities markets have given back some of the gains made last week and that has pulled Bitcoin to the psychological support at $20,000. This suggests that investors are nervous to buy risky assets at higher levels.Meanwhile, while speaking to the hosts of the Bankless podcast on June 23, Mark Cuban said that the crypto bear market could end after the price gets so cheap that investors go and start buying or an application with utility is launched that attracts users.Daily cryptocurrency market performance. Source: Coin360Several analysts expect Bitcoin to continue falling and eventually bottom out between $10,000 and $12,000. However, John Bollinger, the creator of the popular Bollinger Bands trading indicator, said that the monthly charts suggest that Bitcoin’s price has reached “a logical place to put in a bottom.”Could bears maintain the selling pressure and pull cryptocurrency prices lower? Let’s study the charts of the top 10 cryptocurrencies to find out.BTC/USDTBitcoin turned down from $22,000 on June 26 and has gradually slipped to the immediate support at $19,637. This suggests that the bears remain in command and every rally is being sold into.BTC/USDT daily chart. Source: TradingViewIf the price breaks below $19,637, the BTC/USDT pair could be at risk of dropping to the crucial support at $17,622. This is an important level to watch out for because a break and close below it could start the next leg of the downtrend. The pair could then decline to $15,000.On the other hand, if the price rebounds off $19,637, it will suggest demand at lower levels. The buyers will then try to push the price above the 20-day exponential moving average (EMA) ($22,393). If they succeed, the pair could rally to the 50-day simple moving average (SMA) ($26,735).ETH/USDTEther (ETH) turned down from the 20-day EMA ($1,268) on June 26, suggesting that the sentiment remains negative and traders are selling on rallies.ETH/USDT daily chart. Source: TradingViewThe downsloping moving averages and the RSI in the negative zone indicate that bears are in control. The sellers will attempt to pull the price below the immediate support at $1,050. If they succeed, the ETH/USDT pair could plunge to the June 18 intraday low of $881. A break below this support could signal the resumption of the downtrend. The next support on the downside is at $681.Contrary to this assumption, if the price rebounds off $1,050, it will suggest demand at lower levels. The buyers will then make another attempt to push the price above the 20-day EMA and start the journey toward $1,500 and later $1,700.BNB/USDTThe buyers failed to push and sustain BNB above the 20-day EMA ($238) between June 24 to 28. This resulted in profit-booking, which has pulled the price to the strong support of $211.BNB/USDT daily chart. Source: TradingViewThe 20-day EMA has started to turn down once again and the RSI has dipped into the negative territory. This suggests that bears have the upper hand. If the price slides below $211, the BNB/USDT pair could drop to the critical support of $183. If this support collapses, the pair could resume its downtrend and plummet toward $150.Conversely, if the price rebounds off $211, it will suggest that bulls are attempting to form a higher low. A strong bounce could increase the prospects of a break above $250. The pair could then rally to the 50-day SMA ($273).XRP/USDTRipple (XRP) slipped below the breakout level of $0.35 on June 28, which suggests that bears continue to sell aggressively at higher levels.XRP/USDT daily chart. Source: TradingViewThe 20-day EMA ($0.35) is flattish but the RSI has dropped below 40, suggesting that the bears have a slight edge. The sellers will attempt to pull the price to the vital support at $0.28. This is an important level to keep an eye on because if it gives way, the XRP/USDT pair could start the next leg of the downtrend.On the contrary, if the price turns up from the current level or $0.28, it will suggest that bulls are buying at lower levels. That could keep the pair range-bound between $0.28 and the 50-day SMA ($0.38) for a few days. ADA/USDT The bears thwarted repeated attempts by the bulls to push Cardano (ADA) above the 20-day EMA ($0.50) in the past few days. This suggests that the bears are defending the level aggressively.ADA/USDT daily chart. Source: TradingViewThe price could drop to the strong support zone at $0.44 to $0.40. If the price rebounds off this zone with strength, it will suggest that bulls are accumulating on dips. The buyers will then again try to propel the price above the moving averages. If they can pull it off, the ADA/USDT pair could start an up-move toward $0.70.This positive view could invalidate in the short term if bears sink the pair below the support zone. If that happens, the pair could indicate the resumption of the downtrend. The next support is at $0.33.SOL/USDTThe tight range trading in Solana (SOL) resolved to the downside with a break below the 20-day EMA ($37). The bears are attempting to pull the price below the immediate support at $33.SOL/USDT daily chart. Source: TradingViewIf they succeed, the SOL/USDT pair could decline to $27 and then retest the June 14 intraday low of $25.86. Contrary to this assumption, if the price rebounds off $33, it will suggest that the bulls are attempting to form a higher low. The buyers will then try to clear the overhead hurdle at $43. If that happens, the pair could signal a potential change in trend. The pair may then rise to $60 where the bears may again mount a strong defense.DOGE/USDTDogecoin (DOGE) turned down from the 50-day SMA ($0.08) on June 27 and broke below the 20-day EMA ($0.07) on June 28. This suggests that bears have not given up and they continue to sell on rallies.DOGE/USDT daily chart. Source: TradingViewThe bears will try to sink the price to $0.06. If this level cracks, the next stop could be a retest of the critical level at $0.05. Alternatively, if the price turns up from the current level or the support at $0.06 and rises back above the 20-day EMA, it will suggest that bulls are attempting to form a higher low. The bullish momentum could pick up on a break above $0.08. The DOGE/USDT pair could then attempt a rally to the psychological level of $0.10.Related: Double bubble? Terra’s defunct ‘unstablecoin’ suddenly climbs 800% in one weekDOT/USDTRepeated failures to push and sustain the price above the 20-day EMA ($7.93) may have tempted short-term traders to book profits in Polkadot (DOT). The price turned down from the 20-day EMA and slipped to $7.30 on June 28.DOT/USDT daily chart. Source: TradingViewBoth the bulls and the bears are battling it out for supremacy near the $7.30 level. If the bears come out on top, the DOT/USDT pair could drop to the crucial level of $6.36. The bulls are expected to defend this level aggressively because a break below it could signal the resumption of the downtrend. Conversely, if the price rebounds off the current level, the buyers will again try to achieve a close above the 20-day EMA. If they manage to do that, the pair could rise to the 50-day SMA ($8.97). SHIB/USDTShiba Inu (SHIB) slipped back below the 50-day SMA ($0.000011) on June 28, suggesting that the bears are active at higher levels. Although the price dipped below $0.000010, the bears have not been able to build upon this advantage. SHIB/USDT daily chart. Source: TradingViewThis suggests that selling dries up at lower levels. The bulls will again try to push the price above the 50-day SMA and challenge the resistance at $0.000012. A break and close above this level could open the doors for a possible rally to $0.000014. The 20-day EMA ($0.000010) has flattened out and the RSI is just below the midpoint, indicating a balance between supply and demand. If the price slips below $0.000009, the advantage could tilt in favor of the sellers. The pair may then drop to $0.000007.LEO/USDUNUS SED LEO (LEO) broke and closed above the resistance line of the descending channel on June 25 but the bulls could not push the price above $6. That may have attracted profit-booking from short-term traders, which pulled the price back into the channel on June 27. LEO/USD daily chart. Source: TradingViewThe 20-day EMA ($5.57) is sloping up and the RSI is in the positive territory, suggesting that bulls have the upper hand. The buyers are again attempting to clear the overhead hurdle at $6. If they succeed, the LEO/USD pair could rally to $6.50 and then to the pattern target at $6.90. Contrary to this assumption, if the price once again turns down from $6, it will suggest that bears are defending this level with vigor. The sellers will then attempt to sink the price below the 20-day EMA and challenge the 50-day SMA ($5.24).The views and opinions expressed here are solely those of the author and do not necessarily reflect the views of Cointelegraph. Every investment and trading move involves risk. You should conduct your own research when making a decision.Market data is provided by HitBTC exchange.

Čítaj viac

Price analysis 6/27: BTC, ETH, BNB, XRP, ADA, SOL, DOGE, DOT, SHIB, AVAX

Bitcoin’s (BTC) current bear market is one of the worst, according to a report by on-chain analytics firm Glassnode. This was the first time in history that the Mayer Multiple slipped below the previous cycle’s low. Bitcoin’s fall below $20,000 on June 18 also marked the biggest loss ever booked by investors in a single day at $4.23 billion. Considering the above factors and a few other events, Glassnode believes that the capitulation in Bitcoin may have started.Bitcoin whales seem to have started their purchasing, suggesting that the bottom may be close and on June 25, analytics resource “Game of Trades” highlighted that demand from whales holding 1,000 to 10,000 Bitcoin witnessed a sharp spike in demand.Daily cryptocurrency market performance. Source: Coin360Another sign that traders are purchasing comes from Glassnode comments suggesting that the 30-day average change in the supply kept on exchanges plummeted by 153,849 Bitcoin on June 26, the largest ever in history.Could bulls continue their purchases on dips and form a higher low? Let’s study the charts of the top-10 cryptocurrencies to find out.BTC/USDTBitcoin turned down from $22,000 on June 26, indicating that the sentiment remains negative and traders are selling on minor rallies. The bears will try to pull the price to the psychological level of $20,000.BTC/USDT daily chart. Source: TradingViewIf the price rebounds off $20,000, it will suggest that bulls are accumulating on dips. That could keep the pair range-bound between $20,000 and $22,000 for a few days. The first sign of strength will be a break and close above the 20-day exponential moving average (EMA) ($22,890). That could open the doors for a possible rally to the 50% Fibonacci retracement level at $24,693.This level could again act as a resistance, but if bulls overcome the barrier, the BTC/USDT pair could rally to the 50-day simple moving average (SMA)($27,150). The bulls will have to push the price above this level to indicate that the pair may have bottomed out.ETH/USDTEther (ETH) reached the 20-day EMA ($1,300) on June 26 but the bulls could not push the price above the resistance. This suggests that the bears are not willing to surrender their advantage easily.ETH/USDT daily chart. Source: TradingViewIf the price turns down from the current level, the bears will try to pull the ETH/USDT pair to $1,050. This is an important level to watch out for because a break below it could suggest that bears are in control.Conversely, if the price turns up from the current level or rises from $1,050, the bulls will try to propel the pair above the 20-day EMA. If they manage to do that, the pair could rally to the breakdown level of $1,700. A break and close above this resistance could indicate the start of a new uptrend.BNB/USDTBNB has been clinging to the 20-day EMA ($241) since June 24. This suggests that the bears are defending the level but the bulls have not yet given up as they anticipate a move higher.BNB/USDT daily chart. Source: TradingViewIf buyers thrust the price above the 20-day EMA, the BNB/USDT pair could rally to the 50-day SMA ($277). This level may again act as a stiff hurdle but if crossed, the pair could attempt a rally toward $350.Conversely, if the price turns down from the current level, the pair could drop to $211. This is an important level to keep an eye on because a rebound off it will suggest that bulls are attempting to form a higher low. But if the level cracks, the pair could retest the vital support at $183.XRP/USDTRipple (XRP) broke and closed above the overhead resistance at $0.35 on June 24 but the bulls could not clear the barrier at the 50-day SMA ($0.38). This suggests that the bears are defending the level aggressively.XRP/USDT daily chart. Source: TradingViewA minor positive is that the bulls have not allowed the price to dip back below the 20-day EMA ($0.35). This suggests buying on dips. If the price rebounds off the current level, the bulls will again attempt to push the price above the 50-day SMA. If they can pull it off, it will suggest that the downtrend could be weakening. The XRP/USDT pair could then rise to $0.45.Another possibility is that bears pull the price back below $0.35. If that happens, the pair could slide to $0.32 and then to $0.28.ADA/USDT The buyers pushed Cardano (ADA) above the 20-day EMA ($0.50) on June 26 but the long wick on the candlestick shows that bears aggressively sold at higher levels.ADA/USDT daily chart. Source: TradingViewA minor positive is that the bulls have not given up ground and are again attempting to clear the overhead hurdle at the moving averages. If they succeed, the ADA/USDT pair could rise toward $0.70 where the bears may again put up a strong defense. If the price turns down sharply from this level, it will suggest that the pair may remain range-bound between $0.40 and $0.70 for some more time. This positive view could be negated in the short term if the price turns down from the current level and breaks below $0.44. That could pull the pair to $0.40.SOL/USDTSolana (SOL) has been stuck between the moving averages since June 24. This suggests that bears are selling on rallies to the 50-day SMA ($43) and bulls are buying on dips to the 20-day EMA ($38).SOL/USDT daily chart. Source: TradingViewThe moving averages are close to a bullish crossover and the relative strength index (RSI) is near the midpoint, suggesting that bulls are attempting a comeback. If buyers propel the price above the 50-day SMA, the SOL/USDT pair could rise to $60. This level may again act as a stiff resistance but if bulls clear this hurdle, the momentum could pick up. On the contrary, if the price turns down and plunges below the 20-day EMA, it will suggest that bears have overpowered the bulls. The pair could then slide to $33.DOGE/USDTDogecoin (DOGE) broke and closed above the 20-day EMA ($0.07) on June 25. The buyers extended the recovery on June 26 and pushed the price to the 50-day SMA ($0.08) but the long wick on the candlestick suggests that bears are defending the level with vigor.DOGE/USDT daily chart. Source: TradingViewThe buyers are again trying to push the price above the 50-day SMA. If they manage to do that, the DOT/USDT pair could rally to $0.09 and then to the psychological level at $0.10. This level could again act as a resistance but if bulls overcome this barrier, the momentum is likely to pick up.Alternately, if the price fails to sustain above the 50-day SMA, it will suggest that bears continue to sell on rallies. The bears will then try to pull the price back below the 20-day EMA.Related: Dogecoin price could rally 20% in July with this bullish reversal patternDOT/USDTThe bears have been aggressively defending the 20-day EMA ($8.11) in Polkadot (DOT) since June 24 but a positive sign is that bulls have not given up much ground. A tight consolidation near a resistance usually resolves to the upside. DOT/USDT daily chart. Source: TradingViewIf buyers drive the price above the 20-day EMA, the DOT/USDT pair could rise to the 50-day SMA ($9.13). This level may again act as a hurdle but the likelihood of a break above it is high. If that happens, the pair could rally to $10.75.Contrary to this assumption, if the price turns down from the 20-day EMA, it will suggest that bears are active at higher levels. The sellers will then try to pull the pair below $7.30 and challenge the crucial support at $6.36.SHIB/USDTShiba Inu (SHIB) broke above the 50-day SMA ($0.000011) on June 25 but the bulls could not continue the recovery. The bears sold near $0.000012 on June 26 and are trying to pull the price back below the 50-day SMA.SHIB/USDT daily chart. Source: TradingViewThe 20-day EMA ($0.000010) has started to turn up gradually and the RSI is in the positive territory. This suggests that buyers have a slight edge. If the price rebounds off the current level or the 20-day EMA, the bulls will again attempt to resume the up-move.If the price rises above $0.000012, the SHIB/USDT pair could rally to the overhead resistance at $0.000014. This positive view could be negated in the short term if the price turns down and plummets below the 20-day EMA.AVAX/USDTAvalanche (AVAX) has been stuck in a tight range between the 20-day EMA ($20) and the overhead resistance at $21.35 since June 25. This suggests indecision among the bulls and the bears.AVAX/USDT daily chart. Source: TradingViewThe 20-day EMA has flattened out and the RSI is just below the midpoint, which suggests an equilibrium between buyers and sellers. If bulls push the price above $21.35, the AVAX/USDT pair could rally to the 50-day SMA ($25). This level may act as a minor hurdle but if crossed, the pair may rise to $30.This positive view could invalidate in the short term if the price turns down from the current level or the 50-day SMA and plummets below the 20-day EMA. That could open the doors for a possible decline to $16.The views and opinions expressed here are solely those of the author and do not necessarily reflect the views of Cointelegraph. Every investment and trading move involves risk. You should conduct your own research when making a decision.Market data is provided by HitBTC exchange.

Čítaj viac

Získaj BONUS 8 € v Bitcoinoch

nakup bitcoin z karty

Registrácia Binance

Burza Binance

Aktuálne kurzy