Autor Cointelegraph By Rakesh Upadhyay

Price analysis 8/17: BTC, ETH, BNB, XRP, ADA, SOL, DOGE, DOT, SHIB, AVAX

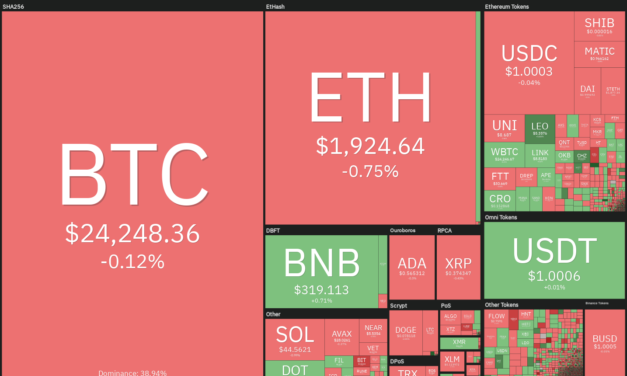
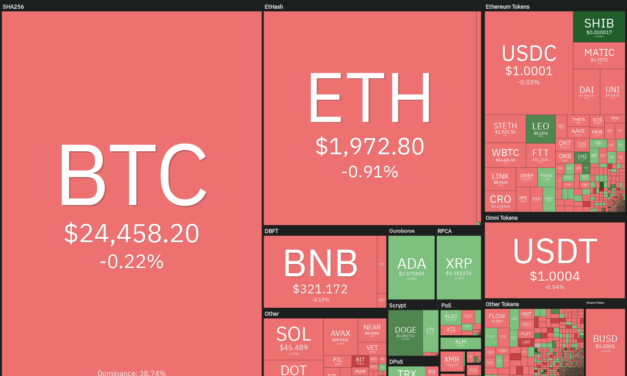
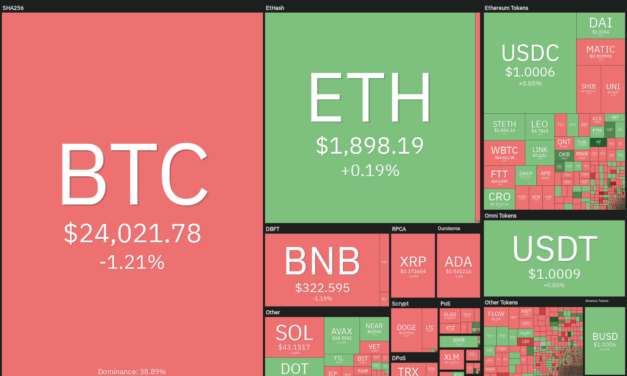
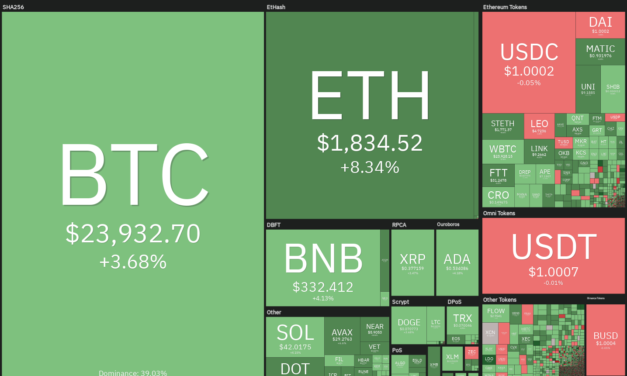
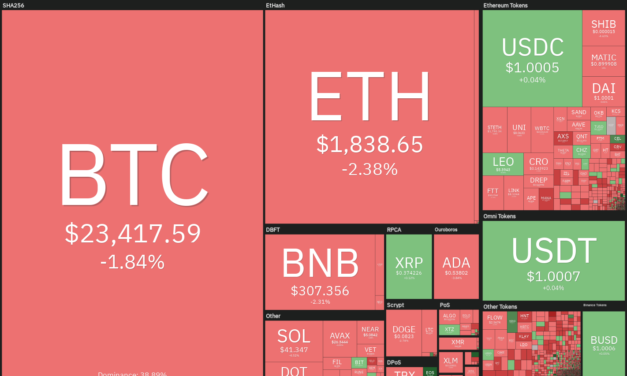
Bitcoin’s (BTC) bounce fizzled out near $24,500 on Aug. 17, indicating that the recovery still faces stiff resistance from the bears. On-chain monitoring resource Material Indicators said the ask liquidity on the Fire Charts was similar to prior local tops.Another reason for caution among crypto investors was that the recovery in the S&P 500 was reaching extreme overbought levels in the near term. Jurrien Timmer, director of global macro at asset manager Fidelity Investments, said that 88% of stocks in the S&P 500 were trading above their 50-day moving average, which was “stunning.”Some were also cautious as Michael Burry, the investor who famously shorted the 2008 housing bubble, almost emptied his equity portfolio in the second quarter of this year in expectation of a sharp fall in the stock markets.Daily cryptocurrency market performance. Source: Coin360While the short-term looks uncertain, corporate investors who usually are in the game for the long term have increased their investments in the blockchain industry, including the crypto space. The top 40 publicly traded companies invested approximately $6 billion into blockchain startups between September 2021 to June 2022, according to a blog by Blockdata on Aug. 17. That is more than three times the $1.9 billion invested by corporations between January 2021 to September 2021. What are the critical levels on the downside that will suggest that the recovery could be faltering? Let’s study the charts of the top-10 cryptocurrencies to find out.BTC/USDTThe bulls attempted to push Bitcoin above the overhead resistance at $24,668 on Aug. 17 but the long wick on the candlestick shows that bears are defending the level aggressively. The price turned down and has reached the 20-day exponential moving average (EMA) ($23,496). This level is likely to attract strong buying by the bulls.BTC/USDT daily chart. Source: TradingViewThe 20-day EMA has flattened out and the relative strength index (RSI) has dropped close to the midpoint, indicating a balance between supply and demand. If the price sustains below the 20-day EMA, the balance could tilt in favor of the bears and the pair may drop to the 50-day SMA ($22,160). Conversely, if the price rebounds off the current level and breaks above $25,200, it will suggest that bulls are back in command. The BTC/USDT pair could then rally to $28,000 where the bears may again mount a strong defense.ETH/USDTEther (ETH) turned up from $1,853 on Aug. 16 and the bulls tried to push the price above $2,000 on Aug. 17. However, the long wick on the day’s candlestick suggests that traders may be lightening positions on rallies.ETH/USDT daily chart. Source: TradingViewThe bears will try to take advantage of the situation and attempt to pull the price to the strong support zone between the 20-day EMA ($1,772) and $1,700. This is an important zone for the bulls to defend if they want to keep the uptrend intact.If the price rebounds off this support zone, the ETH/USDT pair could retest the resistance at $2,030. A break and close above this level could clear the path for a rally to the downtrend line.Instead, if the $1,700 support cracks, the pair could drop to the 50-day SMA ($1,492). That could delay the start of the next leg of the up-move and keep the pair range-bound for a few days.BNB/USDTThe buyers tried to push BNB higher on Aug. 17 but the long wick on the candlestick suggests that bears are active at higher levels. That pulled the price to the 20-day EMA ($307). BNB/USDT daily chart. Source: TradingViewIf the price slips below the 20-day EMA, the BNB/USDT pair could decline to the 50-day SMA ($270). This level may again attract buying and if the price rebounds off it, the pair could consolidate between $270 and $338 for some time.Another possibility is that the price rebounds off the current level with strength. If that happens, it will suggest that the sentiment remains positive and traders are buying on dips. The bulls will then again attempt to clear the overhead resistance zone between $338 and $350. If they succeed, the pair could start a rally to $383 and then to $413.XRP/USDTThe bulls successfully defended the zone between the moving averages and tried to push Ripple (XRP) above the overhead resistance at $0.39 on Aug. 17. The long wick on the day’s candlestick shows that bears are not willing to surrender and they continue to defend the overhead resistance with vigor.XRP/USDT daily chart. Source: TradingViewIf the price breaks and closes below the 20-day EMA ($0.37), the next stop could be the 50-day SMA ($0.35). This is an important level for the bulls to defend because a break and close below it could suggest that the XRP/USDT pair may continue its range-bound action between $0.30 and $0.39 for a few more days.Alternatively, if the price rebounds off the moving averages, the bulls will again try to clear the overhead hurdle at $0.39. If they succeed, the pair could rally to $0.48 and then to $0.54.ADA/USDT Cardano (ADA) bounced off the breakout level of $0.55 on Aug. 16 but the bears continue to pose a strong challenge at higher levels as seen from the long wick on the Aug. 17 candlestick.ADA/USDT daily chart. Source: TradingViewSharp selling by the bears has pulled the price to the important support at the $20-day EMA ($0.53). A break and close below this level will suggest that the short-term advantage has tilted in favor of the sellers. The ADA/USDT pair could then decline to the 50-day SMA ($0.49).Conversely, if the price rebounds off the 20-day EMA, it will suggest strong demand at lower levels. The bulls will then try to resume the up-move by pushing the pair above $0.60. That could open the doors for a possible rally to $0.63 and then to $0.70.SOL/USDTSolana (SOL) attempted a rebound off the 20-day EMA ($42) but the long wick on the Aug. 17 candlestick shows that the bears are selling on every minor rise.SOL/USDT daily chart. Source: TradingViewThe bears will try to sink the price below the support line. If they manage to do that, it will invalidate the developing bullish ascending triangle pattern. The SOL/USDT pair could then decline to $37.50 and later to $34.50.Alternatively, if the price rebounds off the moving averages, it will indicate that bulls may be accumulating on dips. The buyers will then try to push the price above the overhead resistance at $48. If they succeed, the bullish setup will complete and the pair may start a rally to $60.DOGE/USDTThe bears pulled Dogecoin (DOGE) below the breakout level of $0.08 on Aug. 15 but could not sustain the lower levels. The bulls purchased the dip aggressively and resumed the recovery on Aug. 16.DOGE/USDT daily chart. Source: TradingViewThe bears are trying to stall the recovery at $0.09 but if bulls do not allow the price to dip below $0.08, the likelihood of a rally to $0.10 increases. This is an important level to keep an eye on because a break and close above it could signal a potential trend change. The 20-day EMA ($0.07) has started to turn up and the RSI is in the positive territory, indicating that bulls have the upper hand. To invalidate this bullish view, the bears will have to sink and sustain the price below the trendline of the triangle.Related: Fake Manchester United token soars 3,000% after Elon Musk jokes about buying teamDOT/USDTThe bulls successfully defended the 20-day EMA ($8.62) on Aug. 15 and 16 but could not achieve a strong rebound off it. Attempts by the bulls to push Polkadot (DOT) above the overhead resistance at $9 met with stiff resistance on Aug. 17.DOT/USDT daily chart. Source: TradingViewThe bears are attempting to sustain the price below the 20-day EMA. If they succeed, it could trap several aggressive bulls who may have purchased at higher levels. That could sink the DOT/USDT pair to the 50-day SMA ($7.72).Conversely, if the price turns up from the current level and rises above $9, it will suggest that bulls are buying aggressively at lower levels. The bulls will then attempt to push the pair above the overhead resistance at $9.68 and resume the recovery. The pair could then rally to $10.80 and later to $12.44.SHIB/USDTShiba Inu’s (SHIB’s) correction stalled at $0.000015 on Aug. 15 but the bulls are facing stiff resistance at the overhead resistance of $0.000017 as seen from the long wick on the Aug. 16 and 17 candlesticks.SHIB/USDT daily chart. Source: TradingViewThe failure to clear the overhead hurdle may embolden the bears who will try to pull the price to the strong support at $0.000014. This is an important level for the bulls to defend because a break and close below it could weaken the positive momentum. The SHIB/USDT pair could then remain stuck inside a large range between $0.000010 and $0.000018 for a few days.Alternatively, if the price turns up from the current level and rises above the $0.000017 to $0.000018 overhead resistance zone, the pair could rise to $0.000022. If bulls clear this hurdle, the rally could extend to $0.000026.AVAX/USDTAvalanche (AVAX) continues to slide toward the breakout level of $26.38. The bulls are likely to buy the dip and attempt to flip this level into support.AVAX/USDT daily chart. Source: TradingViewIf the price rebounds off $26.38 with strength, the buyers will again try to push the AVAX/USDT pair above the overhead resistance at $31. If they succeed, the pair could rally to $33 and later to the pattern target of $39.05. Contrary to this assumption, if the price breaks below the breakout level, several aggressive bulls may get trapped. That could result in a decline to the 50-day SMA ($22.70) and then to the support line of the ascending triangle.The views and opinions expressed here are solely those of the author and do not necessarily reflect the views of Cointelegraph. Every investment and trading move involves risk. You should conduct your own research when making a decision.Market data is provided by HitBTC exchange.

Čítaj viac

Price analysis 8/15: BTC, ETH, BNB, XRP, ADA, SOL, DOGE, DOT, SHIB, AVAX

Bitcoin (BTC) has been witnessing a tough battle between the bulls and the bears near the $25,000 level. A clear winner may not emerge in the short term due to a lack of a catalyst and because there is no major macroeconomic data scheduled for this week in the United States. Data points from Asia or Europe may increase volatility, but they are unlikely to start a new directional move.Anthony Scaramucci, founder and managing partner of Skybridge Capital, in an interview with CNBC, advised investors to ride out the current uncertainty in cryptocurrencies and “stay patient and stay long term.” He expects Bitcoin to reward investors immensely with a sharp uptrend over the next six years.Daily cryptocurrency market performance. Source: Coin360Along with the focus on Bitcoin, investors are also keeping a close eye on Ether (ETH) ahead of its Merge scheduled for Sept. 15. A whale address that had participated in the genesis ICO but had remained dormant for three years has transferred about 150,000 Ether on Aug. 14. This has led to differing views with some speculating that the whale may dump his holdings after the Merge but others believe that the transfers may have been done to stake the huge quantity of Ether.Could buying emerge at lower levels and resume the up-move in Bitcoin and the altcoins? Let’s study the charts of the top-10 cryptocurrencies to find out.BTC/USDTThe bulls tried to resume the up-move in Bitcoin but the bears sold aggressively at $25,211 and pulled the price down to the 20-day exponential moving average (EMA) ($23,483). This resulted in the formation of an outside-day candlestick pattern on Aug. 15.BTC/USDT daily chart. Source: TradingViewThe gradually upsloping 20-day EMA and the relative strength index (RSI) in the positive territory indicate advantage to buyers. If the price rebounds off the 20-day EMA, it will suggest that bulls are buying the dips to this level. That could improve the prospects of a break and close above $24,668. If that happens, the pair could start its northward march toward $28,000 where the bears may again pose a strong challenge. Another possibility is that the bears sink the price below the 20-day EMA. If that happens, the pair could drop to the 50-day simple moving average (SMA) ($22,037) and later to the uptrend line. ETH/USDTEther repeatedly rose above the psychological resistance at $2,000 for the past two days but the bulls could not sustain the higher levels. This suggests that bears are posing a stiff challenge at this level. ETH/USDT daily chart. Source: TradingViewThe ETH/USDT pair could decline to the breakout level at $1,700. This is an important level to watch out for because if bulls flip $1,700 into support, it will increase the likelihood of a break above $2,000. If that happens, the pair could rally to the downtrend line. The upsloping 20-day EMA ($1,756) and the RSI in the positive territory indicate that bulls are in control. To invalidate this bullish view, bears will have to sink and sustain the price below the 20-day EMA. That could sink the pair to the 50-day SMA ($1,465).BNB/USDTBNB’s up-move hit a hurdle at the overhead resistance at $338. The bears will now try to sink the price to the immediate support at the 20-day EMA ($306).BNB/USDT daily chart. Source: TradingViewIf the price rebounds off this support, the buyers will make another attempt to push the BNB/USDT pair above the $338 to $350 resistance zone. The upsloping 20-day EMA and the RSI in the positive territory indicate the path of least resistance is to the upside.This positive view could invalidate in the near term if the price turns down and breaks below the 20-day EMA. If that happens, the short-term traders may rush to the exit and that could pull the pair to the 50-day SMA ($266).XRP/USDTThe bulls tried to push XRP above the overhead resistance at $0.39 on Aug. 13 and 14 but the bears held their ground. This may have attracted profit-booking from the short-term traders, which pulled the price below the 20-day EMA ($0.37).XRP/USDT daily chart. Source: TradingViewIf bears sink the price below the 50-day SMA, the XRP/USDT pair could stay range-bound between $0.30 and $0.39 for some more time. The flattish 20-day EMA and the RSI near the midpoint also suggest a consolidation in the near term.Conversely, if the price rebounds off the moving averages, it will indicate that lower levels are attracting buyers. The bulls will then again try to clear the overhead hurdle and push the pair to $0.48 and later to $0.54.ADA/USDT The bulls pushed Cardano (ADA) above the overhead resistance at $0.55 on Aug. 13 but could not maintain the momentum on Aug. 14. This suggests that bears are active at higher levels.ADA/USDT daily chart. Source: TradingViewThe price turned down on Aug. 15 and reached the breakout level of $0.55. The zone between $0.55 and the 20-day EMA ($0.53) is likely to attract strong buying by the bulls. If the price rebounds off this zone, the buyers will again attempt to resume the up-move and push the ADA/USDT pair to $0.63 and then to $0.70.On the contrary, if the price turns down and breaks below the 20-day EMA, it will suggest that the break above $0.55 may have been a bull trap. The pair could then drop to the 50-day SMA ($0.49).SOL/USDTSolana (SOL) rose to the overhead resistance at $48 on Aug. 13 but the bulls could not overcome this barrier. The bulls again tried to clear the overhead hurdle on Aug. 15 but the bears did not relent. SOL/USDT daily chart. Source: TradingViewIf the SOL/USDT pair breaks below the 20-day EMA ($42), the next stop could be the support line. This is an important level for the bulls to defend because a break and close below it could invalidate the bullish ascending triangle pattern. The pair could then decline to $32.Conversely, if the price rebounds off the 20-day EMA, the bulls will again try to push and sustain the pair above $48. If they manage to do that, the bullish setup will complete and the pair could rally to $60.DOGE/USDTDogecoin (DOGE) bounced off the 20-day EMA ($0.07) on Aug. 12 and broke above the overhead resistance at $0.08 on Aug. 14. This completed the bullish ascending triangle pattern but the bulls could not sustain the breakout.DOGE/USDT daily chart. Source: TradingViewThe bears sold at higher levels and pulled the price back below the breakout level on Aug. 15. A minor positive is that lower levels are attracting buyers, as seen from the long tail on the day’s candlestick. If the price sustains above $0.08, the buyers will try to resume the up-move and push the DOGE/USDT pair to $0.10.Contrary to this assumption, if the price slips below the moving averages and the trendline of the triangle, it will invalidate the bullish setup. The pair could then sink to $0.06.Related: Crypto-focused venture firm Dragonfly acquires hedge fund: BloombergDOT/USDTPolkadot (DOT) rose above the overhead resistance of $9.65 on Aug. 13 but the bulls could not sustain the higher levels. This may have tempted the short-term traders to book profits.DOT/USDT daily chart. Source: TradingViewThe DOT/USDT pair dipped below the breakout level of $9 on Aug. 14 and the price reached the 20-day EMA ($8.63) on Aug. 15. This is an important level to keep an eye on because a break below it could suggest that the bullish momentum has weakened. The pair could then decline to the 50-day SMA ($7.68) and stay range-bound for some time.Alternatively, if the price rebounds off the 20-day EMA, the bulls will try to clear the overhead resistance at $9.68. If they pull it off, the pair could rise to $10.80 and later to $12.44.SHIB/USDTShiba Inu (SHIB) had been trading above $0.000012 since Aug. 7 but the up-move had failed to pick up momentum. That changed with the sharp rally on Aug. 14, which pushed the price above the overhead resistance at $0.000017. SHIB/USDT daily chart. Source: TradingViewHowever, the bears have not given up. They sold the rise above $0.000017 and pulled the price back below the level on Aug. 15. The SHIB/USDT pair could find support at $0.000015 and then at $0.000014. If the price rebounds off either level, the buyers will again try to clear the overhead hurdle. If they succeed, the pair could rally to $0.000022.On the contrary, if the price breaks below $0.000014, it will indicate that the pair could oscillate in a large range between $0.000010 and $0.000018 for a few more days.AVAX/USDTBuyers tried to push Avalanche (AVAX) above the overhead resistance on Aug. 13 but the bears stalled the attempt at $30.35. This suggests that bears are active at higher levels.AVAX/USDT daily chart. Source: TradingViewThe AVAX/USDT pair could decline to the breakout level of $26.38, which is just above the 20-day EMA ($26.34). The bulls are expected to defend this level with vigor. If the price rebounds off $26.38, it will suggest demand at lower levels. The pair could then consolidate between $26.38 and $31 for some time.If bears sink the price below $26.38, several aggressive bulls may get trapped. That could sink the pair to the 50-day SMA ($22.39).Conversely, if the price rebounds off the current level and rises above $31, it will suggest the start of a rally to $33 and later to the pattern target of $39.05. The views and opinions expressed here are solely those of the author and do not necessarily reflect the views of Cointelegraph. Every investment and trading move involves risk. You should conduct your own research when making a decision.Market data is provided by HitBTC exchange.

Čítaj viac

Top 5 cryptocurrencies to watch this week: BTC, ADA, UNI, LINK, CHZ

The S&P 500 rose for the fourth successive week as investors cheered on signs that inflation may have peaked. Bitcoin (BTC) and select altcoins also extended their recovery, suggesting that investors are increasing their exposure to risk assets.A similar trend has played out in the cryptocurrency markets. Altcoins, led by Ether (ETH), have outperformed Bitcoin after clarity on Ethereum’s Merge, according to analysts at Glassnode.Crypto market data daily view. Source: Coin360However, trading firm QCP Capital is cautious about the momentum in the altcoin market. They highlighted that the open interest on Ether options had surged to $8 billion, exceeding Bitcoin option OI which was at $5 billion. Glassnode suggested that traders have been booking profits on the spread between their spot long Ether versus the quarterly short Ether futures positions.Could Bitcoin and the altcoins extend their recovery in the next few days? Let’s study the charts of the top-5 cryptocurrencies that may outperform in the near term.BTC/USDTBitcoin rose above the overhead resistance of $24,668 on Aug. 13 and Aug. 14 but the bulls could not sustain the higher levels. This indicates that bears are selling on rallies but repeated breach of an overhead resistance tends to weaken it. BTC/USDT daily chart. Source: TradingViewThe gradually upsloping 20-day exponential moving average ($23,414) and the relative strength index (RSI) in the positive territory indicate that the path of least resistance is to the upside. If bulls sustain the price above $25,000, the momentum could pick up further and the BTC/USDT pair could rally to $28,000.This level may act as a stiff resistance but if bulls clear this hurdle, the rally could extend to $32,000. The critical level to watch on the downside is the 20-day EMA. A bounce off it will indicate that the sentiment remains positive and traders are buying on dips.On the contrary, if the price turns down from the current level and breaks below the 20-day EMA, it will suggest that bears remain active at higher levels. The pair could then drop to the 50-day simple moving average ($21,976).BTC/USDT 4-hour chart. Source: TradingViewThe $24,668 level is witnessing a tough battle between the bulls and the bears. The upsloping moving averages indicate advantage to buyers but the negative divergence on the RSI suggests the momentum may be weakening.If the price breaks below the 20-EMA, it will signal a minor advantage to the bears. The pair could then decline to the 50-SMA and later to $23,600. Alternatively, if the price turns up from the 20-EMA and rises above $25,050, the up-move may resume. ADA/USDTCardano (ADA) broke and closed above the overhead resistance at $0.55 on Aug. 13. This indicates that the uncertainty has resolved in favor of the bulls.ADA/USDT daily chart. Source: TradingViewThe rising 20-day EMA ($0.52) and the RSI in the positive territory indicate that bulls have the upper hand. The ADA/USDT pair could rally to $0.63 and then to the strong overhead resistance at $0.70. This level is likely to attract strong selling by the bears.Contrary to this assumption, if the price turns down from the current level and breaks below the 20-day EMA, it will suggest that the break above $0.55 may have been a bull trap. The pair could then decline to the 50-day SMA ($0.49) and later to $0.45.ADA/USDT 4-hour chart. Source: TradingViewThe pair completed an ascending triangle pattern on a break and close above the overhead resistance at $0.55. This pushed the RSI on the 4-hour chart to overbought levels, which may have tempted short-term traders to book profits. The price may drop to the breakout level of $0.55. If bulls flip this level into support, the pair may continue its up-move to the pattern target at $0.65. This positive view could invalidate in the near term if the price plummets below the uptrend line.UNI/USDTUniswap (UNI) has been consolidating between $8.11 and $9.83 for the past few days. This suggests that the bulls are buying the dips but the bears are defending the overhead resistance.UNI/USDT daily chart. Source: TradingViewThe longer the price remains in the range, the stronger will be the breakout from it. The 20-day EMA ($8.54) is sloping up and the RSI is in the positive territory, indicating advantage to buyers. If bulls thrust the price above $9.83, the UNI/USDT pair could pick up momentum and rally toward $10.55 and later to $12. Alternatively, if the price turns down from the current level and breaks below the 20-day EMA, it will suggest that the pair may continue its range-bound action for some more time. The bears will have to sink and sustain the price below $8.11 to gain the upper hand.UNI/USDT 4-hour chart. Source: TradingViewThe 4-hour chart shows that the bears are defending the zone between $9.50 and $9.83. If the price breaks below $8.74, the sellers will attempt to sink the pair to the strong support at $8.11. The buyers are expected to buy the dip to this level. The flattening moving averages and the RSI near the midpoint suggest that the range-bound action may continue for some more time. The next trending move could start on a break above $9.83 or on a close below $8.11.Related: Bitcoin hits $25K as bearish voices call BTC price ‘double top’LINK/USDTChainlink (LINK) has been trading in a large range between $5.50 and $9.50 for the past several weeks. The bulls attempted to push the price above the range on Aug. 12 but the bears held their ground.LINK/USDT daily chart. Source: TradingViewThe 20-day EMA ($8) is sloping up and the RSI is in the positive territory, indicating that bulls have the upper hand. If the price rebounds off the 20-day EMA, the bulls will make one more attempt to clear the overhead hurdle at $9.50. If they succeed, the LINK/USDT pair could rally to $12.30 and then to $13.50.Instead, if the price breaks below the 20-day EMA, it will indicate that traders are booking profits near the resistance. That could sink the pair to the 50-day SMA ($7) and increase the stay inside the range for a few more days.LINK/USDT 4-hour chart. Source: TradingViewThe price turned down from the overhead resistance at $9.50 and broke below the 20-EMA on the 4-hour chart. This suggests that traders may be booking profits. The pair could drop to the 50-SMA, which may act as a strong support.If the price rebounds off the 50-SMA, the bulls will again try to push the pair above $9.50. If they succeed, the pair could start the next leg of the up-move. On the other hand, if the price slips below the 50-SMA, the pair could decline to $8.29.CHZ/USDTChiliz (CHZ) has been in a strong recovery for the past few days but the long wick on the Aug. 14 candlestick suggests that bears are defending the overhead resistance at $0.19.CHZ/USDT daily chart. Source: TradingViewAlthough the rising 20-day EMA ($0.14) indicates advantage to buyers, the RSI in the overbought territory suggests a minor correction or consolidation in the short term. If the price turns down from the current level, the first critical level to watch on the downside is the 20-day EMA.A strong rebound off this level will suggest that the bulls are viewing the dips as a buying opportunity. That will improve the prospects of a break above the overhead resistance. If that happens, the CHZ/USDT pair could rally to $0.22 and then to $0.24.Alternatively, if the price slips below the 20-day EMA, the pair could slide to the 50-day SMA ($0.12). Such a move will suggest that the pair may form a range in the near term.CHZ/USDT 4-hour chart. Source: TradingViewThe sharp rally in the pair pushed the RSI deep into the overbought territory on the 4-hour chart, indicating that a correction or consolidation was possible. The same may have started and the pair could decline to the 20-EMA, which is an important level to keep an eye on.If the price rebounds off the 20-EMA, it will suggest that the positive sentiment remains intact. The buyers will then again try to resume the up-move. This bullish view will be negated in the near term if the price breaks and sustains below the 50-SMA.The views and opinions expressed here are solely those of the author and do not necessarily reflect the views of Cointelegraph. Every investment and trading move involves risk, you should conduct your own research when making a decision.

Čítaj viac

Price analysis 8/12: BTC, ETH, BNB, XRP, ADA, SOL, DOGE, DOT, MATIC, AVAX

Bitcoin (BTC) could not overcome the barrier at $25,000 on Aug. 11 even though it had two catalysts in the form of a “favorable” Consumer Price Index print and news that BlackRock — the world’s largest asset manager, overseeing over $10 trillion in total assets — had launched a spot Bitcoin investment product. In comparison, Ether (ETH) has managed to hold on to its recent gains on news that the Goerli testnet had successfully activated proof-of-stake, clearing the path for Ethereum’s mainnet transition planned for Sept. 15 or 16. Data from Santiment shows that Ether whale transactions have increased along with possible whale accumulation.Daily cryptocurrency market performance. Source: Coin360However, analysts remain divided about the prospects of the current recovery. While some believe that Bitcoin’s rally could rise above $28,000, others are not so bullish and they expect the price to turn down and resume the downtrend.Could buyers clear the overhead hurdle in Bitcoin and select altcoins? Let’s study the charts of the top-10 cryptocurrencies to find out.BTC/USDTBitcoin nudged above the overhead resistance at $24,668 on Aug. 11 but the bulls could not sustain the higher levels. This indicates that bears have not yet given up and are selling on rallies.BTC/USDT daily chart. Source: TradingViewThe price remains squeezed between the 20-day exponential moving average (EMA) ($23,151) and $24,668. Usually, a tight range trading is followed by a range expansion but it is difficult to predict the direction of the breakout with certainty.In this case, the 20-day EMA is gradually sloping up and the relative strength index (RSI) is in the positive territory, indicating the path of least resistance is to the upside.If buyers thrust and sustain the price above $25,000, the bullish momentum could pick up and the pair could rally to $28,000 and then to $32,000. This positive view could invalidate in the near term if the price turns down and breaks below the 20-day EMA. The pair could then decline to the 50-day simple moving average (SMA) ($21,845).ETH/USDTEther attempted to rise above $2,000 on Aug. 11 but the long wick on the day’s candlestick suggests that bears are defending the level with vigor.ETH/USDT daily chart. Source: TradingViewHowever, a positive sign is that the bulls have not ceded ground to the bears. This suggests that traders are not hurrying to book profits as they anticipate the up-move to continue.The upsloping moving averages and the RSI near the overbought territory indicate advantage to buyers. If bulls drive the price above $2,000, the ETH/USDT pair could rally to the downtrend line.Alternatively, if the price turns down sharply from the current level, the bears will try to sink the pair to the breakout level of $1,700. The bulls are expected to buy the dip to this support.BNB/USDTBNB has been facing stiff resistance at the overhead resistance zone between $338 to $350. Although bears have repeatedly thwarted attempts by the bulls to clear this hurdle, the buyers have not given up much ground. This indicates that the bulls are not rushing to the exit as they expect a move higher.BNB/USDT daily chart. Source: TradingViewA tight consolidation near the overhead resistance increases the likelihood of a break above it. If that happens, the BNB/USDT pair could attempt a rally to $380 and then to $414.The important support to watch out for on the downside is the 20-day EMA ($300). If bears sink the price below this level, the pair could decline to $275 and then to the 50-day SMA ($261). A break below this support could tilt the advantage in favor of the bears.XRP/USDTRipple (XRP) remains stuck between the overhead resistance at $0.39 and the 20-day EMA ($0.37). The bears attempted to resolve this uncertainty in their favor on Aug. 9 and 10 but the bulls purchased the dip and pushed the price back above the 20-day EMA. XRP/USDT daily chart. Source: TradingViewThe buyers tried to push the price above $0.39 on Aug. 11 but the bears held their ground. This indicates that $0.39 and the 50-day SMA ($0.35) are the critical levels to watch out for in the short term.If buyers clear the overhead hurdle, the XRP/USDT pair could rally to $0.48 and later to $0.54. On the contrary, if the price slips below the 50-day SMA, the pair could slide toward the crucial support at $0.30.ADA/USDT Buyers attempted to push Cardano (ADA) above the overhead resistance at $0.55 on Aug. 11 but the bears held the level successfully. The price could now drop to the 20-day EMA ($0.51).ADA/USDT daily chart. Source: TradingViewThe tight range trading between the 20-day EMA and $0.55 is unlikely to continue for long. If buyers drive the price above $0.55, the ADA/USDT pair could rally to $0.63 and then to the stiff overhead resistance at $0.70.Contrary to this assumption, if the price turns down and breaks below the 20-day EMA, the bears will attempt to challenge the support at $0.45. If the support holds, the pair may extend the consolidation between $0.45 and $0.55 for some more time.SOL/USDTSolana (SOL) bounced off the 50-day SMA ($39) on Aug. 10, indicating that bulls continue to buy at lower levels. The bulls attempted to push the price to the overhead resistance at $48 but the bears stalled the recovery at $45.32 on Aug. 11. SOL/USDT daily chart. Source: TradingViewThe SOL/USDT pair could continue to trade inside the ascending triangle formation for some more time. The bears will have to sink the price below the support line to invalidate this bullish setup.Alternatively, the bulls will have to push and sustain the price above $48 to complete the bullish pattern. If that happens, the pair could rally to $60 and then make a move to the pattern target at $71.DOGE/USDTDogecoin (DOGE) once again turned down from the overhead resistance at $0.08 on Aug. 11, indicating that bears continue to defend the level aggressively.DOGE/USDT daily chart. Source: TradingViewThe bears will attempt to sink the price below the moving averages and challenge the trendline of the ascending triangle pattern. A break and close below this support will invalidate the bullish setup, opening the doors for a possible retest of $0.06.Contrary to this assumption, if the price rebounds off the moving averages, it will suggest that bulls continue to buy at lower levels. The bulls will have to push the price above $0.08 to complete the ascending triangle pattern. If that happens, the DOGE/USDT pair may rally to $0.10.Related: 3 cryptocurrencies that stand to outperform ETH price thanks to Ethereum’s MergeDOT/USDTPolkadot (DOT) has been witnessing a close battle between the bulls and the bears near the breakout level of $9. The bears are attempting to pull the price back below $9 while the bulls are trying to flip the level into support.DOT/USDT daily chart. Source: TradingViewThe rising 20-day EMA ($8.47) and the RSI in the positive territory, indicating advantage to buyers. If the price rises from the current level and breaks above $9.65, the DOT/USDT pair could rally to $10.80 and later to $12.Alternatively, if the price breaks below the strong support zone of $9 and the 20-day EMA, it will suggest that the recent breakout may have been a bull trap. The pair could then decline to the 50-day SMA ($7.62).MATIC/USDTPolygon (MATIC) has been trading in a tight range between the 20-day EMA ($0.88) and $0.96 for the past few days, indicating indecision among buyers and sellers. MATIC/USDT daily chart. Source: TradingViewIf this uncertainty resolves to the upside, the MATIC/USDT pair could rally to the stiff overhead resistance at $1.02. The bulls will have to overcome this barrier to signal the start of the next leg of the up-move to $1.26 and later to $1.50.Contrary to this assumption, if the price turns down and breaks below the 20-day EMA, the short-term advantage could tilt in favor of the bears. The pair could then decline to the strong support at $0.75.AVAX/USDTAvalanche (AVAX) has been trading above the breakout level of $26.38 for the past few days which suggests that bulls are in no hurry to surrender their advantage.AVAX/USDT daily chart. Source: TradingViewThe gradually rising 20-day EMA ($25.6) and the RSI near the overbought zone indicate advantage to buyers. If bulls propel the price above $31, the AVAX/USDT pair could pick up momentum and rally to $33 and later to the pattern target of $39.05. This positive view could invalidate in the near term if the price turns down and breaks below the 20-day EMA. If that happens, the pair could decline to the 50-day SMA ($21.91) and then to the support line.The views and opinions expressed here are solely those of the author and do not necessarily reflect the views of Cointelegraph. Every investment and trading move involves risk. You should conduct your own research when making a decision.Market data is provided by HitBTC exchange.

Čítaj viac

Price analysis 8/10: BTC, ETH, BNB, XRP, ADA, SOL, DOGE, DOT, MATIC, AVAX

The Aug. 10 Consumer Price Index (CPI) report shows year-over-year inflation rose 8.5% in July and while this figure is below economists’ expectations of 8.7%, it is still high. Although inflation remains much higher than the Federal Reserve’s 2% target, the marginal slowdown raises hopes that the rate hikes by the Federal Reserve have started to work. That has reduced the probability of a 75 basis point rate hike in the September meeting from 68% on Aug. 9 to 37.5%, according to CME group data.Risky assets, including the cryptocurrency markets, responded positively to the CPI print. Compared to Bitcoin (BTC), the altcoins are enjoying a stronger rally. This has pulled Bitcoin’s dominance near its yearly lows while Ether (ETH) has climbed near its yearly high.Daily cryptocurrency market performance. Source: Coin360According to CoinShares data, Ether-related products have seen inflows of $159 million in the past seven weeks. This indicates that Ether seems to be garnering attention from institutional investors in anticipation of the Merge, which is scheduled for Sept. 19. Could Bitcoin and altcoins sustain the higher levels? Let’s study the charts of the top-10 cryptocurrencies to find out.BTC/USDTBitcoin turned down from $24,245 on Aug. 8 and dropped to the 20-day exponential moving average (EMA) ($22,966) on Aug. 9. The bulls aggressively purchased the dip on Aug. 10 and are attempting to push the price above the overhead resistance at $24,668.BTC/USDT daily chart. Source: TradingViewIf they succeed, the BTC/USDT pair could pick up momentum and rally to $28,000. The bears may mount a strong resistance at this level but if bulls overcome this barrier, the pair could rise to $32,000. The gradually upsloping 20-day EMA and the relative strength index (RSI) in the positive territory indicate the path of least resistance is to the upside.Conversely, if the price turns down from $24,668, the bears will again attempt to sink the pair below the 20-day EMA. If they manage to do that, the pair could decline to the 50-day simple moving average (SMA ($21,708). A break below this level could tilt the advantage in favor of the bears.ETH/USDTEther turned down from $1,818 on Aug. 8 but the bears could not sink the price below the 20-day EMA ($1,637). This suggests strong demand at lower levels.ETH/USDT daily chart. Source: TradingViewThe ETH/USDT pair rebounded off the 20-day EMA on Aug. 10 and has cleared the overhead hurdle at $1,818. If buyers sustain the price above this level, the pair could rally to the psychological level of $2,000 and then to $2,200. The rising moving averages and the RSI in the positive territory indicate that bulls have the upper hand.This bullish view will be invalidated if the price turns down and plummets below the 20-day EMA. If that happens, the pair may drop toward the 50-day SMA ($1,388). That could delay the start of the next leg of the up-move.BNB/USDTBNB turned down from the overhead resistance zone of $338 to $350 on Aug. 8 but the bears could not sustain the lower levels on Aug. 10. This suggests that bulls are aggressively buying the dips.BNB/USDT daily chart. Source: TradingViewThe bulls will again attempt to clear the overhead zone. If they succeed, the BNB/USDT pair could pick up momentum and rally toward $414. Although the rising moving averages indicate advantage to buyers, the overbought zone on the RSI indicates that a minor pullback or a consolidation is possible in the near term.If the price turns down from the overhead zone, the first support is at $308. The bears will have to sink the price below this level to challenge the 20-day EMA ($296). This is an important level to keep an eye on because a break and close below it could sink the pair to $275.XRP/USDTThe bulls failed to push XRP above the overhead resistance at $0.39 on Aug. 8. This attracted sharp selling by the bears who pulled the price below the 20-day EMA ($0.37) on Aug. 9.XRP/USDT daily chart. Source: TradingViewA minor positive is that the bulls bought the dip and have pushed the price back above the 20-day EMA on Aug. 10. The buyers will again attempt to push the price above the overhead resistance zone between $0.39 and $0.41. If they succeed, the XRP/USDT pair could rise to $0.48 and later to $0.54.Contrary to this assumption, if the price turns down from the overhead resistance and breaks below the 50-day SMA ($0.35), it will suggest that the pair may remain range-bound between $0.30 and $0.39 for a few more days.ADA/USDT Cardano (ADA) turned down from the overhead resistance at $0.55 on Aug. 8 and dropped to the 20-day EMA ($0.51) on Aug. 9, indicating that bears continue to defend the overhead resistance aggressively.ADA/USDT daily chart. Source: TradingViewThe ADA/USDT pair rebounded sharply off the 20-day EMA on Aug. 10, suggesting that the bulls are buying the dips with vigor. If buyers clear the overhead hurdle, the pair could start its northward march to $0.63 and then to $0.70. Contrary to this assumption, if the price once again turns down from $0.55, the likelihood of a break below the 20-day EMA increases. If that happens, the pair could remain range-bound between $0.45 and $0.55 for a few more days.SOL/USDTThe bulls tried to push Solana (SOL) to the overhead resistance at $48 on Aug. 8 but the bears had other plans. They stalled the recovery attempt at $44 and pulled the price back below the 20-day EMA ($40) on Aug. 9.SOL/USDT daily chart. Source: TradingViewBoth moving averages have flattened out and the RSI is just above the midpoint, indicating a balance between supply and demand. If the price rises from the current level and breaks above $44, the SOL/USDT pair could challenge the stiff resistance at $48. A break above this level will complete a bullish ascending triangle pattern, opening the doors for a possible rally to $60 and then to the pattern target at $71.Conversely, if the price turns down from the current level and breaks below the support line, the advantage could tilt in favor of the bears. The pair could then drop to $32.DOGE/USDTThe long wick on Dogecoin’s (DOGE) Aug. 9 candlestick shows that the bears are aggressively defending the overhead resistance at $0.08. The sellers are attempting to build upon their advantage by pulling the price below the moving averages.DOGE/USDT daily chart. Source: TradingViewIf they succeed, the DOGE/USDT pair could drop to the trendline of the ascending triangle pattern. A break and close below this support could invalidate the bullish setup. The pair could then decline to $0.06.Conversely, if the price turns up from the current level, it will suggest that bulls continue to buy on dips. The bulls will then make one more attempt to push the pair above the overhead resistance and start a new up-move. If they succeed, the pair could rally to $0.10.Related: TORN price sinks 45% after U.S. Treasury sanctions Tornado Cash — Rebound ahead?DOT/USDTPolkadot (DOT) broke and closed above the overhead resistance at $9 on Aug. 8 but the bulls could not build upon this strength. The bears sold aggressively and pulled the price back below $9 on Aug. 9.DOT/USDT daily chart. Source: TradingViewHowever, a positive sign is that the DOT/USDT pair rebounded sharply off the 20-day EMA ($8.30). This indicates that the sentiment has turned positive and traders are buying on dips. The bulls will attempt to push the price to $10.80 and later to $12.To invalidate this view, the bears will have to pull the price back below the 20-day EMA. Such a move will suggest that higher levels continue to attract strong selling by the bears. That could result in a range-bound action for a few days.MATIC/USDTThe bulls have successfully sustained Polygon (MATIC) above the 20-day EMA ($0.87) but have failed to challenge the overhead resistance at $1.02. This suggests a lack of demand at higher levels.MATIC/USDT daily chart. Source: TradingViewThe gradually rising 20-day EMA and the RSI in the positive territory, indicate that bulls have the upper hand. If buyers push the price above $0.95, the MATIC/USDT pair could rally to the overhead resistance at $1.02. This is an important level for the bears to defend because a break above it could result in a rally to $1.26 and then $1.50.Alternatively, if the price turns down from the current level and breaks below the 20-day EMA, it will suggest that the pair may oscillate between $0.75 and $1.02 for some more time.AVAX/USDTThe long wick on Avalanche’s (AVAX) Aug. 8 candlestick shows that bears have not given up and they continue to sell on rallies. The price slipped back to the breakout level on Aug. 9 but the bulls successfully defended the level on Aug. 10.AVAX/USDT daily chart. Source: TradingViewIf buyers sustain the rebound, the AVAX/USDT pair could break above the overhead resistance at $31. If that happens, the pair could resume its up-move to $33 and later to the pattern target of $39.05. The key level to watch on the downside is the 20-day EMA ($24.88). If bears sink the price below this support, it will suggest that the breakout above $26.38 may have been a bull trap. The pair could then decline to the support line.The views and opinions expressed here are solely those of the author and do not necessarily reflect the views of Cointelegraph. Every investment and trading move involves risk. You should conduct your own research when making a decision.Market data is provided by HitBTC exchange.

Čítaj viac

Získaj BONUS 8 € v Bitcoinoch

nakup bitcoin z karty

Registrácia Binance

Burza Binance

Aktuálne kurzy