Autor Cointelegraph By Rakesh Upadhyay

Price analysis 8/26: BTC, ETH, BNB, XRP, ADA, SOL, DOGE, DOT, SHIB, MATIC

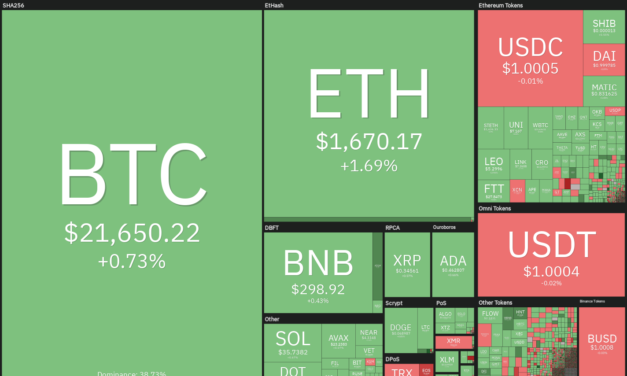
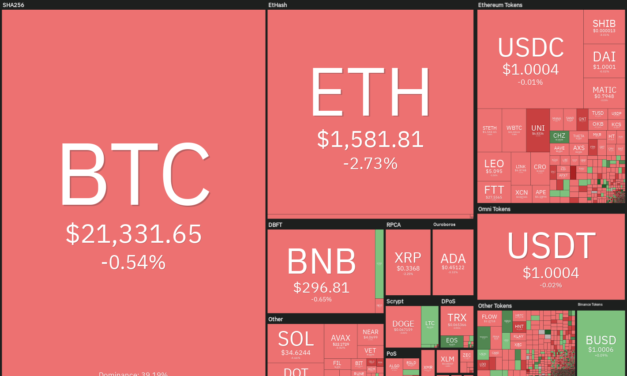
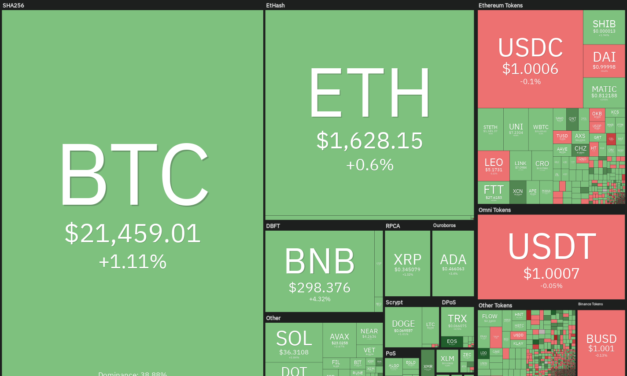
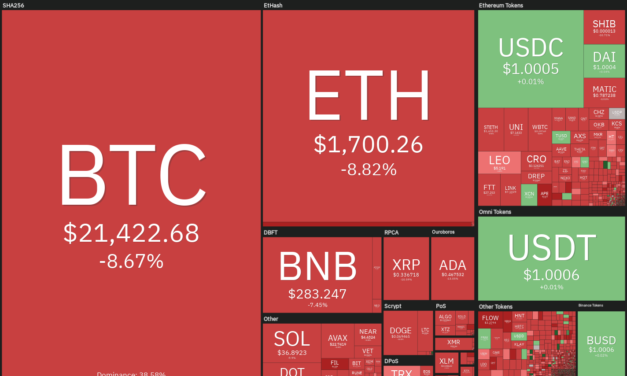
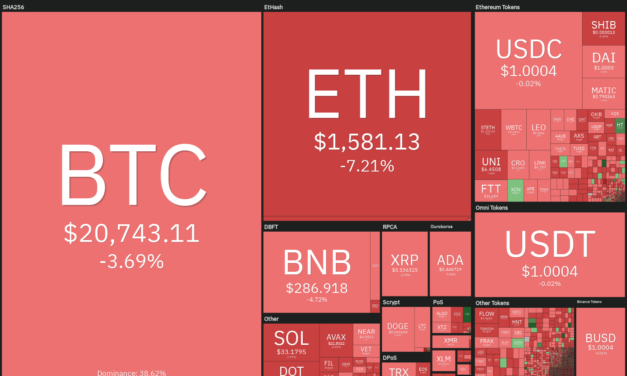
Federal Reserve Chairman Jerome Powell warned that the central bank will continue to use the “tools forcefully” to bring down inflation, which is close to its highest level in 40 years. He cautioned that the restrictive policy may remain for some time and warned that it could “bring some pain to households and businesses.”The United States equities markets reacted negatively to Powell’s comments with the Dow Jones Industrial Average dropping more than 600 points. The cryptocurrency markets also witnessed sharp selling with Bitcoin (BTC) and most altcoins threatening to break below their immediate support levels.Daily cryptocurrency market performance. Source: Coin360Along with a not-so-supportive macro environment, Bitcoin’s historical data for September also presents a negative picture. According to CoinGlass data, Bitcoin has witnessed an average decline of 6% in September and barring 2015 and 2016, the month has produced negative returns for investors between 2013 and 2021.Could Bitcoin and major altcoins remain weak in the near term? Let’s study the charts of the top-10 cryptocurrencies to find out.BTC/USDTBitcoin’s shallow rebound off the support line of the ascending channel indicated that bulls are cautious at higher levels. The downsloping 20-day exponential moving average (EMA) ($22,249) and the relative strength index (RSI) in the negative territory, indicate that bears have the upper hand.BTC/USDT daily chart. Source: TradingViewStrong selling has pulled the price below the ascending channel on Aug. 26. If bears sustain the price below $20,762, the selling could intensify and the BTC/USDT pair could drop to $18,900. This level may again act as a strong support but if it breaks, the decline could extend to the June 18 intraday low at $17,622.This negative view will be invalidated in the near term if the price turns up from the current level and breaks above the 50-day simple moving average (SMA) ($22,414). Such a move will indicate that lower levels continue to attract buyers. The pair could then attempt a rally to the resistance line of the channel.ETH/USDTBuyers could not push Ether (ETH) above the 20-day EMA ($1,697) on Aug. 25, indicating that bears are defending this level with vigor. ETH/USDT daily chart. Source: TradingViewThe selling picked up momentum and the bears have pulled the price below the 50-day SMA ($1,588). A close below this support could sink the ETH/USDT pair to $1,500. If the price slips below this crucial support, the pair will complete a bearish head and shoulders pattern. The target objective of this setup is $1,050.Contrary to this assumption, if the price rebounds off the $1,500 support, the bulls will again attempt to clear the overhead hurdle at $1,700. If they succeed, it will suggest that the pair could rise toward the overhead resistance at $2,000.BNB/USDTThe bulls pushed BNB above the 20-day EMA ($300) on Aug. 25 but the long wick on the candlestick suggests that bears are selling at higher levels.BNB/USDT daily chart. Source: TradingViewThe price has turned down on Aug. 26 and the bears are attempting to sink the price below the immediate support at $275. If they succeed, the BNB/USDT pair could complete a bearish head and shoulders pattern. That could result in a decline to $240 and then to the pattern target at $212.Conversely, if the price turns up and breaks above $308, it could catch the aggressive bears off guard. The pair could then rally to the overhead resistance of $338. If bulls clear this hurdle, the pair will complete a bullish inverse head and shoulders pattern.XRP/USDTThe bulls pushed Ripple (XRP) above the moving averages on Aug. 26 but the long wick on the candlestick suggests strong selling at higher levels. XRP/USDT daily chart. Source: TradingViewThe price turned down sharply and the bears are attempting to sink the XRP/USDT pair below the immediate support at $0.33. If they succeed, the next stop could be the critical support at $0.30. A break and close below this level could indicate the resumption of the downtrend.Alternatively, if the price rebounds off $0.30, it will suggest that bulls continue to buy at this level. That could increase the possibility that the pair may remain stuck between $0.30 and $0.39 for some more time.ADA/USDT Cardano’s (ADA) recovery turned down sharply from the 20-day EMA ($0.49) on Aug. 26, suggesting that the higher levels continue to attract strong selling by the bears.ADA/USDT daily chart. Source: TradingViewThe price could reach the immediate support at $0.43 and if that level also gives way, the next stop could be the crucial level at $0.40. The bulls successfully defended this support on two previous occasions, hence the level may again attract buying.If the price rebounds off the current level or $0.40, the bulls will again try to clear the overhead hurdle at the moving averages. If they manage to do that, the ADA/USDT pair could rally to the downtrend line where the bears may mount a strong defense.SOL/USDTSolana (SOL) has been gradually declining toward the strong support at $32, which suggests a lack of demand at higher levels.SOL/USDT daily chart. Source: TradingViewThe 20-day EMA ($38) is sloping down and the RSI is in the negative territory, indicating advantage to bears. If the $32 support collapses, the SOL/USDT pair could drop to the vital support at $26. This is an important level to keep an eye on because a break below it could signal the resumption of the downtrend.Contrary to this assumption, if the price rebounds off the support at $32, it will suggest that bulls are buying the dips to this level. The buyers will have to push the price above the 50-day SMA ($39) to indicate that the range-bound action between $32 and $48 may continue for a few more days.DOGE/USDTDogecoin (DOGE) marginally rose above the 20-day EMA ($0.07) on Aug. 25 but the bulls could not sustain the higher levels. This suggests that bears are defending the level aggressively.DOGE/USDT daily chart. Source: TradingViewStrong selling on Aug. 26 pulled the price below the trendline of the ascending triangle pattern. If the price sustains below the triangle, it will invalidate the bullish setup. The DOGE/USDT pair could then decline to $0.06 and later to $0.05.Alternatively, if the price rebounds off the current level, the buyers will again attempt to clear the overhead hurdle at the 20-day EMA. If they succeed, the pair could rally to $0.08 and thereafter to $0.09.Related: XRP price pumps and dumps amid mysterious $51M whale transfers — What’s next?DOT/USDTThe bulls could not push Polkadot (DOT) above the 50-day SMA ($7.82) in the past few days, indicating that bears continue to sell on minor rallies.DOT/USDT daily chart. Source: TradingViewThe downsloping 20-day EMA ($7.93) and the RSI in the negative territory indicate that bears have a slight edge. The negative momentum could pick up if bears sink the price below the strong support at $7. If that happens, the DOT/USDT pair could decline to the crucial support at $6.Alternatively, if the price turns up from the current level or $7 and rises above the moving averages, the pair could attempt a rally to $9.17 and then to the overhead resistance at $10.SHIB/USDTShiba Inu’s (SHIB) volatility picked up and the bulls pushed the price above the overhead resistance at $0.000014 on 25 August. However, the long wick on the day’s candlestick suggests that bears continue to sell on rallies.SHIB/USDT daily chart. Source: TradingViewThe sellers are currently attempting to sustain the price below the 20-day EMA ($0.000013). If they succeed, the SHIB/USDT pair could drop to the next support at $0.000012. This is an important level for the bulls to defend because if it cracks, the decline could extend to $0.000010.To invalidate this negative view, the buyers will have to push and sustain the price above $0.000014. If they manage to do that, the pair could rally to the stiff overhead resistance at $0.000018.MATIC/USDTPolygon’s (MATIC) rebound off the strong support at $0.75 is facing resistance near the 20-day EMA ($0.85). This suggests that the sentiment remains negative and bears are selling on rallies.MATIC/USDT daily chart. Source: TradingViewThe sellers will make an attempt to sink the price below the strong support at $0.75. If they succeed, the MATIC/USDT pair could decline to $0.63. The bulls may mount a strong defense at this level but if the support cracks, the next stop could be $0.52.This negative view could be invalidated in the near term if the price turns up from the current level and breaks above the 20-day EMA. If that happens, the pair could attempt a rally to the stiff overhead resistance of $1.05.The views and opinions expressed here are solely those of the author and do not necessarily reflect the views of Cointelegraph. Every investment and trading move involves risk. You should conduct your own research when making a decision.Market data is provided by HitBTC exchange.

Čítaj viac

Price analysis 8/24: BTC, ETH, BNB, XRP, ADA, SOL, DOGE, DOT, SHIB, MATIC

Bitcoin (BTC) and several major cryptocurrencies have been trading sideways as traders avoid taking large bets before the United States Federal Reserve’s Jackson Hole Economic Symposium, which begins on Aug. 25. The volatility is likely to soar as investors get some clarity on the Fed’s stance in the next few days.On Aug. 23, a team led by Goldman Sachs chief economist Jan Hatzius said that Fed chair Jerome Powell could sound dovish when he speaks on Aug. 26, reiterating that the central bank may move at a slower pace in future meetings. The analysts expect the Fed to raise rates by 50 basis points in the September meeting, which would be less than the 75 bps hike done in June and July.Daily cryptocurrency market performance. Source: Coin360Although the short-term price action remains uncertain, on-chain data suggests that Bitcoin may be undervalued, meaning it could provide strong returns if history repeats itself. According to Jarvis Labs resident analyst JJ, Bitcoin’s Market Capitalization versus Realized Capitalization indicator reading is at its lowest level since 2015. Bitcoin’s bottom in 2015 and 2019 formed when the indicator reached a low reading, but that has reached extremely low levels in 2022.What are the critical levels to watch on the upside and the downside? Let’s study the charts of the top-10 cryptocurrencies to find out.BTC/USDTBitcoin has been trading near the support line of the ascending channel since Aug. 19. Although the bulls have defended the support successfully, they have failed to achieve a strong rebound off it. This indicates that demand dries up at higher levels.BTC/USDT daily chart. Source: TradingViewThe 20-day exponential moving average (EMA) ($22,523) has started to turn down and the relative strength index (RSI) is near 41, indicating that bears have a slight edge. If the price breaks below the support line of the channel, the selling could intensify and the BTC/USDT pair could drop to $18,900. To invalidate this negative view, the bulls will have to push and sustain the price above the moving averages. If they do that, it will suggest that the pair could gradually climb to the resistance line of the channel near $26,000.ETH/USDTThe bulls are aggressively defending the 50-day simple moving average (SMA) ($1,571), as seen from the long tail on the Aug. 22 and 23 candlestick. Ether (ETH) will now attempt to rise above the 20-day EMA ($1,712).ETH/USDT daily chart. Source: TradingViewIf that happens, the ETH/USDT pair could pick up momentum and rise toward the stiff overhead resistance near $2,000. The bears are expected to defend this level aggressively.Contrary to this assumption, if the price turns down from the overhead resistance, it will suggest that bears are attempting to flip the 20-day EMA into resistance. The pair could then remain stuck between the moving averages for a few more days. If the price breaks below the 50-day SMA and the $1,500 support, the selling could pick up momentum and the pair may plummet toward the strong support at $1,280.A tight squeeze is usually followed by an expansion in volatility but it is difficult to preempt the direction of the breakout with certainty. Therefore, it is better to wait for the breakout to happen before initiating fresh positions.BNB/USDTBNB’ rebound off the $275 level has been facing stiff resistance at the 20-day EMA ($301). A minor positive is that the bulls have not given up much ground as they expect the up-move to continue.BNB/USDT daily chart. Source: TradingViewIf the price turns up from the current level and breaks above $305, the BNB/USDT pair could rise toward the overhead resistance at $338. Such a move will form an inverse head and shoulders pattern, which will complete on a break and close above $338. If that happens, the pair could rally to $420 and then to $460. The pattern target of this bullish setup is $493.Alternatively, if the price turns down sharply from the current level, the pair could drop to $275. A break below this level will complete a head and shoulders pattern. The pair could then decline to $240 and later to $212.XRP/USDTRipple (XRP) has been trading in a tight range between $0.33 and $0.35 for the past four days. This suggests indecision among the bulls and the bears.XRP/USDT daily chart. Source: TradingViewIf the price turns down and breaks below $0.33, the advantage could tilt in favor of the sellers. The XRP/USDT pair could then decline to the crucial level at $0.30. The bulls are likely to defend this level aggressively. A strong rebound off this level will suggest that the pair may remain range-bound between $0.30 and $0.39 for some more time.On the other hand, if the price breaks above $0.35 and the moving averages, it will suggest that bulls are attempting to form a floor at $0.33. The pair could then rise to $0.39, which is an important level to keep an eye on. If bulls clear this hurdle, the pair could rally to $0.48.ADA/USDT Cardano (ADA) has been trading between $0.43 and $0.47 for the past four days. Although the bulls bought the dip to $0.43 with vigor, they have not been able to clear the overhead hurdle at $0.47.ADA/USDT daily chart. Source: TradingViewThe price action formed an inside-day candlestick pattern on Aug. 24, indicating indecision among buyers and sellers. If bulls thrust the price above $0.47, the ADA/USDT pair could rise to the moving averages. A break and close above this resistance could open the doors for a possible rally to the downtrend line.Conversely, if the price turns down and breaks below $0.43, the pair could slide to the strong support at $0.40. This is an important level to watch out for because if it cracks, the pair could resume its downtrend.SOL/USDTSolana (SOL) is struggling to start a recovery as bears are posing a strong challenge near $37. The bears may now attempt to pull the price to the strong support at $32.SOL/USDT daily chart. Source: TradingViewThe bulls have successfully defended the $32 support on two previous occasions; hence, the level may again attract buyers. If the price rebounds off $32, the bulls will again try to push the SOL/USDT pair above the moving averages. If they succeed, the pair could rally to the overhead resistance at $48. The buyers will have to propel the price above this level to signal a potential trend change.On the contrary, if the price turns down and breaks below $32, it will suggest that bears are in control. The pair could then drop to the crucial support at $26.DOGE/USDTDogecoin (DOGE) slipped below the trendline on Aug. 22 but the bulls purchased the drop as seen from the long tail on the day’s candlestick. However, a negative sign is that the bulls failed to clear the overhead resistance at the 50-day SMA ($0.07). DOGE/USDT daily chart. Source: TradingViewThe bears will once again attempt to sink the price below the trendline. If they succeed, the DOGE/USDT pair could decline to $0.06. If this support also cracks, the next stop could be the crucial level of $0.05.Contrary to this assumption, if the price turns up from the current level and rises above the 20-day EMA ($0.07), it will suggest strong demand at lower levels. The pair could then rise to the overhead resistance at $0.08 and later to $0.09.Related: 3 reasons why Chiliz is up 35% this week — and where is CHZ price heading next?DOT/USDTPolkadot (DOT) has been attempting to climb above the 50-day SMA ($7.81) but the bears have held their ground. The long tail on the Aug. 22 and 23 candlestick shows strong buying at lower levels.DOT/USDT daily chart. Source: TradingViewThe bulls will have to push the price above the 50-day SMA and the 20-day EMA ($8.07) to clear the path for a possible rally to $9.17 and then $10. This is an important level to keep an eye on because a break and close above it could signal that the DOT/USDT pair may have bottomed out. The pair could then rise to the overhead resistance at $12.44.On the contrary, if the price turns down from the moving averages, it will suggest that bears are active at higher levels. The sellers will then attempt to sink the pair below $7. If they manage to do that, the pair could slide to $6.SHIB/USDTShiba Inu (SHIB) continues to trade near the 20-day EMA ($0.000013) for the past few days, which suggests a state of indecision among the bulls and the bears.SHIB/USDT daily chart. Source: TradingViewThe flattening 20-day EMA and the RSI near the midpoint suggest that the SHIB/USDT pair could remain range-bound for the next few days. If the price sustains below the 20-day EMA, the pair could slide to $0.000012. This is an important support for the bulls to defend because a break below it could open the doors for a fall to $0.000010.Alternatively, if the price turns up and breaks above $0.000014, the pair could start its northward journey toward $0.000018. The bulls will have to overcome this barrier to signal the start of a new uptrend.MATIC/USDTPolygon (MATIC) has been rising along the 50-day SMA ($0.82) for the past four days as bulls are buying the dips. The bears will attempt to stall the recovery at the 20-day EMA ($0.86).MATIC/USDT daily chart. Source: TradingViewIf the price turns down from the 20-day EMA, the bears will make one more attempt to sink the MATIC/USDT pair below the critical level at $0.75. If that happens, the pair could slide to the next major support at $0.63.Alternatively, if the support at $0.75 holds, the pair will attempt to climb above the 20-day EMA and rally to the overhead resistance at $1.05. The bulls will have to overcome this barrier to indicate the resumption of the uptrend.The views and opinions expressed here are solely those of the author and do not necessarily reflect the views of Cointelegraph. Every investment and trading move involves risk. You should conduct your own research when making a decision.Market data is provided by HitBTC exchange.

Čítaj viac

Cryptocurrencies react to Jackson Hole, Fed rate hike plans and a weakening bear market rally

The European stock markets and the United States equities markets are both deep in the red on Aug. 22 as investors fear that aggressive rate hikes may not be off the table. Another thing keeping investors nervous could be the upcoming  Jackson Hole economic symposium, which is scheduled to begin on Aug. 25. Investors are concerned that Federal Reserve chairman Jerome Powell could further elaborate on the Fed’s hawkish stance and plans for future interest rate hikes.This macro uncertainty has kept the institutional investors away from the crypto markets. CoinShares data showed that crypto investment products recorded weekly volumes of $1 billion, which is 55% lower than the yearly average.Daily cryptocurrency market performance. Source: Coin360On-chain analytics resource Material Indicators said that Bitcoin (BTC) has not broken below the July lows. This suggests that the bear market rally is not yet over. However, buyers will have to push the price above the 200-week moving average of near $23,000 to gain the upper hand.Could Bitcoin and most major altcoins make a strong comeback in the next few days and what are the critical levels to watch out for? Let’s study the charts of the top-10 cryptocurrencies to find out.BTC/USDTThe buyers defended the support line of the ascending channel on Aug. 19 and started a bounce but the recovery stalled at $21,800. This suggests that bears are posing a strong challenge near the moving averages. BTC/USDT daily chart. Source: TradingViewA minor positive is that the long tail on the Aug. 22 candlestick shows that bulls are attempting to defend the support line with vigor. If bulls push the price above $21,800, the BTC/USDT pair could rise to the 20-day exponential moving average (EMA) ($22,725).If the price turns down from this resistance, it will suggest that the sentiment has turned negative and traders are selling on rallies. That could increase the possibility of a break below the channel. If that happens, the selling momentum could pick up and the pair could plummet toward the June 18 low at $17,622.Conversely, if buyers thrust the price above the 20-day EMA, it will suggest that the pair may extend its stay inside the channel for a few more days. The bulls will then try to push the price toward the resistance line of the channel.ETH/USDTEther (ETH) plunged below the 20-day EMA ($1,718) and the breakout level of $1,700 on Aug. 19, which suggests that traders who had purchased at lower levels were exiting their positions. ETH/USDT daily chart. Source: TradingViewThe bulls attempted to stall the decline at the 50-day simple moving average (SMA)($1,549) but the weak bounce off it suggests a lack of aggressive buying at the level. This increases the likelihood of a break below the support.If that happens and the ETH/USDT pair breaks below $1,500, the selling could intensify as the bulls may wait for the price to reach the next strong support before buying again. The pair could therefore decline to $1,280.Conversely, if the price bounces off the current level and rises above the 20-day EMA, traders who did not buy at the 50-day SMA may buy aggressively lest they miss out on the up-move. That could push the price toward $2,000.BNB/USDTBinance Coin’s (BNB) bounce off the strong support at $275 is facing stiff resistance at the 20-day EMA ($301) but a minor positive is that the bulls have not ceded ground to the sellers. This indicates that buyers expect the recovery to continue further.BNB/USDT daily chart. Source: TradingViewIf the price rises above the 20-day EMA, the BNB/USDT pair could rally to the overhead resistance at $338. This is an important level to keep an eye on because a break and close above it will complete the bullish inverse head and shoulders pattern. This setup has a pattern target of $493.It may not be a straight dash to the target objective as bears may attempt to stall the rally at $420 and then again at $460.Conversely, if the price turns down from the current level and breaks below $275, the pair will complete a short-term head and shoulders pattern. That could start a decline toward the pattern target of $212.It is better to wait for either pattern to complete before establishing a position because the setups tend to break down more often than not.XRP/USDTRipple (XRP) remains stuck inside the range between $0.30 and $0.39. The bulls are attempting to defend the support at $0.33 but are facing stiff resistance at higher levels.XRP/USDT daily chart. Source: TradingViewIf the price turns down and breaks below $0.33, the likelihood of a drop to $0.30 increases. This level has previously acted as strong support; hence, traders may buy the dip, expecting a rally back to $0.39.Another possibility is that the price bounces off $0.33 and breaks above the moving averages. If that happens, the XRP/USDT pair may rally to the stiff overhead resistance at $0.39. It is difficult to predict the direction of the breakout from a range. Therefore, traders may wait for the break to happen before establishing fresh positions.ADA/USDT Cardano (ADA) slipped below the 50-day SMA ($0.49) on Aug. 19, indicating that bears have the upper hand. Buyers tried to start a relief rally on Aug. 20 but the weak bounce shows a lack of demand at higher levels.ADA/USDT daily chart. Source: TradingViewThe bears will now try to sink the price to the strong support at $0.40. This is an important level to keep an eye on because the bulls have defended the level successfully since May 12. A break and close below this support could signal the start of the next leg of the downtrend.Conversely, if the price rebounds off $0.40, the buyers will attempt to push the ADA/USDT pair above the moving averages. If they manage to do that, the pair could rally to the downtrend line. SOL/USDTSolana (SOL) broke below the moving averages on Aug. 19, indicating that bears have the upper hand in the near term. The sellers will try to sink the price to the immediate support at $32. SOL/USDT daily chart. Source: TradingViewIf the price rebounds off $32, the bulls will attempt to push the SOL/USDT pair above the moving averages. If they succeed, it will suggest that the pair may rise toward the overhead resistance at $48.Contrary to this assumption, if the price slips below $32, the pair could slide to the crucial support at $26. The bulls are expected to defend this level with all their might because the failure to do so may signal the resumption of the downtrend.DOGE/USDTDogecoin (DOGE) bounced off the trendline on Aug. 20 but the bulls could not clear the overhead hurdle at the 20-day EMA ($0.07). This indicates that bears do not want to surrender their advantage and are selling on minor rallies.DOGE/USDT daily chart. Source: TradingViewThe DOGE/USDT pair formed a Doji candlestick pattern on Aug. 21, which resolved to the downside on Aug. 22 and the price slipped below the trendline. If the price sustains below the trendline, the pair could further decline to $0.06. This is an important level for the bulls to defend because a break below it could result in a drop to the crucial support at $0.05.To invalidate this bearish view, the bulls will have to push and sustain the price above the 20-day EMA. If that happens, it will suggest that bulls aggressively purchased the drop below the trendline. That could open the doors for a possible rally to the overhead resistance at $0.08.Related: BTC to lose $21K despite miners’ capitulation exit? 5 things to know in Bitcoin this weekDOT/USDTPolkadot (DOT) broke below the 50-day SMA ($7.78) on Aug. 19, indicating a lack of buying support from the bulls. The bears will now attempt to sink the price to the strong support at $6.DOT/USDT daily chart. Source: TradingViewWhen the price is trading inside a large range, traders generally buy the rebound off the support by keeping a tight stop-loss. This improves the risk-to-reward ratio. Therefore, the likelihood of a bounce off the $6 support is high. If that happens, the DOT/USDT pair may remain range-bound between $6 and $10 for some more time. The next trending move could start on a break below $6 or on a break above $10. If the support at $6 gives way, the pair may start the next leg of the downtrend.SHIB/USDTShiba Inu (SHIB) is witnessing a tussle near the 20-day EMA ($0.000013) with both the bulls and the bears vying for supremacy. The buyers are attempting to push the price above the overhead resistance at $0.000014 but the bears have held their ground.SHIB/USDT daily chart. Source: TradingViewThe 20-day EMA has flattened out and the relative strength index (RSI) is near the midpoint, indicating a balance between supply and demand. This balance could tilt in favor of the bulls if the price rises above $0.000014. If that happens, the SHIB/USDT pair could rise to the stiff overhead resistance at $0.000018.Conversely, if the price breaks below $0.000012, the pair could tilt in favor of the sellers. The pair could then drop to the next strong support at $0.000010.MATIC/USDTPolygon (MATIC) has been consolidating in a large range between $0.75 and $1 for the past few days. The bulls purchased the dip to the support of the range but the rebound is facing stiff resistance from the bears at higher levels.MATIC/USDT daily chart. Source: TradingViewIf bulls push the price above the 20-day EMA ($0.86), the MATIC/USDT pair could attempt a rally to the overhead resistance at $1 where the bears are likely to mount a strong defense. If the price turns down from this resistance, the pair could extend its stay inside the range for some more time.Contrary to this assumption, if the price turns down from the current level and breaks below $0.75, it will suggest that bears are back in command. The pair could then decline to the next support at $0.63.The views and opinions expressed here are solely those of the author and do not necessarily reflect the views of Cointelegraph. Every investment and trading move involves risk. You should conduct your own research when making a decision.Market data is provided by HitBTC exchange.

Čítaj viac

Here’s 5 cryptocurrencies with bullish setups that are on the verge of a breakout

The S&P 500 ended its four-week-long recovery last week after minutes from the Federal Reserve’s July meeting hinted that the central bank’s rate hikes will continue until inflation is under control. Members of the Fed said there was no evidence that inflation pressures appear be easing.Another dampener was the statement by St. Louis Fed president James Bullard who said that he would support a 75 basis point rate hike in September’s Fed policy meeting. This reduced hopes that the era of aggressive rate hikes may be over. Crypto market data daily view. Source: Coin360Weakening sentiment pulled the S&P 500 lower by 1.29% for the week. Continuing its close correlation with the S&P 500, Bitcoin (BTC) also witnessed a sharp decline on Aug. 19 and is likely to end the week with steep losses. Will bulls use the dips to accumulate at lower levels? If they do, let’s study the charts of the top-5 cryptocurrencies that may attract buyers because of their bullish setups. BTC/USDTBitcoin slipped below the 20-day exponential moving average ($22,864) on Aug. 17 and then below the 50-day simple moving average ($22,318) on Aug. 19. The bulls are attempting to arrest the decline at the support line of the ascending channel. BTC/USDT daily chart. Source: TradingViewThe 20-day EMA has started to turn down and the relative strength index (RSI) is in negative territory, indicating advantage to bears. If the price reverses direction from the moving averages, it will suggest that bears are selling on rallies. That could increase the possibility of a break below the support line of the channel. If that happens, the crucial support zone of $18,626 to $17,622 may come under attack. To avoid this situation, the bulls will have to push and sustain the price above the moving averages. If they do that, the BNB/USDT pair could rise toward the resistance line of the channel.BTC/USDT 4-hour chart. Source: TradingViewThe buyers are aggressively defending the support line of the channel but the downsloping moving averages and the RSI in the negative territory suggest that higher levels are likely to attract selling by the bears.If the price turns down from the current level or the 20-EMA, the likelihood of a break below the channel increases. If that happens, the bearish momentum could pick up and the pair could drop toward $18,626.The first sign of strength will be a break above the 20-EMA. Such a move will indicate that the selling pressure may be reducing. That could improve the prospects of a rally to the 50-SMA.BNB/USDTBinance Coin (BNB) turned down from the overhead resistance at $338 but the bulls successfully defended the strong support at $275. This indicates a positive sentiment as the bulls are viewing the dips as a buying opportunity.BNB/USDT daily chart. Source: TradingViewThe recovery may face resistance at the 20-day EMA ($301). If the price turns down from this level, the bears will again try to sink the BNB/USDT pair below $275. If that happens, it will suggest that the pair may oscillate in a large range between $183 and $338 for some time.On the contrary, if bulls push the price above the 20-day EMA, the pair could rise to $338. A break and close above this level could complete a bullish head and shoulders pattern. That could start a rally to $413 and then to the pattern target at $493.BNB/USDT 4-hour chart. Source: TradingViewThe 20-EMA on the 4-hour chart has started to turn up and the RSI is near the midpoint, indicating that the selling pressure may be reducing. If the price sustains above the 20-EMA, the pair could rise to the 50-SMA. A break and close above this resistance could increase the possibility of a rally to $338.Conversely, if the price turns down and breaks below the 20-EMA, the pair could again drop to the critical support at $275. If this level cracks, the pair will complete a bearish heads and shoulders pattern and drop toward $240.EOS/USDTEOS has formed the bullish inverse head and shoulders setup. The buyers pushed the price above the overhead resistance at $1.46 on Aug. 17 but the long wick on the day’s candlestick shows strong selling at higher levels.EOS/USDT daily chart. Source: TradingViewThe bears pulled the price back below the breakout level of $1.46 on Aug. 19 but the positive sign is that the buyers did not allow the EOS/USDT pair to sustain below the 20-day EMA ($1.32). This indicates that lower levels are attracting buyers.If bulls sustain the price above $1.46, the positive momentum could pick up and the pair may rally to $1.83. If this resistance is also scaled, the rally could extend to the pattern target of $2.11.This positive view could invalidate if the price turns down and breaks below $1.24. The pair could then decline to the 50-day SMA ($1.17).EOS/USDT 4-hour chart. Source: TradingViewThe rally above $1.46 on Aug. 17 pushed the RSI on the 4-hour chart to deeply overbought levels. This may have tempted short-term buyers to book profits, which pulled the price to the strong support at $1.24. The bulls purchased the dip to this level and have again propelled the pair above the overhead hurdle at $1.46. The pair could now rally to $1.56 and then to the important resistance at $1.83. Alternatively, if the price turns down from the current level and breaks below the moving averages, it will suggest that the pair could remain range-bound for a few days. Related: 3 reasons why the Bitcoin price bottom is not inQNT/USDTThe series of higher highs and higher lows suggest that Quant (QNT) is in a short-term uptrend. The bulls purchased the drop to the 50-day SMA ($100) and are attempting to resume the up-move.QNT/USDT daily chart. Source: TradingViewIf the price sustains above the 20-day EMA ($111), it will suggest that the correction may be over. The QNT/USDT pair could first rise to $124 and then retest the important resistance at $133. If bulls clear this hurdle, the pair could rally to the overhead resistance zone between $154 and $162.Contrary to this assumption, if the price fails to sustain above the 20-day EMA, it will indicate that traders may be closing their positions on rallies. The bears will have to sink the price below $98 to gain the upper hand and signal the start of a deeper correction to $79.QNT/USDT 4-hour chart. Source: TradingViewThe pair has been correcting inside a falling wedge pattern. The buyers pushed the price above the resistance line of the pattern but could not sustain the breakout. This suggests that bears are active at higher levels.If the price sustains below the 50-SMA, the pair could slide to the 20-EMA. This is an important level to watch out for. If the price rebounds off this level, it will suggest that the short-term trend has turned in favor of the buyers.A break and close above $118 could indicate that the corrective phase may be over. Conversely, if the price slips below the 20-EMA, the pair may drop to $100.CHZ/USDTChiliz (CHZ) soared to $0.23 on Aug. 18 which pushed the RSI deep into the overbought territory. This may have tempted short-term traders to book profits and that pulled the price back below the breakout level of $0.20.CHZ/USDT daily chart. Source: TradingViewA minor positive is that the bulls are attempting to defend the 20-day EMA ($0.17) and push the price back above $0.20. If they succeed, it will suggest that the sentiment remains positive and traders are buying on dips. That increases the likelihood of a retest of $0.23. If bulls clear this hurdle, the CHZ/USDT pair could pick up momentum and rally to $0.26. Contrary to this assumption, if the price fails to rise above $0.20, it will suggest that bears are selling on rallies. The bears will be back in the driver’s seat if they sink the pair below the 20-day EMA. The pair could then decline to the 50-day SMA ($0.13).CHZ/USDT 4-hour chart. Source: TradingViewThe bulls are trying to defend the uptrend line but the recovery is facing strong resistance at the moving averages. The moving averages completed a bearish crossover on the 4-hour chart and the RSI is in the negative territory, indicating a minor advantage to sellers.If the price turns down and breaks below the uptrend line, the selling could intensify and the pair may drop to $0.16 and then to $0.14. Such a move will indicate that the bears remain in control.Instead, if the price breaks above the moving averages, the bulls will try to push the pair to $0.21 and later challenge the resistance at $0.23. The views and opinions expressed here are solely those of the author and do not necessarily reflect the views of Cointelegraph. Every investment and trading move involves risk, you should conduct your own research when making a decision.

Čítaj viac

Price analysis 8/19: BTC, ETH, BNB, XRP, ADA, SOL, DOGE, DOT, SHIB, AVAX

Bitcoin (BTC) and most major altcoins witnessed a sharp sell-off on Aug. 19, but there does not seem to be a specific trigger for the sudden drop. The sharp fall resulted in liquidations of more than $551 million in the past 24 hours, according to data from Coinglass.Barring a V-shaped bottom, other formations generally take time to complete as buyers and sellers try to gain the upper hand. This tends to cause several random volatile moves that may be an opportunity for short-term traders, but long-term investors should avoid getting sucked into the noise.Daily cryptocurrency market performance. Source: Coin360Glassnode data shows that investors who purchased Bitcoin in 2017 or earlier are just doing that by holding their positions. The percentage of Bitcoin supply dormant for at least five years hit a new all-time high of 24.351% on Aug. 18, suggesting that holders are not willing to sell in panic or for minor gains. Could Bitcoin and most altcoins challenge their June lows or will the bulls buy the current dip? Let’s study the charts of the top-10 cryptocurrencies to find out.BTC/USDTBitcoin’s major trend is down but the bulls are attempting to form a bottom. The price has been rising inside an ascending channel for the past few days. The failure of the bulls to push the price above the resistance line of the channel may have tempted short-term traders to book profits. That has pulled the price below the moving averages.BTC/USDT daily chart. Source: TradingViewThe BTC/USDT pair decline to the support line of the channel and when the price trades inside an ascending channel, traders usually attempt to buy the dips to the support line and sell near the resistance line.Therefore, the likelihood of a bounce off the support line is high. If that happens, the buyers will try to push the pair above the moving averages. A break and close above the 20-day exponential moving average (EMA) ($23,265) could open the doors for a possible rally to the resistance line.This positive view could invalidate if the price breaks and sustains below the channel. Such a move could open the doors for a possible drop to $18,626.ETH/USDTEther (ETH) dipped below the 20-day EMA ($1,771) on Aug. 19 which is the first sign that the recovery may be losing steam. The important level to watch on the downside is $1,700 as it had acted as a strong support between Aug. 6 to Aug. 10.ETH/USDT daily chart. Source: TradingViewIf the price rebounds off $1,700 with strength, it will suggest that bulls are attempting to flip this level into support. The ETH/USDT pair could then rise to $1,960 and later to $2,030. A break above this level could indicate the resumption of the uptrend. The pair could then rally to the downtrend line.Contrary to this assumption, if the price breaks and sustains below $1,700, it will suggest that traders who may have purchased at lower levels are aggressively closing their positions. That could pull the pair to the 50-day simple moving average ($1,519).BNB/USDTBinance Coin (BNB) plummeted below the 20-day EMA ($304) on Aug. 17, indicating that the short-term traders may be booking profits. The decline continued further and the price slipped to the 50-day SMA ($272) on Aug. 19. This is an important level for the bulls to defend if they want to keep the recovery intact.BNB/USDT daily chart. Source: TradingViewIf the price turns up from the current level and rises above the 20-day EMA, the BNB/USDT pair could rise toward the overhead resistance at $338. That could form an inverse head and shoulders pattern, which will complete on a break and close above $338.Conversely, if the price breaks below the 50-day SMA, the pair could slide to $240. Such a move will suggest that the pair may remain stuck inside a large range between $183 and $338 for some time.XRP/USDTThe bulls failed to push XRP above the overhead resistance at $0.39 on Aug. 17, which suggests that bears continue to defend the level with vigor. XRP/USDT daily chart. Source: TradingViewUsually, in a range, traders buy near the support and sell close to the resistance and that is what happened with the XRP/USDT pair. The bulls may now wait for the price to drop near the support at $0.30 before buying. If the price rebounds off $0.30, it will indicate that the range-bound action may continue for a few more days.The next directional move could start after buyers drive the price above $0.39 or bears sink the pair below $0.30. The price action inside a range is usually random and volatile. Hence, experienced traders generally wait for the breakout to happen before entering a position.ADA/USDT Cardano (ADA) broke below the 20-day EMA ($0.52) on Aug. 18, indicating that the bulls may have been hurrying to close their positions. This gave the bears a slight edge.ADA/USDT daily chart. Source: TradingViewThe sellers pressed on with their advantage on Aug. 19 and pulled the price below the 50-day SMA ($0.49). This increases the possibility that the ADA/USDT pair could decline to the crucial support at $0.40. The bulls have defended this level on two previous occasions, hence the odds favor a bounce off it. If that happens, the pair could oscillate between $0.40 and $0.60 for some time. The bears will have to sink the pair below $0.40 to start the next leg of the downtrend.SOL/USDTSolana (SOL) bounced off the support line on Aug. 18 and the bulls tried to push the price above the 20-day EMA ($41). However, the bears defended the level successfully.SOL/USDT daily chart. Source: TradingViewThis exacerbated the selling on Aug. 19 and pulled the price below the 50-day SMA ($39). This invalidated the bullish ascending triangle pattern. The bears will now attempt to sink the SOL/USDT pair to $34.50.If the price rebounds off $34.50, the pair could attempt a rally above the moving averages. If that happens, the pair could consolidate between $34.50 and $48 for some time. Conversely, a break below $34.50 could sink the pair to $31.DOGE/USDTDogecoin (DOGE) turned down and broke below the breakout level of $0.08 on Aug. 18. This was the first indication that the break above $0.08 on Aug. 14 may have been a dead cat bounce.DOGE/USDT daily chart. Source: TradingViewThe bears continued their selling and have pulled the price to the trendline of the ascending triangle pattern. A break below this level could invalidate the bullish setup and open the doors for a possible drop to $0.06. This level is likely to attract strong buying by the bulls.Alternatively, if the price rebounds off the current level, it will suggest that the bulls are attempting to defend the trendline. The buyers will have to push the DOGE/USDT pair back above $0.09 to gain the upper hand.Related: Nearly $55M worth of Bored Ape, CryptoPunks NFTs risk liquidation amid debt crisisDOT/USDTPolkadot (DOT) closed below the 20-day EMA ($8.46) on Aug. 17 which was the first indication that the break above $9 may have been a sucker’s rally. Sellers took advantage of the situation and pulled the price below the 50-day SMA ($7.75) on Aug. 19.DOT/USDT daily chart. Source: TradingViewThis opens the doors for a possible drop to the crucial support at $6. This level acted as a strong support on two previous occasions, hence the bulls will again try to defend the level with all their might.If the price rebounds off $6, the DOT/USDT pair could continue to trade inside a large range for a few days. The next strong move could start after bulls push the price above $10 or bears sink the pair below $6.SHIB/USDTIn a downtrend, strong rallies usually end up as bull traps and that is what happened with Shiba Inu (SHIB). The buyers could not sustain the price above $0.000017 on Aug. 17 and build upon the momentum. That may have resulted in profit-booking by the short-term traders.SHIB/USDT daily chart. Source: TradingViewThe bulls tried to resume the up-move on Aug. 16 but the bears held their ground. That aggravated the selling pressure and the bears pulled the price below $0.000014 on Aug. 18. The bears will try to solidify their position by sinking the price below the 50-day SMA ($0.000012).To invalidate this bearish view, the bulls will have to push the price back above $0.000014. If they do that, it will suggest strong buying at lower levels and could clear the path for a possible rally to $0.000017. The SHIB/USDT pair could signal a trend change above $0.000018.AVAX/USDTAvalanche (AVAX) could not sustain above the breakout level of $26.38 on Aug. 17, indicating that traders were rushing to the exit. The selling continued and the price broke below the 50-day SMA ($22.93) on Aug. 19.AVAX/USDT daily chart. Source: TradingViewThe bulls have to defend the support line or else the selling could intensify and the AVAX/USDT pair could decline to $16 and then to $13.71. A break and close below $13.71 could signal the start of the next leg of the downtrend.Conversely, if the price rebounds off the support line, it will suggest that bulls are attempting to form a higher low. The buyers will have to push and sustain the price above $26.38 to gain the upper hand. Such a move will increase the likelihood of a break above $31.The views and opinions expressed here are solely those of the author and do not necessarily reflect the views of Cointelegraph. Every investment and trading move involves risk. You should conduct your own research when making a decision.Market data is provided by HitBTC exchange.

Čítaj viac

Získaj BONUS 8 € v Bitcoinoch

nakup bitcoin z karty

Registrácia Binance

Burza Binance

Aktuálne kurzy