Autor Cointelegraph By Rakesh Upadhyay

Price analysis 9/21: BTC, ETH, BNB, XRP, ADA, SOL, DOGE, DOT, MATIC, SHIB

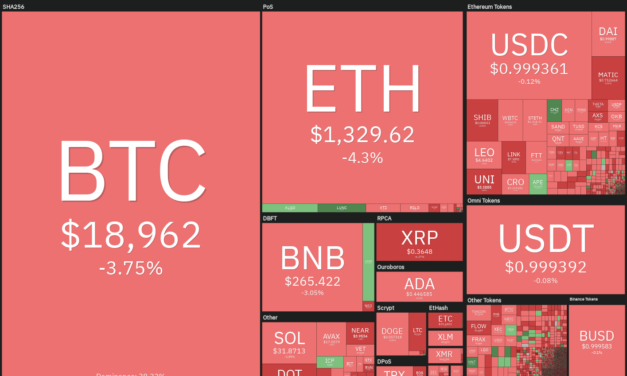
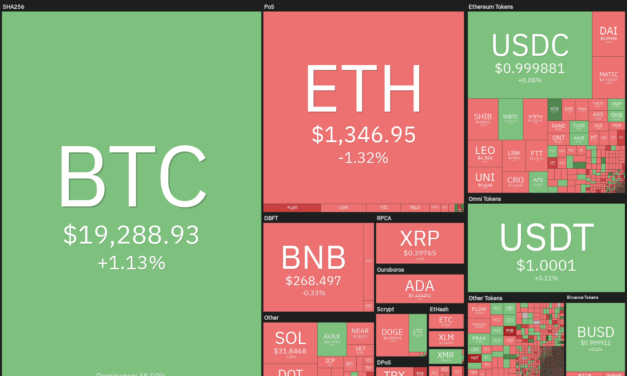
The Federal Reserve hiked rates by 75 basis points on Sept. 21 and Fed Chair Jerome Powell projected another 125 basis points increase before the end of the year. If that happens, it will take the benchmark rate to 4.4% by the end of the year, which is sharply higher than the June estimates of 3.8%. The Fed also intimated that it only expects rate cuts to be considered in 2024.The expectation of higher rates pushed the 2-year Treasury to 4.1%, its highest level since 2007. This could attract several investors who are looking for safety in this uncertain macro environment. Higher rates are also likely to reduce the appeal of risky assets such as stocks and cryptocurrencies and may delay the start of a new uptrend.Daily cryptocurrency market performance. Source: Coin360Even though Bitcoin (BTC) faces several headwinds in the near term, it did not deter MicroStrategy from buying more coins. After the latest purchase of 301 Bitcoin, the company’s stash has risen to 130,000 Bitcoin. This shows that MicroStrategy and its executive chairman, Michael Saylor, remain bullish on the long-term prospects of Bitcoin.Bitcoin and altcoins are trying to stabilize after the Fed’s announcement. Could they start a recovery? Let’s study the charts of the top-10 cryptocurrencies to find out.BTC/USDTBitcoin plunged below the immediate support at $18,626 on Sept. 19 but the long tail on the candlestick shows strong buying at lower levels. The bulls again defended the level on Sept. 21, which is a positive sign.BTC/USDT daily chart. Source: TradingViewBuyers will have to push the price above the 20-week exponential moving average (EMA) ($20,100) to indicate that the sellers may be losing their grip. The BTC/USDT pair could then rise to the 50-day simple moving average (SMA) ($21,363). This level may again act as a stiff resistance but if bulls overcome this barrier, the pair could rally to $25,211.If the price turns down from the 20-day EMA, the bears will again try to sink the pair below the strong support zone between $18,626 and $17,622. If they succeed, the pair may witness panic selling and could drop to $14,000.ETH/USDTEther (ETH) has been declining in a descending channel pattern for the past few days. The price bounced off the support line of the channel on Sept. 19, indicating buying on dips.ETH/USDT daily chart. Source: TradingViewThe bulls are attempting to start a relief rally which could pick up strength above $1,400. If this level is conquered, the ETH/USDT pair could rise to the 20-day EMA ($1,513). This level could be the real test for the bulls in the near term because a break above it could clear the path for a possible rally to the resistance line of the channel. If the price turns down from the 20-day EMA, it will suggest that the sentiment remains negative and traders are selling on rallies. That could sink the price to the support line of the channel. If this support fails to hold up, the pair could plummet to $1,000.BNB/USDTBNB is correcting inside a descending channel pattern. The strong bounce off $258 is a positive sign as it indicates demand at lower levels.BNB/USDT daily chart. Source: TradingViewThe bulls will attempt to push the price above the 20-day EMA ($278) and challenge the resistance line of the channel. The 50-day SMA ($293) is placed just above the channel, hence the bears are expected to defend the level aggressively.If the price turns down from the resistance line, the BNB/USDT pair could again drop to $258. If this support cracks, the pair could slide to the support line of the channel.The bulls will have to push and sustain the price above the channel to improve the prospects of a rally to the stiff overhead resistance at $338.XRP/USDTXRP broke and closed above the overhead resistance at $0.41 on Sept. 20 but the bulls could not build upon this strength. The bears pulled the price back into the range on Sept. 21.XRP/USDT daily chart. Source: TradingViewIf the bulls do not give up much ground from the current level, it will increase the possibility of a break above $0.41. The 20-day EMA ($0.36) has started to turn up and the RSI is in the positive territory, indicating that the path of least resistance is to the upside. If the price breaks and sustains above $0.41, the XRP/USDT pair could reach $0.46 and then $0.52.The bears will have to sink the price below the moving averages to suggest that the pair may continue to oscillate inside the range for some more time.ADA/USDT Buyers are trying to sustain Cardano (ADA) above the uptrend line. The bulls tried to push the price higher on Sept. 21 but the long wick on the candlestick shows that bears are selling on intraday rallies.ADA/USDT daily chart. Source: TradingViewIf the price continues lower and slips below the uptrend line, the ADA/USDT pair could drop to the pivotal level at $0.40. If bears sink the price below this support, the pair could start the next leg of the downtrend.On the upside, if bulls push the price above the 20-day EMA, the pair could rally to the downtrend line. Buyers will have to thrust the price above this resistance to gain the upper hand. The pair could then rise to $0.52 and thereafter to $0.60.SOL/USDTSolana (SOL) bounced off the immediate support at $30 but the bulls could not push the price above the 20-day EMA ($33). This indicates that bears are active at higher levels.SOL/USDT daily chart. Source: TradingViewA minor positive is that the bulls have not given up and are again trying to propel the price above the 20-day EMA. If they manage to do that, the SOL/USDT pair could rally to the 50-day SMA ($36). The bears may attempt to defend the zone between the 50-day SMA and $39 because if they fail to do so, the pair may soar to $48.To invalidate this bullish view, bears will have to pull the price below $30. That could sink the pair to the important level at $26. If this support gives way, the pair could resume the downtrend.DOGE/USDTDogecoin (DOGE) is getting squeezed between the 20-day EMA ($0.06) and the immediate support at $0.06. This suggests that the bulls are buying the dips but they continue to face strong resistance from the bears on every minor rally.DOGE/USDT daily chart. Source: TradingViewIf the price breaks above the 20-day EMA, it will suggest that buyers are making a comeback. The DOGE/USDT pair could then rise to the 50-day SMA ($0.07) where the bears will again try to stall the recovery. The bulls will have to overcome this obstacle to open the doors for a possible rally to $0.09.If the price turns down and breaks below the strong support at $0.06, it will indicate that the uncertainty has resolved in favor of the bears. The pair could then decline to the crucial support at $0.05.Related: Crypto and stocks soften ahead of Fed rate hike, but XRP, ALGO and LDO look ‘interesting’DOT/USDTPolkadot (DOT) has been consolidating between $6 and $10 for the past several days. The price has slipped to the critical support at $6, which had held successfully in mid-July.DOT/USDT daily chart. Source: TradingViewBuyers are expected to defend the $6 level with vigor because a break and close below it could signal the resumption of the downtrend. The DOT/USDT pair could then decline to the next major support at $4.Alternatively, if the price rebounds off the current level and breaks above the 20-day EMA, it will suggest accumulation at lower levels. The pair could then rise to the 50-day SMA ($7.69). A break above this level could clear the path for a possible rally to $10.MATIC/USDTPolygon (MATIC) has been trading inside a large range between $0.72 and $1.05 for the past several days. The price has currently reached the support of the range.MATIC/USDT daily chart. Source: TradingViewIf the price bounces off $0.72, the pair could reach the 20-day EMA. This is an important level to keep an eye on in the short term. If the price turns down from this resistance, the likelihood of a break below $0.72 increases. The MATIC/USDT pair could then drop to $0.62 and later to $0.52.On the contrary, if the price rises above the moving averages, it will suggest strong demand at lower levels. That could keep the pair stuck inside the range for a few more days.SHIB/USDTShiba Inu (SHIB) bounced off the immediate support at $0.000010 on Sept. 18 but the bears stalled the recovery at $0.000011. The bears will again attempt to sink the price below the support at $0.000010. SHIB/USDT daily chart. Source: TradingViewThe downsloping 20-day EMA ($0.000012) and the RSI in the negative zone suggest that bears are in command. If the price slips and sustains below $0.000010, the SHIB/USDT pair could extend its decline to the vital support at $0.000007.If bulls want to avert this collapse, they will have to quickly push the price above the 20-day EMA. The pair could then rise to $0.000014 where the bears may again mount a stiff resistance. If the price turns down from this level, the pair may consolidate between $0.000010 and $0.000014 for some time.The views and opinions expressed here are solely those of the author and do not necessarily reflect the views of Cointelegraph. Every investment and trading move involves risk. You should conduct your own research when making a decision.Market data is provided by HitBTC exchange.

Čítaj viac

Price analysis 9/19: BTC, ETH, BNB, XRP, ADA, SOL, DOGE, DOT, MATIC, SHIB

The United States equities markets and the crypto markets are likely to remain volatile in the near term because traders remain nervous about the size of the next Federal Reserve rate hike on Sept. 20 and 21. While the majority favors a 75 basis point rate hike, according to the CME FedWatch Tool, some analysts expect the Fed to hike rates by 100 basis points, the first such instance since the early 1980s.Many expect Bitcoin (BTC) to continue its slide and drop below the June low in the future. Although anything is possible in the markets, many times, the markets do not oblige the majority. If the Fed does not surprise the markets, traders who may be cautious and sitting on the sidelines could jump right back in, resulting in a brief relief recovery. Daily cryptocurrency market performance. Source: Coin360Bear markets offer an opportunity for investors to accumulate in the long term. It is futile to catch the bottom, hence, traders may be on the lookout to start accumulating during periods of extreme pessimism. A strong stomach is needed to tide over the volatility but the ones who do that are likely to benefit when the next bull run begins.Could Bitcoin and altcoins stage a turnaround or is a deeper decline possible? Let’s study the charts of the top-10 cryptocurrencies to find out.BTC/USDTBitcoin has been in a strong downtrend for several months. Buyers started a recovery from the June low at $17,622 and pushed the price above the 200-week simple moving average (SMA) but they could not sustain the higher levels. BTC/USDT daily chart. Source: TradingViewThe bulls again tried to push the price above the 200-week SMA last week but the bears held their ground. This shows that bears are defending the 200-week SMA with vigor. Hence, this level becomes a key resistance to watch for on the upside.On the downside, the bulls are expected to aggressively defend the support at $17,622. The first sign of strength will be a break and close above $20,000. That will suggest a range-bound action for the BTC/USDT pair between $17,622 and $25,211.A trend change will be signaled after buyers propel the price above $25,211. The pair could then rally to $32,000.Conversely, if bears sink and sustain the price below $17,622, it could signal the resumption of the downtrend. The pair could then decline to $14,000.ETH/USDTThe bears have been defending the 20-week exponential moving average (EMA) ($1,732) for the past few weeks. This suggests that the sentiment in Ether (ETH) remains bearish and traders are selling on rallies.ETH/USDT daily chart. Source: TradingViewThe ETH/USDT pair turned down sharply from the 20-week EMA last week and has reached the 200-week SMA ($1,283). Buyers are expected to defend this level vigorously. The bulls will have to push and sustain the price above the 20-week EMA to indicate that the bears may be losing their grip. A potential trend change could be signaled on a break above $2,030. Until then, the bears are likely to sell on every rally. If the price breaks below the 200-week SMA, the selling could intensify and the bears will try to pull the price to the June low of $881. This is an important level for the bulls to defend because a break below it could result in panic selling.BNB/USDTBNB is one of the outperformers among the major cryptocurrencies as it is trading well above its 200-week SMA ($175). Buyers pushed the price above the 20-week EMA ($295) but they could not build upon this strength. The bears stalled the recovery at $338 and pulled the price back below the 20-week EMA. BNB/USDT daily chart. Source: TradingViewSince then, the bears have thwarted several attempts by the bulls to drive the price back above the 20-week EMA. This indicates that bears are selling the rallies to the 20-week EMA. The bears will attempt to sink the BNB/USDT pair to the 200-week SMA, which is likely to attract strong buying by the bulls.The first sign of strength will be a break above the 20-week EMA. That could clear the path for a retest of $338. The bulls will have to clear this overhead hurdle to suggest the start of a new up-move.XRP/USDTRipple (XRP) has been consolidating in a downtrend for the past few weeks. Buyers attempted to push the price above the resistance of the range at $0.41 last week but the bears successfully defended the level.XRP/USDT daily chart. Source: TradingViewThe sellers will try to pull the price to the support at $0.30. This remains the important level to keep an eye on because if bears sink the price below $0.30, the XRP/USDT pair could begin the next leg of the downtrend. The pair could then decline to $0.24 and later to $0.17.The 20-week EMA is flattening out, indicating that the selling pressure could be weakening. If the price rebounds off $0.30, the pair could extend its stay inside the range for a few more days. Buyers will have to push and sustain the price above the 200-week SMA ($0.48) to indicate that the pair may have bottomed out.ADA/USDT Cardano (ADA) has been trading below the moving averages for the past few weeks. Attempts by the bulls to push the price above the 200-week SMA ($0.57) were met with strong selling by the bears.ADA/USDT daily chart. Source: TradingViewAlthough the bulls have held the $0.40 support for the past several weeks, the failure to push the price above the 200-week SMA indicates that bears are selling on rallies. The bears will try to sink the price below the support at $0.40. If they succeed, the ADA/USDT pair could resume its downtrend. The next support on the downside is $0.33 and then $0.28.If bulls want to avert this catastrophe, they will have to quickly push the price above the 200-week SMA. The bears may again attempt to pose a strong challenge at $0.70 but if bulls overcome this barrier, the pair may indicate the start of a new uptrend. The pair could first rise to the 50-week SMA ($0.96) and thereafter to $1.25.SOL/USDTSolana (SOL) rallied from the June low of $26 but the recovery fizzled out near $48. The failure of the bulls to push the price to the 20-week EMA ($46) suggests that bears are selling on minor rallies.SOL/USDT daily chart. Source: TradingViewThe bears will try to pull the price to the crucial support of $26, which has not been tested since June. If this support cracks, the selling could pick up momentum and the SOL/USDT pair could drop to $20. The bulls are likely to defend this level aggressively.Alternatively, if the price turns up from the current level or rebounds off $26, the bulls will again try to drive the pair to the overhead resistance at $48. Buyers will have to clear this obstacle to indicate the start of a new uptrend. The pair could then attempt a rally to $78.DOGE/USDTDogecoin (DOGE) recovered from $0.05 in June and reached the 20-week EMA ($0.08) in August but the bulls could not push the price above this resistance. The bears aggressively defended the level and are trying to sink the price back to $0.05.DOGE/USDT daily chart. Source: TradingViewIf the $0.05 support gives way, the DOGE/USDT pair could resume its downtrend. The next support on the downside is at $0.04 but if bulls fail to defend this level, the selling could intensify and the pair could collapse below $0.01.There is a small ray of hope for the bulls because the RSI is attempting to form a positive divergence. This suggests that the selling pressure could be reducing. If the price rebounds off $0.05, the bulls will again try to propel the pair above $0.09. If that happens, the pair could rise to the 50-week SMA ($0.13).Related: XRP price risks 30% decline despite Ripple’s legal win prospectsDOT/USDTPolkadot (DOT) has been consolidating between $6 and $10 for the past few weeks. Usually in a range, traders buy the dips to the support and sell near the overhead resistance.DOT/USDT daily chart. Source: TradingViewIf the price rebounds off the $6 support with strength, it will suggest that buyers are accumulating on dips. That could keep the DOT/USDT pair stuck inside the range for some more time. The longer the price trades inside a range, the stronger will be the eventual breakout from it.If buyers propel the price above $10, it will suggest that the downtrend could be ending. That could clear the path for a possible rally to the 50-week SMA ($19). Contrarily, if the price slips below the $6 support, the pair could start the next leg of the downtrend. The pair could then drop to the $3.50 to $4 support zone.MATIC/USDTPolygon (MATIC) moved up sharply from $0.31 in June and broke above the 20-week EMA ($0.87) but the buyers could not extend the recovery. The bears stalled the relief rally at $1.05 and pulled the price back below the 20-week EMA. MATIC/USDT daily chart. Source: TradingViewThe bulls again tried to thrust and sustain the price above the 20-week EMA last week but the bears did not relent. They sold aggressively and have pulled the price to the immediate support of $0.72. If this support breaks down, the MATIC/USDT pair could slide to $0.45 and then to $0.31.On the contrary, if the price rises from the current level and breaks above the 20-week EMA, the pair could challenge the overhead resistance at $1.05. A break and close above this level will suggest that the downtrend may be over. The price could then rally to the 50-week SMA ($1.31) and after that to $1.75.SHIB/USDTShiba Inu (SHIB) rallied sharply from its June low and rose above the 20-week EMA ($0.000013) in August. However, the breakout proved to be a bear trap as the price turned down from $0.000018 and slipped back below the 20-week EMA.SHIB/USDT daily chart. Source: TradingViewEven though the price has been trading below the 20-week EMA, the bulls have not allowed the SHIB/USDT pair to retest the June low at $0.000007. This indicates that buyers are attempting to form a higher low.The first sign of strength will be a break and close above the 20-week EMA. The pair could then rally to $0.000018. If bulls drive the price above this resistance, it will suggest a potential trend change. The pair could then surge to $0.000030.This positive view could invalidate if the price continues lower and breaks below $0.000007. That could sink the pair to $0.000005.The views and opinions expressed here are solely those of the author and do not necessarily reflect the views of Cointelegraph. Every investment and trading move involves risk. You should conduct your own research when making a decision.Market data is provided by HitBTC exchange.

Čítaj viac

Here is why a 0.75% Fed rate hike could be bullish for Bitcoin and altcoins

The S&P 500 and the Nasdaq Composite index suffered their worst weekly performance since June as investors remain concerned that the Federal Reserve will have to continue with its aggressive monetary policy to curb inflation and that could lead to a recession in the United States.Bitcoin (BTC) remains closely correlated to the S&P 500 and is on track to fall more than 9% this week. If this correlation continues, it could bring more pain to the cryptocurrency markets because Goldman Sachs strategist Sharon Bell cautioned that aggressive rate hikes could trigger a 26% fall in the S&P 500.Crypto market data daily view. Source: Coin360The majority expect the Fed to hike rates by 75 basis points in the next meeting on Sept. 20 to Sept. 21 but the FedWatch Tool shows an 18% probability of a 100 basis point rate hike. This uncertainty could keep traders on the edge, resulting in heightened short-term volatility.If the Fed’s rate hike is in line with market expectations, select cryptocurrencies could attract buyers. Let’s study the charts of five cryptocurrencies that are positive in the near term.BTC/USDTBitcoin recovered from $19,320 on Sept. 16 and rallied above $20,000 on Sept. 17 but the bulls are struggling to sustain the higher levels. This suggests that bears are active at higher levels.BTC/USDT daily chart. Source: TradingViewThe 20-day exponential moving average ($20,432) has turned down gradually and the relative strength index (RSI) is in the negative zone, suggesting that the sentiment remains negative and traders are selling near overhead resistance levels.If the price continues lower and breaks below $19,320, the BTC/USDT pair could decline to $18,510. Buyers are expected to defend this level with vigor.On the upside, the 50-day simple moving average ($21,605) is the key level to keep an eye on. If bulls push the price above it, the pair could rally to $25,211. A break and close above this resistance could indicate the start of a new uptrend. BTC/USDT 4-hour chart. Source: TradingViewThe 4-hour chart shows that the sellers are trying to stall the recovery at the 20-EMA. This indicates that the bears are in no mood to surrender their advantage. If the weakness persists and the price breaks below $19,320, the pair could slide to $18,510.Conversely, if the price turns up from the current level and breaks above the 20-EMA, the recovery could extend to the 50-SMA. This level may again act as a resistance but if this obstacle is cleared, the next stop could be the 61.8% Fibonacci retracement level of $21,470. XRP/USDTRipple (XRP) has been stuck inside a range between $0.30 and $0.39 for many days. The price has reached the resistance of the range and if bulls clear this hurdle, it could signal the start of a new uptrend. XRP/USDT daily chart. Source: TradingViewIn a range, traders usually buy near the support and sell close to the resistance. If the price turns down sharply from the current level and breaks below the moving averages, it will indicate that the XRP/USDT pair may extend its consolidation for a few more days.Although the moving averages are criss-crossing each other, the RSI has jumped into positive territory, indicating that bulls have a slight edge. If buyers drive and sustain the price above $0.39, the pair could rally to $0.48.XRP/USDT 4-hour chart. Source: TradingViewThe pair rallied sharply from $0.32 to $0.39, indicating strong buying by the bulls. The 20-EMA has turned up and the RSI is in the positive zone, suggesting that the path of least resistance is to the upside.If the price continues higher and breaks above $0.39, the bullish momentum could pick up and the pair could rally to $0.41. This level may act as a resistance but if buyers flip the $0.39 level into support, the up-move could resume.LINK/USDTChainlink (LINK) has been stuck inside a large range between $5.50 and $9.50 for the past several weeks, indicating that buyers are attempting to form a bottom. The bulls pushed the price above the moving averages and the RSI jumped into positive territory, indicating that the positive momentum could be improving. LINK/USDT daily chart. Source: TradingViewThere is a minor resistance at $8.30 and if bulls push the price above it, the LINK/USDT pair could rally to the stiff resistance at $9.50. This level is likely to attract aggressive selling by the bears but if bulls pierce through the barrier, it could indicate the start of a new uptrend.The moving averages are the important support to watch for on the downside because if they give way, the selling pressure may pick up. That could start a decline to $7 and thereafter to $6.20.LINK/USDT 4-hour chart. Source: TradingViewBuyers are attempting to defend the moving averages on the 4-hour chart. That could start a recovery toward the overhead resistance at $8.20. If the price rises above this overhead resistance, the pair could rally to $9.If bulls fail to push the price above $8.20, the bears may fancy their chances and try to sink the pair below the moving averages. That may tilt the advantage in favor of the bears. The pair could first decline to $7.50 and then to $7.Related: Dogecoin has crashed 75% against Bitcoin since Elon Musk’s SNL appearanceEOS/USDTThe bears pulled EOS below the 50-day SMA ($1.44) on Sept. 15 but they could not break the support at $1.34. This suggests that bulls are buying on dips and are attempting to form a low near $1.34. A minor negative is that bulls are facing strong resistance at the 20-day EMA ($1.50). This indicates that the bears have not given up and are attempting to wrest control. This tussle between the bulls and the bears is likely to resolve with a strong breakout.If the price breaks above the 20-day EMA, the bullish momentum could pick up and the EOS/USDT pair could rally to $1.86. Alternatively, if the price turns down and breaks below $1.34, the pair could decline to $1.24. A break below this support could sink the pair to $1.EOS/USDT 4-hour chart. Source: TradingViewThe recovery faltered near $1.50, indicating that bears continue to sell on rallies. The bears will try to further cement their edge by pulling the price below the strong support of $1.34, but that may not be that easy.Buyers have defended the $1.34 level on three occasions and will again try to do so. If the price rebounds off $1.34, the bulls may again attempt a rally above the overhead resistance of $1.50. If they manage to do that, a rally to $1.70 and later to $1.86 is possible.XTZ/USDTTezos (XTZ) broke below the 20-day EMA ($1.57) on Sept. 13 but the bears could not pull the price to the support line of the symmetrical triangle. This indicates that buyers are accumulating on dips and not waiting for a deeper correction to make an entry. This increases the likelihood of a recovery in the near term.XTZ/USDT daily chart. Source: TradingViewIf the price breaks above the 20-day EMA, the XTZ/USDT pair could rise to the 50-day SMA ($1.66). This level has acted as a strong resistance on two previous occasions, hence it is an important level to keep an eye on. If bulls overcome this barrier, the pair could attempt a rally to the resistance line of the triangle.A break above the triangle will signal a potential trend change. The pair could then rise to $2 and later to $2.36.Meanwhile, the bears are likely to have other plans. They will try to stall the recovery at the moving averages. If the price turns down from the current level and slips below the $1.50 to $1.40 support zone, the June low at $1.20 may be revisited.XTZ/USDT 4-hour chart. Source: TradingViewThe 4-hour chart shows that the bulls defended the support at $1.50 and pushed the price above the downtrend line but they could not sustain the higher levels. If bears sink the price below $1.50, the pair could decline to $1.40.On the other hand, if the price rebounds off the $1.50 support once again, it will suggest that lower levels continue to attract buyers. The bulls will then try to push the price above the moving averages and challenge the resistance at $1.62. If this level gives way, the up-move could reach $1.70.The views and opinions expressed here are solely those of the author and do not necessarily reflect the views of Cointelegraph. Every investment and trading move involves risk, you should conduct your own research when making a decision.

Čítaj viac

Price analysis 9/16: SPX, DXY, BTC, ETH, BNB, XRP, ADA, SOL, DOGE, DOT

The World Bank has warned of a possible global recession in 2023. In a press release on Sept. 15, the bank said that the current pace of rate hikes and policy decisions is unlikely to be enough to bring inflation down to pre-pandemic levels.Ray Dalio, the billionaire founder of Bridgewater Associates said in a blog post on Sept. 13 that if rates were to rise to about 4.5% in the United States, it would “produce about a 20 percent negative impact on equity prices.”The negative outlook for the equity markets does not bode well for the cryptocurrency markets as both have been closely correlated in 2022. Daily cryptocurrency market performance. Source: Coin360The macroeconomic developments seem to be worrying cryptocurrency investors who sent 236,000 Bitcoin (BTC) to major cryptocurrency exchanges on Sept. 14, according to Glassnode data. The inflow was the highest since March 2020.Let’s study the charts of the S&P 500 index, the U.S. dollar index (DXY) and the major cryptocurrencies to determine the key levels that could signal the start of a trending move.S&P 500 The S&P 500 index (SPX) attempted a rebound off the uptrend line on Sept. 14 but the weak rebound showed a lack of urgency to defend the level. Sellers took advantage of this situation and pulled the price below the uptrend line on Sept. 15.SPX daily chart. Source: TradingViewThe level of 3,886 from where the index had bounced on Sept. 6 also failed to provide any support, indicating that traders are in a hurry to sell their positions. Usually, the breakdown from a level tends to retest it. In this case, the price could rise to the uptrend line. If the price turns down from this level, it will suggest that bears have flipped the uptrend line into resistance. That could increase the possibility of a drop to 3,700.The downsloping 20-day exponential moving average (EMA) (4,006) and the relative strength index below 37 suggest that bears are in command.If the price turns up and rises above the uptrend line, it will suggest that the breakdown on Sept. 15 may have been a bear trap. That could propel the index to the downtrend line.DXYThe DXY is in a strong uptrend. The bears tried to pull the price below the moving averages but the bulls vigorously defended the 50-day simple moving average (SMA(107) on Sept. 13.DXY daily chart. Source: TradingViewBoth moving averages are sloping up and the RSI is in the positive territory indicating advantage to buyers. The bulls will next attempt to push the price above the overhead resistance at 110.78. This is an important level to keep an eye on because if the price sustains above this level, the rally could extend to 115.If the price turns down from the current level or the overhead resistance and breaks below the 20-day EMA (109), it will suggest a consolidation in the near term. The price could then range between 107.58 and 110.78 for a few days. A potential trend change could be signaled if bears sink the price below 107.58.BTC/USDTBitcoin formed a Doji candlestick pattern on Sept. 14, indicating indecision among the bulls and the bears. The uncertainty resolved to the downside on Sept. 15 but the bears have failed to build upon this advantage. This indicates that the selling pressure reduces at lower levels.BTC/USDT daily chart. Source: TradingViewBuyers will attempt to salvage the situation by pushing the price above the 20-day EMA ($20,529). If that happens, the BTC/USDT pair could rise to the overhead resistance at $22,799. The bears may defend this level aggressively but if bulls thrust the price above it, the pair could rally to $25,211.Contrarily, if the price turns down from the current level or the 20-day EMA, it will suggest that the sentiment remains negative and traders are viewing rallies as a selling opportunity. That could sink the pair to the strong support at $18,510. The zone between $18,510 and $17,622 could witness aggressive buying from the bulls because the failure to defend this zone may start the next leg of the downtrend.ETH/USDTEther (ETH) bounced off the support line on Sept. 14 but the joy of the bulls proved to be short-lived. The price turned down sharply from the 20-day EMA ($1,609) and plunged below the support line on Sept. 15.ETH/USDT daily chart. Source: TradingViewThe 20-day EMA has started to turn down and the RSI has slipped below 39, indicating that bears are in control. The sellers have pulled the price to $1,422 and if this support cracks, the ETH/USDT pair could drop to $1,280.If the price turns up from the current level, the pair could recover to the moving averages, which may act as a strong resistance. The bulls will have to clear this hurdle to suggest that the selling pressure could be reducing.BNB/USDTThe bears pulled BNB below the immediate support at $275 but they are struggling to keep the price down. This indicates that lower levels are attracting buyers.BNB/USDT daily chart. Source: TradingViewIf the price sustains above $275, the BNB/USDT pair could be in the early stages of forming a symmetrical triangle. This suggests uncertainty about the next directional move among the bulls and the bears. That could keep the price inside the triangle for some time.If the price rises above the 20-day EMA ($283), the pair could rally to the resistance line of the triangle. A break above the triangle could push the pair to $338. Another possibility is that the price turns down from the 20-day EMA and plummets below the support line of the triangle. That could start a decline to $258 and later to $239.XRP/USDTRipple (XRP) has been range-bound between $0.30 and $0.39 for the past several weeks. In the past few days, the range has shrunk further with bulls buying the dips to $0.32 and bears selling the recovery to the 50-day SMA ($0.35).XRP/USDT daily chart. Source: TradingViewThe price action inside a range is usually volatile and difficult to call. Still, as the buyers had successfully defended the $0.32 support between Aug. 28 and Sept. 7, they will again try to do that. If the price rises from the current level, the XRP/USDT pair could rally to the 20-day EMA ($0.34) and later to the 50-day SMA.If bulls drive the price above the 50-day SMA, the likelihood of a rally to $0.39 increases. The bears are expected to defend this level aggressively. On the downside, if the price slips below $0.32, the crucial support of $0.30 may be retested.ADA/USDT The bears are attempting to build upon their advantage in Cardano (ADA). They sold the recovery to the 20-day EMA ($0.48) on Sept. 14 and are trying to pull the price below the immediate support at $0.45.ADA/USDT daily chart. Source: TradingViewAlthough moving averages are not a valuable tool in a ranging market, they tend to be helpful to determine the short-term trend. The 20-day EMA has started to turn down and the RSI is in the negative territory, indicating advantage to bears. If the price slips and sustains below $0.45, the ADA/USDT pair could drop to $0.42.If bulls want to gain the upper hand, they will have to arrest the decline and push the price above the moving averages. That could clear the path for a rally to the downtrend line. A break above this resistance could indicate that the bulls are back in the driver’s seat.Related: Does Ethereum’s new ETHPoW fork stand a chance? ETHW price falls 65% post-MergeSOL/USDTSolana (SOL) turned down from the 20-day EMA ($33.84) on Sept. 15, indicating that the sentiment remains negative and bears are selling on minor rallies.SOL/USDT daily chart. Source: TradingViewThe SOL/USDT pair could decline to the strong support at $30. This level was resilient during the onslaught between Aug. 28 and Sept. 7 and gave a bounce to $39 on Sept. 13. Short-term traders may again expect a bounce off $30 and are likely to buy the dips to this level.The rebound off the support could continue to face hurdles at the 20-day EMA and then again at the 50-day SMA ($36.95). If the price closes above this resistance, it could open the doors for a possible up-move to $48. Conversely, if the $30 level cracks, the pair could slide to the vital support at $26.DOGE/USDTDogecoin (DOGE) has continued its slide and is near the strong support of $0.06. The price rebounded off this level on Sept. 7; hence, it may again attract buyers.DOGE/USDT daily chart. Source: TradingViewA break and close above the 20-day EMA ($0.06) will be the first sign of demand building up at higher levels. The DOGE/USDT pair could then rise to $0.07. This level may again act as a resistance but if bulls push the price above it, the pair could rise to $0.08 and thereafter to $0.09. If the price slips below the immediate support at $0.06, the pair could slide to the June low near $0.05. The bears will have to sink and sustain the price below this level to signal the start of the next leg of the downtrend. The pair could then extend the decline to $0.04.DOT/USDTThe bulls attempted to start arecovery on Sept. 14 but higher levels attracted selling by the bears. Polkadot (DOT) turned down on Sept. 15 and the bears are trying to sink the price below the immediate support of $6.75.DOT/USDT daily chart. Source: TradingViewBuyers had successfully defended the $6.75 level on two previous occasions; hence, a break and close below it may intensify selling. The DOT/USDT pair could first drop to $6.50 and later to the crucial support at $6. As the previous three recoveries have turned down from the 50-day SMA ($7.86), it remains the key level to watch out for on the upside. The bulls will have to overcome this barrier to start a rally to $9.17 and then to $10.The views and opinions expressed here are solely those of the author and do not necessarily reflect the views of Cointelegraph. Every investment and trading move involves risk. You should conduct your own research when making a decision.Market data is provided by HitBTC exchange.

Čítaj viac

Price analysis 9/14: BTC, ETH, BNB, XRP, ADA, SOL, DOGE, DOT, MATIC, SHIB

The United States equities markets and the cryptocurrency markets had been rising leading up to the Sept. 13 release of the August consumer price index data, but the rally fell apart once the data showed inflation rising, rather than falling.The negative data dashed any hope of a Federal Reserve pivot in the near term and it triggered a sharp decline in risky assets. The market capitalization of U.S. stocks plunged by about $1.6 trillion on Sept. 13 and the market cap of the cryptocurrency markets slipped below $1 trillion.Daily cryptocurrency market performance. Source: Coin360Statistician and independent market analyst Willy Woo, believes that Bitcoin (BTC) may have to fall further before it reaches the maximum pain experienced during previous bottoms. Woo expects Bitcoin price to decline below $10,000.Could Bitcoin and altcoins resume their downtrend? Let’s study the charts of the top-10 cryptocurrencies to find out.BTC/USDTBitcoin broke above the 50-day simple moving average ($21,902) on Sept. 12, but this proved to be a bull trap. Buyers attempted to extend the recovery on Sept. 13 but the rally reversed direction from $22,799.BTC/USDT daily chart. Source: TradingViewAggressive selling by the bears pulled the price back below the 20-day exponential moving average ($20,722). A minor positive is that the bulls are attempting to stall the decline at $20,000. If buyers push the price back above the 20-day EMA, it will suggest that lower levels continue to attract buyers. The BTC/USDT pair will then attempt to rise to the 50-day SMA and later retest $22,799. A break and close above this resistance could open the doors for a possible rally to $25,211.Contrary to this assumption, if the price slips below $19,860, the pair could drop to the $18,510 to $17,622 zone. The bulls are expected to defend this zone with vigor.ETH/USDTEther (ETH) turned down and plummeted below the moving averages on Sept. 13, tilting the short-term advantage in favor of the bears. A minor positive is that the bulls are attempting to defend the support line of the rising wedge pattern.ETH/USDT daily chart. Source: TradingViewIf the price rebounds off the current level and rises above the moving averages, the ETH/USDT pair could rally to the resistance line of the wedge. The bulls will have to push and sustain the price above the wedge to clear the path for a possible rally to $2,030.Alternatively, if the price fails to cross above the moving averages, the likelihood of a drop below the bearish wedge pattern increases. If that happens, the selling pressure could pick up and the pair could drop to $1,422 and later to $1,280. Buyers are expected to mount a strong defense at this level.BNB/USDTBinance Coin (BNB) turned down from $300 on Sept. 12 and plunged below the moving averages on Sept. 13. This tilted the short-term advantage in favor of the bears but the bulls have not yet given up. BNB/USDT daily chart. Source: TradingViewBuyers are attempting to defend the immediate support at $275 and push the price above the 20-day EMA ($285). If they succeed, the BNB/USDT pair could challenge the $300 to $307.50 resistance zone. If buyers clear this zone, the rally could pick up momentum.Conversely, if bulls fail to push the price above the 20-day EMA, it will suggest that bears are selling on minor rallies. That could enhance the prospects of a break below $275. If that happens, the pair could decline to $258 and then to $240.XRP/USDTAfter trading near the 50-day SMA ($0.35) for three days, XRP turned down and broke below the moving averages on Sept. 13. This pulled the price below the breakout level of $0.34.XRP/USDT daily chart. Source: TradingViewBuyers are trying to push the price back above the 20-day EMA ($0.34) on Sept. 14. If they succeed, it will suggest that the XRP/USDT pair has formed a higher low at $0.33. The pair could then retest the overhead resistance at $0.36. A break and close above this level could push the pair toward $0.39.Contrary to this assumption, if the price turns down from the 20-day EMA, it will suggest that bears are selling on minor rallies. That could pull the price down to the strong support at $0.32.ADA/USDT Cardano (ADA) rose above the 50-day SMA ($0.49) on Sept. 9 but the bulls could not continue the recovery and push the price to the downtrend line. This indicates hesitation by the bulls to buy at higher levels.ADA/USDT daily chart. Source: TradingViewThe failure to extend the recovery may have tempted short-term traders to book profits. That pulled the price back below the moving averages on Sept.13. A minor positive is that the ADA/USDT pair rebounded off $0.46 and the bulls are attempting to push the price back above the moving averages. This indicates that lower levels continue to attract strong buying by the bulls. If the price rises above the 50-day SMA, the pair could reach the downtrend line.This view will invalidate in the near term if the price turns down from the moving averages and plummets below $0.45. The pair could then decline to $0.42.SOL/USDTBuyers pushed Solana (SOL) above the 50-day SMA ($37.30) on Sept. 13 and Sept. 14 but the bulls could not sustain the higher levels. This shows that bears are defending the 50-day SMA with vigor.SOL/USDT daily chart. Source: TradingViewStrong selling on Sept. 13 pulled the price below the 20-day EMA ($34). The bears will now try to sink the SOL/USDT pair to the immediate support at $30. The repeated retest of a support level tends to weaken it. If the $30 level cracks, the pair could start its descent to the vital support at $26.Contrary to this assumption, if the price turns up from the current level and breaks above the 20-day EMA, the pair could rise to the 50-day SMA. The bulls will have to clear this overhead hurdle to indicate the start of an up-move to $48.DOGE/USDTDogecoin (DOGE) bounced off the support zone near $0.06 on Sept. 7 but the recovery fizzled out at the 20-day EMA ($0.06). This indicates that bears are defending the moving averages aggressively.DOGE/USDT daily chart. Source: TradingViewThe price turned down from the 20-day EMA on Sept. 13 and reached the support at $0.06. The bulls are expected to defend the level aggressively as a break and close below it could sink the DOGE/USDT pair to the June low at $0.05. If this support cracks, it could signal the resumption of the downtrend.This negative view could invalidate if the price rebounds off the current level and rises above the moving averages. If that happens, the pair could attempt a rally to $0.09.Related: Ethereum’s Merge will affect more than just its blockchainDOT/USDTPolkadot (DOT) repeatedly tried to rise and sustain above the 50-day SMA ($7.90) from Sept. 9-13 but the bears held their ground. This indicates that the sentiment remains negative and bears are selling on rallies to resistance levels. DOT/USDT daily chart. Source: TradingViewThe failure to rise above the 50-day SMA may have attracted strong selling by the bears and profit-booking by the short-term bulls. That pulled the price back below the 20-day EMA ($7.43) on Sept. 13. The bears will now attempt to sink the DOT/USDT pair below the immediate support at $6.75 and challenge the crucial level at $6.Alternatively, if the price rebounds off the current level and rises above the 20-day EMA, it will suggest that bulls continue to buy on dips. The bulls will then again try to overcome the barrier at the 50-day SMA and start a rally toward $10.MATIC/USDTPolygon (MATIC) has been stuck inside a large range between $0.75 and $1.05 for the past several weeks. Both moving averages have flattened out and the relative strength index is near the midpoint, indicating a balance between buyers and sellers.MATIC/USDT daily chart. Source: TradingViewThe MATIC/USDT pair has been attempting to rise inside an ascending channel for the past few days. If the price plummets below the channel, it will signal a minor advantage to the bears. The pair could then decline to the strong support at $0.75. Contrary to this assumption, if the price rebounds off the current level and rises above the moving averages, the pair could reach the resistance line of the channel. A break and close above the channel could open the doors for a possible rally to $1.05.SHIB/USDTShiba Inu (SHIB) managed to stay above the moving averages between Sept. 9-12 but the bulls could not build upon this strength and clear the overhead hurdle at the downtrend line. This indicates a lack of demand at higher levels.SHIB/USDT daily chart. Source: TradingViewThe price plunged back below the moving averages on Sept. 13 and the bears will now attempt to pull the SHIB/USDT pair below the strong support at $0.000012. If they succeed, the pair will complete a descending triangle pattern. This bearish setup has a target objective of $0.000009.Contrary to this assumption, if the price rebounds off the current level and breaks above the moving averages, the pair could reach the downtrend line. A break and close above this level will invalidate the bearish setup and clear the path for a rally to $0.000018.The views and opinions expressed here are solely those of the author and do not necessarily reflect the views of Cointelegraph. Every investment and trading move involves risk. You should conduct your own research when making a decision.Market data is provided by HitBTC exchange.

Čítaj viac

Získaj BONUS 8 € v Bitcoinoch

nakup bitcoin z karty

Registrácia Binance

Burza Binance

Aktuálne kurzy