Autor Cointelegraph By Rakesh Upadhyay

Price analysis 9/30: SPX, DXY, BTC, ETH, BNB, XRP, ADA, SOL, DOGE, DOT

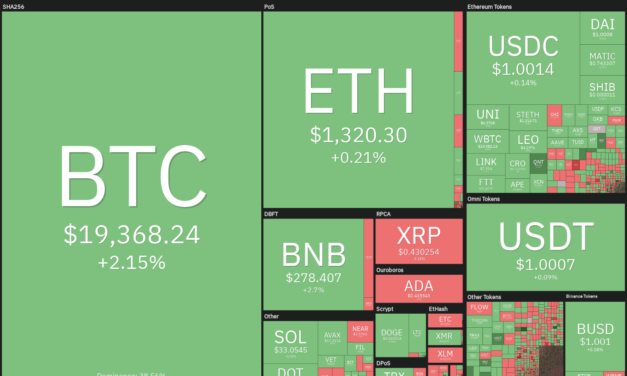
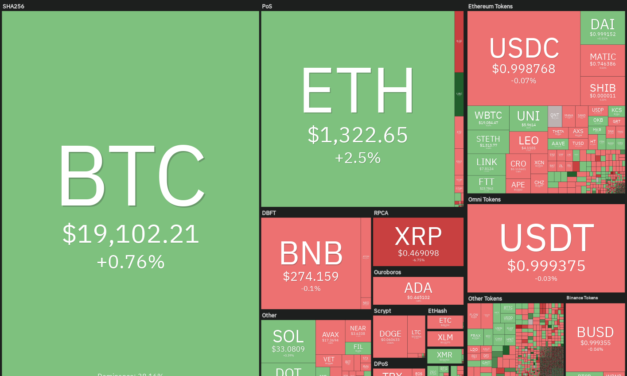
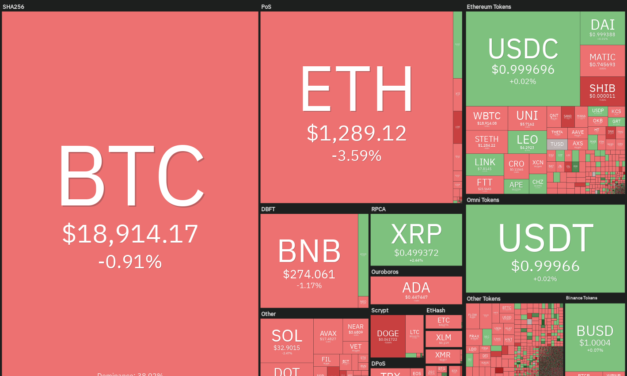
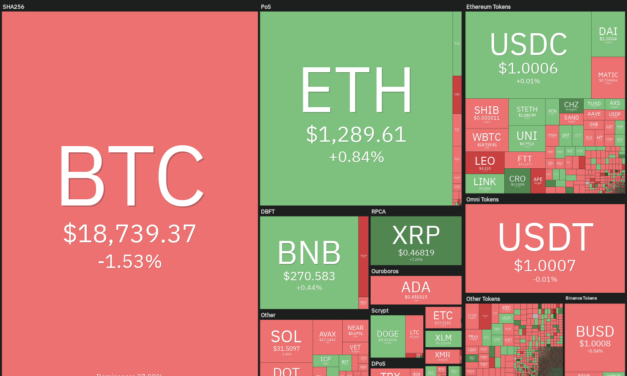
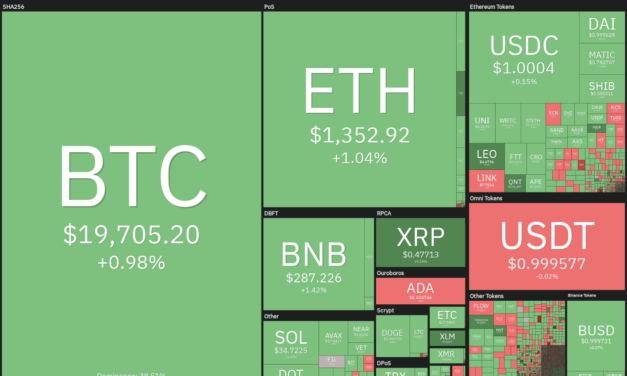
The United States equities markets have been under a firm bear grip for a large part of the year. The S&P 500 and the Nasdaq Composite have declined for three quarters in a row, a first since 2009. There was no respite in selling in September and the Dow Jones Industrial Average is on track to record its worst September since 2002. These figures outline the kind of carnage that exists in the equities market.Compared to these disappointing figures, Bitcoin (BTC) and select altcoins have not given up much ground in September. This is the first sign that selling could be drying up at lower levels and long-term investors may have started bottom fishing.Daily cryptocurrency market performance. Source: Coin360In the final quarter of the year, investors will continue to focus on the inflation data. Any indication of inflation topping could bring about a sharp recovery in risk assets, but if inflation remains stubbornly high, then a round of sell-offs could follow.Let’s study the charts of the S&P 500 index, the U.S. dollar index (DXY) and the major cryptocurrencies to determine if a recovery is on the cards.SPXThe S&P 500 index (SPX) has been under intense selling pressure for the past few days but the bulls have held their ground. This indicates that bulls are buying the dips near 3,636.SPX daily chart. Source: TradingViewThe first resistance on the upside is 3,737. If bulls thrust the price above this level, the index could rise to the 20-day exponential moving average (3,818). In a downtrend, this is the important level to keep an eye on because a break and close above it will suggest that the bears may be losing their grip. Sharp declines are usually followed by strong rallies. That could carry the index to the downtrend line and then to the 50-day simple moving average (4,012).The bears are likely to have other plans. They will try to extend the downtrend by sinking and sustaining the price below 3,636. If they manage to do that, the index could plummet to 3,500 and later to 3,325.DXYThe U.S. dollar index surged to 114.77 on Sept. 28, which pushed the relative strength index (RSI) into deeply overbought territory. This may have attracted profit-booking by the short-term traders which pulled the price near the 20-day EMA (111).DXY daily chart. Source: TradingViewThe bears will have to yank the price below the 20-day EMA to suggest that the bullish momentum could be weakening. That could clear the path for a possible drop to the 50-day SMA (108). The zone between the 50-day SMA and the uptrend line is likely to witness aggressive buying by the bulls because if they fail to defend the zone, it will indicate that the index may have topped out.On the other hand, if the price turns up from the current level or rebounds off the 20-day EMA, it will indicate that the bulls continue to buy on dips. Buyers will then again attempt to thrust the price above 114.77 and resume the uptrend. The next target objective on the upside is 118. BTC/USDTBitcoin bounced off the strong support at $18,626 on Sept. 28, indicating that the bulls continue to fiercely defend this level. The long tail on the candlestick of the past two days shows that bulls are buying the intraday dips.BTC/USDT daily chart. Source: TradingViewThe bulls pushed the price above the 20-day EMA ($19,602) on Sept. 30 but are struggling to sustain the higher levels. This shows that bears are selling near the 50-day SMA ($20,621). If bulls do not allow the price to drop below the 20-day EMA, the likelihood of a rally to the downtrend line increases. The bears are expected to mount a strong resistance at this level but if bulls clear this hurdle, the BTC/USDT pair could signal a short-term trend change. The pair could then rise to $22,799.Contrary to this assumption, if the price turns down from the current level or the 50-day SMA ($20,625), the pair could again drop to the $18,626 to $17,622 support zone.ETH/USDTEther (ETH) has been declining in a descending channel pattern for the past several days. In the short term, the price has been stuck between $1,250 and $1,410, indicating demand at lower levels but selling near the resistance.ETH/USDT daily chart. Source: TradingViewThe price action inside the range is usually random and volatile. Hence, it is difficult to predict the direction of the breakout with certainty. If the price breaks above $1,410, it will suggest that the bulls have absorbed the supply. That could propel the price to the resistance line of the channel. The bulls will have to overcome this barrier to suggest a potential trend change.On the other hand, if the price turns down and breaks below $1,250, the bears will attempt to cement their advantage by pulling the ETH/USDT pair below the channel. If they succeed, the pair could drop to $1,000.BNB/USDTBinance Coin (BNB) turned up sharply from $266 and broke above the 20-day EMA ($278) on Sept. 28. This indicates that lower levels are attracting strong buying by the bulls.BNB/USDT daily chart. Source: TradingViewThe bulls pushed the price above the resistance line of the descending channel on Sept. 29 but are facing resistance at the 50-day SMA ($288). If bulls do not allow the price to plummet back below the 20-day EMA, it will improve the prospects of a break above the 50-day SMA. The BNB/USDT pair could then rally to $300 and later to $338.On the contrary, if the price turns down and breaks below the 20-day EMA, it will suggest that bears continue to sell at higher levels. The pair could then decline to the strong support at $258.XRP/USDTXRP rebounded off the 20-day EMA ($0.43) on Sept. 28, indicating a change in sentiment from selling on rallies to buying on dips. However, the bears are unlikely to give up as they will try to stall the recovery in the $0.52 to $0.56 zone.XRP/USDT daily chart. Source: TradingViewIf buyers do not give up much ground from the current level, the possibility of a break above the overhead zone increases. A break above $0.56 will signal the resumption of the uptrend. The XRP/USDT pair could then rise to $0.66.Conversely, if the price continues lower, the pair could drop to the breakout level of $0.41. The bulls are likely to defend this level vigorously. If the price rebounds off this level, the pair may enter a range-bound action for a few days.ADA/USDT The long tail on Cardano’s (ADA) Sept. 28 and 29 candlestick shows that the bulls bought at lower levels in an attempt to defend the uptrend line. Although the price rose above the uptrend line on Sept. 29, buyers could not sustain the recovery.ADA/USDT daily chart. Source: TradingViewThe price has again tumbled below the uptrend line on Sept. 30. The downsloping moving averages and the RSI in the negative territory suggest that the path of least resistance is to the downside. If the price breaks below $0.42, the ADA/USDT pair could decline to the crucial support at $0.40. The bulls are expected to defend this level with vigor.Contrarily, if the price turns up from the current level and closes above the uptrend line, it will suggest strong buying at lower levels. The bulls will then again try to push the price above the 20-day EMA ($0.45) and challenge the resistance at the 50-day SMA ($0.47).Related: Bitcoin surges above $20K after 6% BTC rally gains steam ahead of the monthly closeSOL/USDTBuyers are attempting to form a higher low in Solana (SOL). The price rebounded off $31.65 on Sept. 28 and reached the 50-day SMA ($34.70) on Sept. 30.SOL/USDT daily chart. Source: TradingViewThe 20-day EMA ($33.30) is trying to turn up and the RSI is just above the midpoint, suggesting that the bulls are attempting a comeback. If the price breaks and sustains above the 50-day SMA, the bullish momentum could pick up and the SOL/USDT pair could rally to $39. The bears are expected to mount a strong resistance at this level.Alternatively, if the price turns down from the 50-day SMA, the pair could drop to $31.65. A break below this support could sink the pair to $30.DOGE/USDTDogecoin (DOGE) dipped below the 20-day EMA ($0.06) on Sept. 25 and the bears thwarted attempts by the bulls to resume the recovery on Sept. 27.DOGE/USDT daily chart. Source: TradingViewThe 20-day EMA is flattish and the RSI is just below the midpoint, indicating a balance between supply and demand. This balance could tilt in favor of the bears if they sink the price below the support near $0.06. The price could then plunge to $0.05.The bulls will gain the upper hand if they drive and sustain the price above the 50-day SMA ($0.06). The DOGE/USDT pair could then attempt a rally to $0.07 where the bears may again mount a stiff resistance.DOT/USDTPolkadot (DOT) has been trading in a tight range between $6 and $6.64 for the past few days. This indicates a tough battle between the bulls and the bears. DOT/USDT daily chart. Source: TradingViewThe gradually downsloping moving averages and the RSI in the negative territory suggest that bears have a slight edge. If the price drops below $6, the DOT/USDT pair could start the next leg of the downtrend. The pair could then slide to $4.To invalidate this negative bias, bulls will have to push and sustain the price above the 20-day EMA ($6.64). If they do that, it will suggest that the consolidation near the support may have been an accumulation phase. The pair could then rise to the 50-day SMA ($7.26) and later to $8.The views and opinions expressed here are solely those of the author and do not necessarily reflect the views of Cointelegraph. Every investment and trading move involves risk. You should conduct your own research when making a decision.Market data is provided by HitBTC exchange.

Čítaj viac

Price analysis 9/28: BTC, ETH, BNB, XRP, ADA, SOL, DOGE, DOT, MATIC, SHIB

The S&P 500 fell for six days in a row and made a new year-to-date low on Sept. 27, but Bitcoin (BTC) maintained its outperformance and stayed well above its June low. This could be a positive sign because markets that show strength on the way down are the ones that outperform in the event of a recovery.The United States equities markets rebounded sharply on Sept. 28 after the Bank of England announced a bond-buying program and the U.S. Treasury yields pulled back from multi-year highs. As this occurred, strong buying in Bitcoin took place, but BTC was unable to break above its overhead resistance.Daily cryptocurrency market performance. Source: Coin360A ray of hope for cryptocurrency traders is that October has historically been a strong month for Bitcoin. Barring 2014 and 2018, Bitcoin has managed a positive close in October every year since 2013, according to data from Coinglass. Although history favors a bounce in October, traders should be careful because the macroeconomic situation is unprecedented and remains a challenge.Could Bitcoin and altcoins close September on a strong note? Let’s study the charts of the top 10 cryptocurrencies to find out.BTC/USDTBitcoin soared above the 20-day exponential moving average (EMA) ($19,576) on Sept. 27 but the bulls could not sustain the higher levels. This evaporated all intraday gains. The bears pounced on this opportunity and tried to sink the price below the immediate support of $18,626 on Sept. 28 but the long tail on the day’s candlestick shows strong buying at lower levels.BTC/USDT daily chart. Source: TradingViewThe positive divergence on the relative strength index (RSI) remains intact and is pointing to a possible recovery. If the price breaks and sustains above the 20-day EMA, the likelihood of a rally to the downtrend line increases. The bears are likely to defend this level with vigor.If the price turns down from the downtrend line, the BTC/USDT pair could drop to the 20-day EMA. A bounce off this level will suggest that the sentiment could be changing from selling on rallies to buying on dips. If buyers push the price above the downtrend line, the pair could reach $22,799.To invalidate this bullish bias, the bears will have to sink the price below $18,125. The pair could then retest the June low of $17,622. A break below this support could signal the resumption of the downtrend. The pair could then decline to $14,500.ETH/USDTEther (ETH) turned down sharply from the 20-day EMA ($1,411) on Sept. 27 but rebounded off the $1,262 support on Sept. 28. This shows that bears are selling on rallies and bulls are buying on dips.ETH/USDT daily chart. Source: TradingViewThe ETH/USDT pair is currently stuck between $1,250 and $1,410. If bulls push the price above the overhead resistance, the pair could rally to the resistance line of the descending channel. The bulls will have to surmount this obstacle to suggest a potential trend change. If the price turns down from the current level or the overhead resistance and breaks below the support at $1,250, it will suggest that the selling pressure is building up. This could increase the likelihood of a break below the channel. The pair could then slide to the psychological level of $1,000.BNB/USDTThe bulls nudged BNB above the resistance line of the descending channel pattern on Sept. 27 but they could not go past the 50-day SMA ($287). This attracted heavy selling and the price slipped back below the 20-day EMA ($276).BNB/USDT daily chart. Source: TradingViewThe long tail on the Sept. 28 candlestick shows that the bulls have not given up and may make another attempt to pierce the overhead resistance at the 50-day SMA. If they can pull it off, it will suggest a potential trend change in the short term. The BNB/USDT pair could first move up to $300 and then attempt a sprint to $338.On the other hand, if the recovery turns down from the moving averages, it will suggest that the bears are active at higher levels. The pair could then retest the immediate support at $258.XRP/USDTXRP’s sharp rally to $0.56 has retraced to the breakout level of $0.41. The 61.8% Fibonacci retracement level is close to this level and the 20-day EMA ($0.41) is also nearby. Hence, buyers are likely to defend the level with all their might.XRP/USDT daily chart. Source: TradingViewIf the price rebounds off the current level, the XRP/USDT pair could attempt a rally to $0.47 and then to $0.52. The bears could offer a stiff resistance in this zone. If the price turns down from this zone, the pair could consolidate in a range for a few days.The failure to defend the breakout level of $0.41 will suggest that the recent rally may have been a bear trap. The pair could then drop to the 50-day SMA ($0.37). If this support also cracks, the pair could complete a 100% retracement and tumble to $0.32. ADA/USDT The long wick on Cardano’s (ADA) Sept. 27 candlestick shows that bears continue to sell the recovery to the 20-day EMA ($0.46). The bears are trying to cement their advantage by sustaining the price below the uptrend line.ADA/USDT daily chart. Source: TradingViewIf they manage to do that, the ADA/USDT pair could slide to the crucial support of $0.40. This is an important level for the bulls to defend because if they fail in their endeavor, the pair could resume its downtrend. The pair could then decline to $0.33.On the upside, buyers will have to push the price above the moving averages to suggest that the selling pressure could be reducing. The pair could then rise to the downtrend line. A break above this level could open the doors for a possible recovery to $0.60.SOL/USDTSolana (SOL) attempted to break above the 50-day SMA ($35) on Sept. 27 but the bears were in no mood to let go of their advantage. They sold aggressively and pulled the price back below the 20-day EMA ($33).SOL/USDT daily chart. Source: TradingViewIf the SOL/USDT pair does not give up much ground from the current level, the buyers may again attempt to push the price above the 50-day SMA. The repeated retest of a resistance level tends to weaken it and improves the prospects of a break above it. If the price rises above the 50-day SMA, the pair could rally to $39.The bears may have other plans as they will try to sink the pair to the strong support at $30. If this support collapses, the pair could retest the June low at $26.DOGE/USDTDogecoin’s (DOGE) recovery faded just above the 50-day SMA ($0.07) on Sept. 24 and the price slipped back near the strong support at $0.06 on Sept. 28.DOGE/USDT daily chart. Source: TradingViewThe 20-day EMA ($0.06) is flattening out and the RSI is just below the midpoint, suggesting a balance between supply and demand. If bears want to assert their dominance, they will have to sink and sustain the price below the immediate support near $0.06. That could result in a retest of the June low near $0.05.If bulls want to tilt the advantage in their favor in the near term, they will have to push and sustain the price above the overhead resistance at $0.07. The DOGE/USDT pair could then start its journey to $0.09.Related: Bitcoin holds $19K, but volatility expected as Friday’s $2.2B BTC options expiry approachesDOT/USDTPolkadot’s (DOT) rebound off the strong support at $6 fizzled out near the 20-day EMA ($6.68) on Sept. 27. This indicates that the bears have not given up and are selling on every minor rally.DOT/USDT daily chart. Source: TradingViewThe price is getting squeezed between the 20-day EMA and the support at $6. This uncertainty could resolve with a strong range breakout but it is difficult to predict the direction with certainty. Therefore, it is better to wait for the breakout to happen before taking directional bets.If the price plummets below $6, the DOT/USDT pair could start the next leg of the downtrend and dive to $4. On the contrary, if the price explodes above the 20-day EMA, the pair could climb to the 50-day SMA ($7.37) and then to the overhead resistance at $8.MATIC/USDTPolygon (MATIC) turned down from the 20-day EMA ($0.78) on Sept. 27, indicating that the sentiment remains negative and traders are selling on rallies to resistance levels.MATIC/USDT daily chart. Source: TradingViewThe bears will attempt to strengthen their position by pulling the price below the $0.72 to $0.69 support zone. If this zone gives way, the selling could pick up momentum and the MATIC/USDT pair could drop to $0.62. The downsloping moving averages and the RSI in the negative territory indicate a minor advantage to bears.Alternatively, if the price rebounds off the support zone, the bulls will again try to drive the pair above the 20-day EMA. If they succeed, the pair could rise to the 50-day SMA ($0.84).SHIB/USDTShiba Inu (SHIB) has been trading near the 20-day EMA ($0.000011) for the past few days, indicating that the bulls are not dumping their positions as they anticipate the price to move higher.SHIB/USDT daily chart. Source: TradingViewIf bulls propel the price above the 20-day EMA, the SHIB/USDT pair could rise to the overhead resistance at $0.000014. The bears may mount a strong resistance at this level but if bulls overcome this barrier, the pair could start its march toward $0.000018.This positive view could invalidate in the near term if the price turns down from the current level and breaks below the support at $0.000010. The pair could then drop toward the important support at $0.000007.The views and opinions expressed here are solely those of the author and do not necessarily reflect the views of Cointelegraph. Every investment and trading move involves risk. You should conduct your own research when making a decision.Market data is provided by HitBTC exchange.

Čítaj viac

Price analysis 9/26: BTC, ETH, BNB, XRP, ADA, SOL, DOGE, DOT, MATIC, SHIB

The United Kingdom is in focus following the British pound’s fall to a new all-time low against the United States dollar. The sell-off was triggered by the aggressive tax cuts announced by Prime Minister Liz Truss’s government. The 10-year gilt yields have soared by 131 basis points in September, on track for its biggest monthly increase since 1957, according to Reuters.The currency crisis and the soaring U.S dollar index (DXY) may not be good news for U.S. equities and the cryptocurrency markets. A ray of hope for Bitcoin (BTC) investors is that the pace of decline has slowed down in the past few days and the June low has not yet been re-tested. Daily cryptocurrency market performance. Source: Coin360That could be because Bitcoin’s long-term investors do not seem to be panicking. Data from on-chain analytics firm Glassnode shows that Bitcoin’s Coin Days Destroyed (CDD) metric, which gives more weightage to coins dormant for a long time, hit a new low. This indicates that coins held for the long-term “are the most dormant they have ever been.”Could Bitcoin and altcoins continue their short-term outperformance? Let’s study the charts of the top-10 cryptocurrencies to find out.BTC/USDTThe bulls continue to defend the $18,626 to $17,622 support zone with all their might. This is a positive sign as it shows that buyers are accumulating on dips to the support zone.BTC/USDT daily chart. Source: TradingViewThe price rebounded off the support zone on Sept. 26 and the bulls will attempt to push the BTC/USDT pair above the 20-day exponential moving average (EMA) ($19,653). A close above this overhead resistance will be the first indication of strength. The pair could then rise to the 50-day simple moving average (SMA) ($20,960). The bears are likely to pose a strong challenge in the zone between the 50-day SMA and $22,799. Buyers will have to thrust the price above this zone to clear the path for a possible rally to $25,211. This positive view could be invalidated if the price turns down from the moving averages and breaks below $17,622. That could signal the start of the next leg of the downtrend.ETH/USDTEther (ETH) has been trading inside a tight range of $1,262 and $1,360 for the past three days. This suggests indecision among the bulls and the bears.ETH/USDT daily chart. Source: TradingViewIf bulls thrust the price above $1,360, the ETH/USDT pair could rally to the 20-day EMA ($1,430). This is an important level to watch out for because a break above it will suggest that the bears may be losing their grip. The pair could then rally to the resistance line of the descending channel.Contrarily, if the price turns down from $1,360 or the 20-day EMA, it will suggest that the sentiment remains negative and traders are selling on rallies. The bears will then again try to sink the price to the support line of the channel.BNB/USDTBuyers pushed BNB above the 20-day EMA ($276) on Sept. 24 and 25 but they could not sustain the higher levels. The price formed a Doji candlestick pattern on Sept. 25, indicating that traders are undecided about the next move.BNB/USDT daily chart. Source: TradingViewHowever, as the price has been trading close to the 20-day EMA for the past few days, it improves the prospects of a rally to the resistance line of the descending channel. This level may witness aggressive selling by the bears but if bulls do not allow the price to break below the 20-day EMA, the BNB/USDT could break above the 50-day SMA ($289). Such a move could suggest a potential trend change in the near term.If the price turns down from the 20-day EMA or the resistance line of the channel, the bears will try to pull the pair to the strong support at $258.XRP/USDTXRP surged to $0.56 on Sept. 23 when profit-booking set in. The bulls tried to resume the up-move on Sept. 25 but the long wick on the candlestick shows selling on intraday rallies.XRP/USDT daily chart. Source: TradingViewThe XRP/USDT pair could next drop to the 50% Fibonacci retracement level of $0.44. If the price rebounds off this level, the bulls will make one more attempt to push the price above $0.56 and resume the up-move to $0.66.Conversely, if the price breaks below $0.44, the pair could drop to the breakout level of $0.41. The 61.8% Fibonacci retracement level is also near $0.41; hence, the bulls are likely to defend this support aggressively. ADA/USDT ADA soared above the 20-day EMA ($0.46) on Sept. 23 but the bulls could not pierce the 50-day SMA ($0.48). The long wick on the day’s candlestick suggests that bears are active at higher levels.ADA/USDT daily chart. Source: TradingViewBuyers again tried to push the price back above the 20-day EMA on Sept. 24 and 25 but the bears held their ground. That has pulled the price to the uptrend line. This is an important level for the bulls to defend because if they fail to do that, the ADA/USDT pair could slump to the vital support at $0.40.Conversely, if the price rebounds off the uptrend line, the bulls will again try to drive the pair above the downtrend line. If they manage to do that, the pair could jump to $0.52.SOL/USDTSolana (SOL) broke and closed above the 20-day EMA ($33) on Sept. 23 but the bulls could not build upon this strength. The failure to push the price above the 50-day SMA ($35) attracted selling on Sept. 24. That pulled the price back below the 20-day EMA on Sept. 25.SOL/USDT daily chart. Source: TradingViewThe bulls have not yet given up and are trying to push the price back above the 20-day EMA. If they succeed, the SOL/USDT pair could rally to the 50-day SMA. The bulls will have to surpass this obstacle to set the stage for a possible rally to $39.Contrary to this assumption, if the price turns down from the moving averages, it will suggest that bears are in no mood to relent. That could heighten the risk of a break below $30. If that happens, the pair could retest the important support at $26.DOGE/USDTDogecoin (DOGE) broke and closed above the 20-day EMA ($0.06) on Sept. 23, which is the first sign that the selling pressure could be reducing. DOGE/USDT daily chart. Source: TradingViewBuyers maintained their momentum and propelled the price above the 50-day SMA ($0.07) on Sept. 24 but could not sustain the higher levels. This shows that the bears have not yet given up and are selling on rallies.The price dipped back to the 20-day EMA on Sept. 25 but a minor positive is that the bulls are trying to defend this level. If bulls flip this level into support, the pair could rally to $0.08. Alternatively, if the price continues lower and breaks below the strong support, the DOGE/USDT pair could retest the June low at $0.05.Related: Cardano bulls run out of steam after Vasil hard fork — 40% ADA price crash in playDOT/USDTPolkadot (DOT) once again bounced off the critical support at $6 on Sept. 26, suggesting that bulls are defending this level aggressively. The price could jump to the 20-day EMA ($6.74) where the bears will try to stall the recovery.DOT/USDT daily chart. Source: TradingViewIf the price turns down from the 20-day EMA, it will increase the likelihood of a break below the support at $6. If that happens, the selling could pick up momentum and the DOT/USDT pair could resume the downtrend. The pair could then slide to $4.If bulls want to prevent this fall, they will have to quickly push and sustain the price above the 20-day EMA. The pair could then rally to the overhead resistance zone between the 50-day SMA ($7.48) and $8. A break and close above the zone could open the doors for a possible rally to $9.17 and then $10. MATIC/USDTPolygon’s (MATIC) relief rally stalled near the 20-day EMA ($0.79) on Sept. 23, indicating that bears continue to sell on minor rallies. The price has dipped to the strong support at $0.72 where buyers are likely to step in to arrest the decline.MATIC/USDT daily chart. Source: TradingViewA strong bounce off the current level will suggest accumulation near $0.72. The bulls will then make another attempt to drive the price above the 20-day EMA. If they can pull it off, the MATIC/USDT pair could climb to the 50-day SMA ($0.84) and then to $0.94.Instead, if the price turns down and breaks below the $0.72 to $0.69 support zone, it will indicate that the $0.72 to $1.05 range has resolved to the downside. That could pull the pair down to $0.62 and after that to $0.52.SHIB/USDTThe bulls propelled Shiba Inu (SHIB) above the 20-day EMA ($0.000011) on Sept. 24 but the long wick on the candlestick shows that bears continue to sell at higher levels.SHIB/USDT daily chart. Source: TradingViewThe bears will attempt to sink the price to the immediate support at $0.000010. This level has acted as strong support previously; hence, the bulls are likely to defend it with vigor. Buyers will have to push the price above the moving averages to suggest that the selling pressure could be reducing. The SHIB/USDT pair could then rise to $0.000014 where the bears may again mount a strong resistance. If bulls overcome this barrier, the pair could rise to $0.000018.On the downside, a break below $0.000010 could intensify selling and the pair could slide to the crucial support at $0.000007.The views and opinions expressed here are solely those of the author and do not necessarily reflect the views of Cointelegraph. Every investment and trading move involves risk. You should conduct your own research when making a decision.Market data is provided by HitBTC exchange.

Čítaj viac

5 altcoins that could turn bullish if Bitcoin price stabilizes

The major United States stock market indices continued their decline last week as worsening macroeconomic conditions increased concerns of a global recession. The Dow Jones Industrial Average closed at its lowest level in 2022 and major indices recorded their fifth weekly close in the past six weeks.Although Bitcoin (BTC) has only declined marginally this week, it risks closing at the lowest level since 2020. While a new multi-year weekly close is a negative sign, sellers will have to sustain the lower levels or else it may turn out to be a bear trap. The price action of the next few days is likely to witness heightened volatility as both the bulls and the bears battle it out for supremacy.Crypto market data daily view. Source: Coin360Several investors miss opportunities to buy during sharp corrections because they try to catch the bottom. Traders should rather focus on the projects they like and accumulate the coins in a phased manner lasting a few weeks or months. All coins do not bottom at the same time, hence it is better to focus on individual cryptocurrencies that show strength.While Bitcoin is nearing its yearly lows, certain altcoins are holding up well. Let’s look at the charts of five cryptocurrencies that look interesting in the near term.BTC/USDTThe Bitcoin bulls have successfully defended the $18,626 to $17,622 support zone in the past few days but they continue to face strong selling at the 20-day exponential moving average ($19,720). This suggests that bears continue to sell on minor rallies.BTC/USDT daily chart. Source: TradingViewThe downsloping moving averages indicate that bears have the upper hand but the positive divergence on the relative strength index (RSI) suggests that the bearish momentum could be weakening.A break and close above the 20-day EMA will be the first sign that the bears may be losing their grip. The BTC/USDT pair could then rise to the 50-day simple moving average ($21,043) and later to $22,799. Buyers will have to overcome this barrier to set the stage for a rally to $25,211. Conversely, if bears sink the price below the June low of $17,622, the selling could intensify and the pair may resume its downtrend. The pair could then plummet to $14,500.BTC/USDT 4-hour chart. Source: TradingViewThe bulls are buying the dip below $18,626 but the bears continue to stall the recovery at the 50-SMA. This has squeezed the price between these two levels but this tight range trading is unlikely to continue for long.If the price turns down and sustains below $18,626, the bears may pull the pair to the vital support at $17,622. This level may again witness a strong battle between the bulls and the bears. On the upside, if bulls thrust the price above the 50-SMA, the pair could rise to $20,400. ATOM/USDTCosmos (ATOM) has been trading above the breakout level of $13.46 for the past several days, indicating that the sentiment remains positive and traders are buying on dips. ATOM/USDT daily chart. Source: TradingViewThe 20-day EMA ($14.22) has flattened out and the RSI is near the midpoint, indicating a balance between supply and demand. If the price breaks above $15.26, the short-term advantage could tilt in favor of the buyers. The ATOM/USDT pair could then rise to $17.20. This level may again act as a resistance but if buyers thrust the price above it, the pair could pick up momentum and rise to $20.34 and later to $25.Contrary to this assumption, if the price turns down and breaks below the 50-day SMA ($12.90), the advantage could tilt in favor of the bears. The pair could then decline to $10.ATOM/USDT 4-hour chart. Source: TradingViewThe pair has been stuck between $13.45 and $17 for some time. Buyers aggressively defended the support at $13.45 and are attempting to push the price above the 50-SMA. If they do that, the likelihood of a rally to $16 and thereafter to $17 increases.Conversely, if the price turns down from the current level and breaks below the 20-EMA, it will suggest that bears continue to sell on rallies. That could pull the price to the strong support at $13.45. The sellers will have to sink the pair below $13 to clear the path for a possible drop to $11.50.ALGO/USDTThe uncertainty of the range-bound action between $0.27 and $0.38 resolved to the upside on Sept. 23, indicating the start of a new up-move. If that happens, Algorand (ALGO) could still be in its first leg of the uptrend.ALGO/USDT daily chart. Source: TradingViewThe important level to watch on the downside is $0.38. If bulls flip this level into support, it could increase the likelihood of the start of a new uptrend. The ALGO/USDT pair could then rally to $0.45 and later to $0.50.This bullish view could invalidate in the near term if the price slips below $0.38 and re-enters the range. That could sink the price to the 20-day EMA ($0.33). If the price rebounds off this level, the bulls will again try to clear the overhead resistance.ALGO/USDT 4-hour chart. Source: TradingViewThe price rose above the overhead resistance at $0.38 but the bulls could not build upon this momentum. This shows that the bears have not yet given up and they continue to sell on rallies near $0.41.If bears pull the price below the 20-EMA, the pair could drop to $0.36. This is an important level for the bulls to defend because a break below it could open the doors for a possible drop to the 50-SMA.On the upside, the bulls will have to push the price above $0.41 to signal the resumption of the up-move.Related: What is scalping in crypto, and how does scalp trading work?CHZ/USDTChiliz (CHZ) recovered sharply from its June lows and the bulls cleared the overhead resistance at $0.26 on Sept. 22, signaling the resumption of the up-move. When a coin moves against the market sentiment, it warrants a close look.CHZ/USDT daily chart. Source: TradingViewThe bears have been trying to sink the price below the breakout level of $0.26 for the past three days but the bulls have held their ground. This shows that bulls are viewing the dips as a buying opportunity. The rising moving averages and the RSI in the positive territory indicate that buyers are in command.If the price turns up and breaks above $0.28, the CHZ/USDT pair could rally to the next stiff resistance at $0.33.Conversely, if the price turns down and breaks below $0.26, it will suggest that traders may be rushing to the exit. The pair could first drop to the 20-day EMA ($0.23) and later to the 50-day SMA ($0.21).CHZ/USDT 4-hour chart. Source: TradingViewBoth moving averages are sloping up indicating advantage to buyers but the negative divergence on the RSI shows that the bullish momentum may be weakening. If bears sink the price below $0.26, the pair could drop to the 50-SMA. This is a key level for the bulls to defend because if it gives way, the pair could drop to $0.22.On the other hand, if the price rebounds off $0.26 and rises above $0.28, the up-move could resume. The pair could then rally to $0.32.QNT/USDTQuant (QNT) is showing strength as it is trading above both moving averages. Even when the sentiment across the cryptocurrency sector has been negative, it has managed to charge higher.QNT/USDT daily chart. Source: TradingViewThe bears had been defending the $112 level for the past many days but the bulls pierced through the resistance on Sept. 24 and pushed the price to the downtrend line. The long wick on the day’s candlestick shows that the bears are trying to stall the up-move at this level.A minor positive is that the bulls bought the dip to $112 on Sept. 25, suggesting that buyers are trying to flip this level into support. The QNT/USDT pair could once again rise to the downtrend line. If this hurdle is cleared, the pair could soar to $133 and later to $154.Alternatively, if the price turns down and breaks below $112, the next stop could be the 20-day EMA ($106). A break below this support could pull the pair to $95.QNT/USDT 4-hour chart. Source: TradingViewThe pair picked up momentum after breaking above $112 and reached near the downtrend line. This pushed the RSI into the overbought territory, which may have tempted the short-term traders to book profits.The price rebounded off $112, indicating that the sentiment remains positive and traders are buying on dips. The pair could rise to $121 and thereafter to the downtrend line. On the downside, a break below $112 could sink the pair to the 50-SMA and thereafter to $95.The views and opinions expressed here are solely those of the author and do not necessarily reflect the views of Cointelegraph. Every investment and trading move involves risk, you should conduct your own research when making a decision.

Čítaj viac

Price analysis 9/23: SPX, DXY, BTC, ETH, BNB, XRP, ADA, SOL, DOGE, DOT

The S&P 500 index has declined about 5% this week while the Nasdaq Composite is down more than 5.5%. Investors fear that the Federal Reserve’s aggressive rate hikes could cause an economic downturn. The yield curve between the two-year and 10-year Treasury notes, which is watched closely by analysts for predicting a recession, has inverted the most since the year 2000. Among all the mayhem, it is encouraging to see that Bitcoin (BTC) has outperformed both the major indexes and has fallen less than 4% in the week. Could this be a sign that Bitcoin’s bottom may be close by?Daily cryptocurrency market performance. Source: Coin360On-chain data shows that the amount of Bitcoin supply held by long-term holders in losses reached about 30%, which is 2% to 5% below the level that coincided with Bitcoin’s bottom in March 2020 and December 2018. This metric suggests that Bitcoin could have more room to fall before it bottoms out. Let’s study the charts of the S&P 500 index, the U.S. dollar index (DXY) and the major cryptocurrencies to determine whether the trend will continue or if a reversal is likely.SPXThe S&P 500 index (SPX) broke below the 3,900 support on Sept. 16 and the bears successfully defended the level on retests on Sept. 17 and 21. Hence, this becomes an important level to keep an eye on as a break above 3,900 will be the first sign that bulls are on a comeback. SPX daily chart. Source: TradingViewThe downsloping 20-day exponential moving average (EMA) (3,920) indicates an advantage to bears but the relative strength index (RSI) in the oversold territory suggests that the index may attempt a rebound from the strong support zone between 3,715 and 3,636.A weak rebound off this zone will indicate a lack of aggressive buying by the bulls. That could increase the possibility of a decline below the crucial June low at 3,636. If this support collapses, the index could plunge toward 3,325.On the contrary, a strong rebound off the support zone could result in a recovery to 3,900. A break above this resistance could signal a potential trend change in the near term.DXYThe U.S. dollar index (DXY) has been in a strong uptrend for the past few months. Every dip is being purchased aggressively and the index continues to scale new heights. Attempts by the bears to force a trend change failed when the price rebounded off the 50-day simple moving average (SMA) ($108) on Sept. 13.DXY daily chart. Source: TradingViewAfter staying in a tight range for a few days, the index broke out to a new 52-week high on Sept. 21. This resumed the uptrend and the index could next attempt a rally to 115.The sharp rally of the past few days has pushed the RSI into the overbought zone, which suggests a minor consolidation or correction is possible in the next few days.The 20-day EMA (109) is an important support to watch for on the downside because a break below it could sink the price to the 50-day SMA. The bears will have to pull the price below 107 to indicate a possible trend change in the near term.BTC/USDTBuyers have been buying the dip below $18,626 in Bitcoin but the failure to push the price above the 20-day EMA ($19,841) shows that bears are in no mood to let go of their advantage. This increases the possibility of a retest of the vital June low at $17,622.BTC/USDT daily chart. Source: TradingViewA break and close below $17,622 could create panic and the BTC/USDT pair may plummet to the next major support at $14,500.While the downsloping moving averages indicate advantage to bears, the positive divergence on the RSI suggests that the selling pressure could be reducing. This view could strengthen if bulls drive and sustain the price above the 20-day EMA. That could push the price toward the overhead resistance zone between the 50-day SMA (21,200) and $22,799. Such a move will suggest that the pair may continue its bottoming formation inside the large range between $17,622 and $25,211 for longer.ETH/USDTEther (ETH) has been trading inside a descending channel pattern for the past few days. In a channel, traders usually buy near the support and sell close to the resistance.ETH/USDT daily chart. Source: TradingViewThe bears tried to sink the price below the channel on Sept. 21 but the bulls defended the level successfully. The bulls will try to push the price to the 20-day EMA ($1,467) where they may face stiff resistance from the bears.If the price turns down from the current level or the 20-day EMA, it will suggest that the sentiment remains negative and traders are selling on every minor rally. The bears will then again try to pull the price below the channel and challenge the psychological support at $1,000.Contrarily, if the price rises above the 20-day EMA, the pair could reach the resistance line of the channel. A break and close above the channel could suggest a potential trend change.BNB/USDTBNB has been oscillating between the 20-day EMA ($276) and $258 for the past few days. This shows that the bulls are defending the immediate support at $258 but they have failed to push the price above the 20-day EMA.BNB/USDT daily chart. Source: TradingViewThis tight-range trading is unlikely to continue for long. If buyers propel the price above the 20-day EMA, the BNB/USDT pair could rise to the resistance line of the descending channel. The bulls will have to overcome this obstacle to suggest that the corrective phase may be over. The pair could then attempt a rally to $338.If the price turns down from the current level or the resistance line of the channel, the bears will again try to sink the pair below $258. If they manage to do that, the pair could decline to the support line.XRP/USDTXRP broke above the $0.41 overhead resistance on Sept. 20. The bears tried to trap the aggressive bulls on Sept. 21 but the buyers had other plans. They purchased the dip with vigor and thrust the price above the overhead resistance on Sept. 22.XRP/USDT daily chart. Source: TradingViewThe pattern target of the break from the $0.30 to $0.41 range was $0.52 and the same was reached on Sept. 23. This sharp move pushed the RSI into the overbought territory, suggesting a minor correction or consolidation in the near term. The long wick on the Sept. 23 candlestick shows profit-booking at higher levels.Usually, after the breakout from a range, the price tends to retest the breakout level. In this case, the price could drop to $0.41. If bulls flip this level into support, the XRP/USDT will try to resume the up-move. If the price rises above $0.56, the next stop could be $0.66. On the other hand, a break below $0.41 could suggest that the recent breakout was a bear trap.ADA/USDT Cardano (ADA) bounced off the uptrend line on Sept. 22, indicating that bulls are defending this level with vigor. The price reached near the downtrend line on Sept. 23 but the long wick on the candlestick shows that bears are active at higher levels.ADA/USDT daily chart. Source: TradingViewThe 20-day EMA ($0.46) has started to turn down and the RSI is just below the midpoint, indicating a minor advantage to bears. If the price continues lower and plummets below the uptrend line, the ADA/USDT pair could drop to $0.40. This is an important level for the bulls to defend because a break below it could resume the downtrend.If bulls want to gain the upper hand, they will have to drive and sustain the price above the downtrend line. The pair could then rise to $0.60 where the bears may again mount a stiff resistance.Related: XRP hits 13-month high versus Bitcoin with 35% daily surge — But is a correction inevitable?SOL/USDTSolana (SOL) has been getting squeezed between the 20-day EMA ($33) and the immediate support at $30. This indicates a state of equilibrium between buyers and sellers.SOL/USDT daily chart. Source: TradingViewThis uncertainty is unlikely to continue for long. The bears will try to seize control by pulling the price below $30. If that happens, the SOL/USDT pair could drop to the strong support at $26. The bulls are expected to defend this level aggressively because if this support cracks, the SOL/USDT pair could witness panic selling and drop toward $20.To invalidate this negative view in the short term, buyers will have to drive the price above the moving averages and the overhead resistance at $39. If they succeed, the pair could rally to $48.DOGE/USDTBuyers bought the dip below the immediate support on Sept. 21 but they are struggling to sustain Dogecoin (DOGE) above the 20-day EMA ($0.06) on Sept. 23. This suggests that bears continue to sell on rallies.DOGE/USDT daily chart. Source: TradingViewThe bears will attempt to increase their advantage by sinking the price below the immediate support near $0.06. If they do that, the DOGE/USDT pair could extend its decline to the June low at $0.05. This is a pivotal level because a break below it could indicate the start of the next leg of the downtrend.Conversely, if the price sustains above the 20-day EMA, the pair could rise to the 50-day SMA ($0.07). If bulls pierce this resistance, the pair could rally toward $0.09.DOT/USDTBuyers successfully defended the critical support of $6 on sept. 21 and 22 but the shallow bounce suggests that demand dries up at higher levels. The longer Polkadot (DOT) trades below the 20-day EMA (6.87), the greater the possibility of a break below $6.DOT/USDT daily chart. Source: TradingViewIf bears sink and sustain the price below $6, the selling momentum could pick up and the DOT/USDT pair could resume its downtrend. The next major support on the downside is at $4.Alternatively, if the price rebounds off $6 or turns up sharply after breaking below the support, it will suggest that bulls continue to buy at lower levels. The bulls will have to propel the price above the moving averages to clear the path for a possible up-move to $10, which is again likely to act as a barrier.The views and opinions expressed here are solely those of the author and do not necessarily reflect the views of Cointelegraph. Every investment and trading move involves risk. You should conduct your own research when making a decision.Market data is provided by HitBTC exchange.

Čítaj viac

Získaj BONUS 8 € v Bitcoinoch

nakup bitcoin z karty

Registrácia Binance

Burza Binance

Aktuálne kurzy