Autor Cointelegraph By Rakesh Upadhyay

Price analysis 11/25: BTC, ETH, BNB, XRP, ADA, DOGE, MATIC, DOT, LTC, UNI

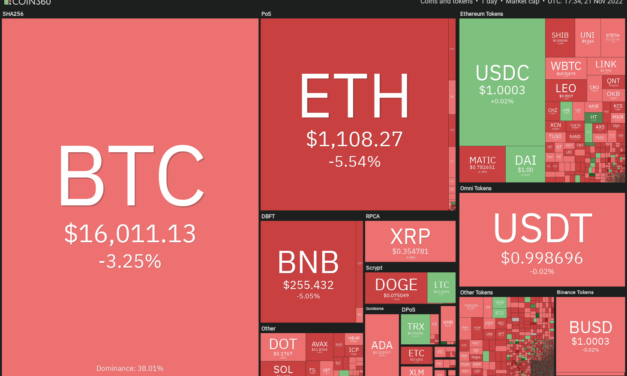
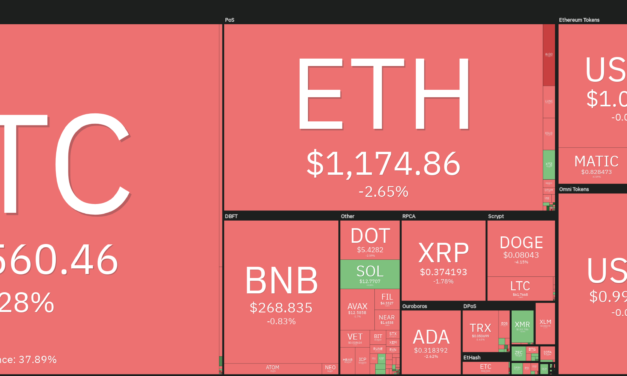
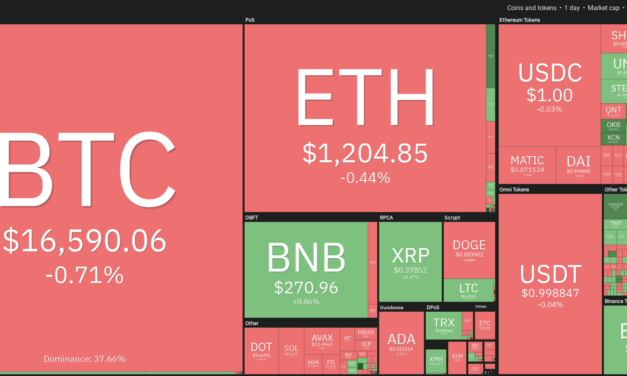
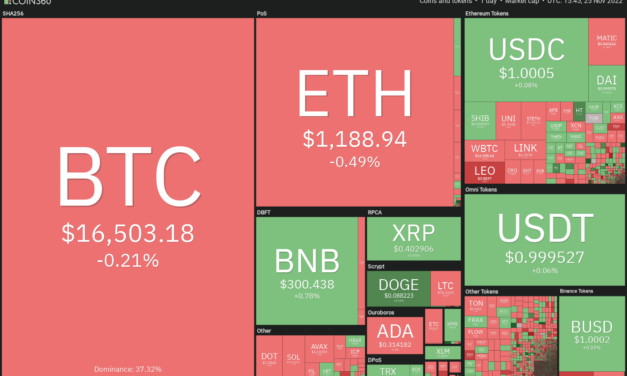
FTX’s collapse dealt a major blow to the already fragile sentiment among cryptocurrency investors. Although a quick recovery is unlikely, Blockchain analysis firm Chainalysis said that the crypto universe could emerge stronger from this crisis. Chainalysis’ research lead Eric Jardine arrived at the conclusion after comparing FTX’s fall to that of Mt. Gox.Another calming statement came from Bloomberg Intelligence exchange-traded fund analyst James Seyffart, who said that there was a “99.9% chance” that the Grayscale Bitcoin Trust (GBTC) held the Bitcoin (BTC) it claimed. He added that GBTC was “unlikely” to be liquidated.Daily cryptocurrency market performance. Source: Coin360The negative events of the past few days do not seem to have scared away the small investors who remain on an accumulating spree. According to blockchain analytics company Glassnode, the number of wallets holding at least one Bitcoin or more soared in November and reached 950,000.Could Bitcoin and altcoins extend their recovery in the near term? Let’s study the charts of the top-10 cryptocurrencies to find out.BTC/USDTBitcoin rebounded off $15,476 on Nov. 21, indicating that lower levels are attracting buying by the aggressive bulls. The relative strength index (RSI) has formed a bullish divergence, suggesting that the bears may be losing their grip.BTC/USDT daily chart. Source: TradingViewBuyers will try to push the price above the overhead resistance zone between the 20-day exponential moving average ($17,186) and $17,622. If they manage to do that, the BTC/USDT pair could indicate a possible change in trend. The pair could then rise to the 50-day simple moving average ($18,718) and thereafter challenge the psychological level of $20,000.Contrary to this assumption, if the price turns down from the current level or the overhead resistance, it will suggest that bears remain sellers on relief rallies. The bears will then again attempt to sink the pair below $15,588 and resume the downtrend. The next support on the downside is at $12,200.ETH/USDTEther (ETH) rebounded off the strong support near $1,073 on Nov. 22 and broke above the downtrend line on Nov. 24. This suggests that the bulls are attempting a comeback.ETH/USDT daily chart. Source: TradingViewThe ETH/USDT pair could next rise to the 20-day EMA ($1,248), which is an important level to watch out for. If buyers overcome this barrier, the pair could attempt a rally to the resistance line of the descending channel pattern. On the other hand, if the price turns down from the 20-day EMA, it will suggest that the sentiment remains negative and traders are selling on rallies. The bears will then endeavor to pull the price to the support line of the channel. If this support cracks, the pair could plunge to the critical support zone between $1,000 and $881.BNB/USDTBNB (BNB) broke below the strong support of $258 on Nov. 21 but this proved to be a bear trap. The price turned up on Nov. 22 and the momentum picked up further on Nov. 23. This drove the price to the overhead resistance at $300.BNB/USDT daily chart. Source: TradingViewThe bulls and the bears are witnessing a tough battle at $300 as seen from the Doji candlestick pattern formed on Nov. 24 and 25. If bulls come out on top, the BNB/USDT pair could climb to $338 where the bears may again mount a strong defense.On the contrary, if the price turns down from the current level and breaks below the moving averages, it will suggest that the pair may remain range-bound between $258 and $300 for a few more days.XRP/USDTXRP (XRP) turned up from $0.34 on Nov. 21 and shot up above the symmetrical triangle and the 20-day EMA ($0.40) on Nov. 24. This showed that the uncertainty between the buyers and sellers resolved in favor of the bulls.XRP/USDT daily chart. Source: TradingViewThe buyers are trying to build upon the advantage by pushing the price above the overhead resistance at $0.41. If they succeed, the XRP/USDT pair could pick up momentum and rise to $0.50 and then to $0.56.However, the bears are likely to have other plans. They will try to stall the recovery at $0.41 and pull the price back into the triangle. If that happens, the aggressive bulls may get trapped and the pair could then plummet to the support line.ADA/USDT Cardano (ADA) is in a strong downtrend. The bulls purchased the dip below $0.30 on Nov. 22 but are struggling to push the price to the 20-day EMA ($0.33).ADA/USDT daily chart. Source: TradingViewThe downsloping moving averages indicate that bears have the upper hand but the RSI is forming a bullish divergence, which suggests that the selling pressure may be reducing. The first sign of strength will be a break above the 20-day EMA. The ADA/USDT pair could then attempt a rally to the 50-day SMA ($0.36) and subsequently to the downtrend line.Instead, if the price turns down from the current level or the 20-day EMA, the pair could extend its downtrend and drop to the support line.DOGE/USDTDogecoin (DOGE) rebounded off the support at $0.07 on Nov. 21, indicating that the bulls are trying to establish a higher low at this level.DOGE/USDT daily chart. Source: TradingViewThe relief rally has reached $0.09 where the bulls are likely to encounter strong resistance from the bears. If the price turns down from the current level, the DOGE/USDT pair could remain range-bound between $0.07 and $0.09 for some time.Contrarily, if buyers propel the price above the overhead resistance, the bullish momentum could pick up and the pair may start a rally to the 38.2% Fibonacci retracement level of $0.10 and then to the 50% retracement level of $0.11.MATIC/USDTPolygon (MATIC) rebounded off the uptrend line on Nov. 21 but the relief rally turned down from the moving averages on Nov. 24. This suggests that the bears are active at higher levels.MATIC/USDT daily chart. Source: TradingViewThe sellers may once again attempt to sink the price below the uptrend line. If they manage to do that, the MATIC/USDT pair could drop to the important support at $0.69. The bulls are expected to vigorously defend this level because if it cracks, the pair could start a new down move and drop to $0.52.Conversely, if the price turns up and rises above the moving averages, the short-term advantage could tilt in favor of the bulls. The pair could then rally to $0.97 and later to $1.05. Related: Will Bitcoin hit $110K in 2023? 3 reasons to be bullish on BTC nowDOT/USDTPolkadot’s (DOT) rebound off $5 is facing resistance near the 20-day EMA ($5.69). This suggests that bears continue to view the rallies as a selling opportunity.DOT/USDT daily chart. Source: TradingViewIf the price turns down from this level, the bears will try to pull the DOT/USDT pair to the crucial support at $5. A break and close below this level will indicate the resumption of the downtrend. The pair could then decline to $4.32.To invalidate this negative view, the bulls will have to push and sustain the price above the moving averages. If they can pull it off, it will suggest that the downtrend could be ending. The pair could then rally to $7.43.LTC/USDTLitecoin (LTC) surged and closed above the overhead resistance of $75 on Nov. 23 but the bulls could not build upon the breakout. The bears are attempting to pull the price back below $75 on Nov. 25.LTC/USDT daily chart. Source: TradingViewIf they succeed, the LTC/USDT pair could drop to the 20-day EMA ($65). This is an important level to keep an eye on because a strong bounce off it will suggest a change in sentiment from selling on rallies to buying on dips. The bulls will then strive to push the price above $84 and open the doors for a possible rally to $104.Alternatively, if bears pull the price below the 20-day EMA, it will indicate that higher levels continue to attract sellers. The pair could then drop to the 50-day SMA ($58).UNI/USDTUniswap (UNI) has formed a large symmetrical triangle pattern, suggesting indecision among the bulls and the bears. The price rebounded off the support line of the triangle on Nov. 22, indicating buying at lower levels.UNI/USDT daily chart. Source: TradingViewThe recovery attempt could face resistance at the moving averages. If the price turns down from it, the bears will again try to sink the UNI/USDT pair below the triangle. If that happens, the pair could drop to $3.33.Contrary to this assumption, if bulls drive the price above the moving averages, the pair could climb to the resistance line of the triangle. This level could act as a major hurdle but if bulls overcome it, the pair could rise to $8 and thereafter attempt a rally to $10.The views and opinions expressed here are solely those of the author and do not necessarily reflect the views of Cointelegraph. Every investment and trading move involves risk. You should conduct your own research when making a decision.Market data is provided by HitBTC exchange.

Čítaj viac

Price analysis 11/21: SPX, DXY, BTC, ETH, BNB, XRP, ADA, DOGE, MATIC, DOT

Continued selling in the cryptocurrency markets pulled the total market capitalization below $800 billion on Nov. 21. Traders are increasingly nervous about the extent of damage FTX’s collapse may have on several crypto firms. Until the uncertainty clears, it is futile to expect a sustained recovery in cryptocurrency prices.The FTX saga has broken the close correlation between the United States equities markets and Bitcoin (BTC). While Bitcoin is trading close to its 52-week low, the S&P 500 (SPX) has recovered sharply from its low made on Oct. 13. Daily cryptocurrency market performance. Source: Coin360The U.S. dollar index (DXY) is usually inversely correlated to Bitcoin but its recent drop from the multi-year high did not benefit Bitcoin. This suggests that crypto buyers remain on the sidelines and are not venturing in to buy. However, Billionaire investor and hedge fund manager Bill Ackman said in a Twitter thread on Nov. 20 that crypto was “here to stay with proper oversight and regulation.”He also highlighted the potential of cryptocurrencies to “greatly benefit society and grow the global economy.”Could the cryptocurrency market catch up with the U.S. stock markets? Let’s study the charts of the S&P 500 index, the U.S. dollar index (DXY) and the major cryptocurrencies to find out.SPXThe S&P 500 index has been in a strong recovery since bottoming out at 3,491 on Oct. 13. Although the 4,000 level has been acting as a resistance in the past few days, a positive sign is that the bulls have not given up much ground. SPX daily chart. Source: TradingViewThe rising 20-day exponential moving average (3,879) and the relative strength index (RSI) in the positive territory indicate advantage to buyers. If bulls push the price above 4,029, the up-move could reach the downtrend line.The bears have successfully halted previous relief rallies near the downtrend line hence they will try to do the same again. If the price turns down from the downtrend line but does not slip below the 20-day EMA, it will suggest that bulls are buying on dips. That could increase the likelihood of a break above the downtrend line.The first sign of weakness will be a break and close below the 20-day EMA. The index could then decline to the 50-day simple moving average (3,786).DXYThe U.S. dollar index plunged below the uptrend line on Nov. 10. This is the first indication that the index may have topped out in the near term. DXY daily chart. Source: TradingViewThe index rebounded off the support near 105, indicating strong buying on dips. The 20-day EMA (108) is sloping down and the RSI is in the negative territory, suggesting that bears have an edge in the short term.If the relief rally stalls near the 20-day EMA, the bears will make another attempt to pull the index below 105. If they succeed, the next stop could be 103.50 and then 102.Alternatively, if buyers drive the price above the 20-day EMA, the index could rise to the uptrend line. The bulls will have to push the price back above this level to indicate that the corrective phase may be over.BTC/USDTBitcoin remains in a downtrend. The bears pulled the price below the immediate support of $16,229 on Nov. 21, which suggests a lack of demand from the bulls.BTC/USDT daily chart. Source: TradingViewIf the price sustains below $16,229, the BTC/USDT pair could retest the vital support at $15,588. This is an important level to keep an eye on because a break and close below it could signal the start of the next leg of the downtrend. The pair could then start its downward journey toward $12,200.On the contrary, if the price turns up and breaks back above $16,229, it will suggest that the bulls are buying the dips below $16,000. The bulls will then attempt to push the price toward the overhead resistance at $17,190.ETH/USDTEther (ETH) continues to gradually slide toward the support line of the descending channel pattern. This is an important level for the bulls to defend because a break below the channel could intensify selling.ETH/USDT daily chart. Source: TradingViewThe ETH/USDT pair could then drop to the psychological level of $1,000 and thereafter to the vital support at $881. The downsloping 20-day EMA ($1,381) and the RSI in the negative territory indicate that bears are in control.Contrary to this assumption, if the price rebounds off the support line with strength, it will suggest that buyers are defending the level with all their might. They will then try to clear the moving averages and open the doors for a possible rally to the downtrend line of the channel.BNB/USDTBNB (BNB) has declined to the critical support at $258 which could witness a tough battle between the bulls and the bears.BNB/USDT daily chart. Source: TradingViewThe downsloping 20-day EMA ($284) and the RSI below 37 indicate that bears have the upper hand. If bears sink and sustain the price below $258, the selling could pick up momentum and the BNB/USDT pair could drop to $239 and thereafter to $216.Alternatively, if the price turns up from the current level, it will suggest that the bulls continue to buy the dips to $258. The pair could then rise to the moving averages where the bears may again mount a strong defense. XRP/USDTBuyers pushed XRP (XRP) above the downtrend line on Nov. 20 but could not clear the hurdle at the 20-day EMA ($0.39). This suggests that the sentiment remains negative and traders are selling on rallies.XRP/USDT daily chart. Source: TradingViewThe XRP/USDT pair could drop to the support line where buyers may step in. A strong rebound off the support line will suggest that the pair has formed a symmetrical triangle pattern. On the other hand, if the price slips below the support line, the pair could drop to the $0.32 to $0.30 support zone. A strong rebound off this zone will indicate that the pair may remain stuck between $0.30 and $0.41 for a few days.The bears will have to pull the price below $0.30 to signal the start of the next leg of the downtrend.ADA/USDT Cardano (ADA) remains in a strong downtrend. The bears pulled the price below the immediate support at $0.31 on Nov. 21 opening the doors for a possible drop to the support line. ADA/USDT daily chart. Source: TradingViewA minor positive for the bulls is that the RSI is forming a bullish divergence. This suggests that the bearish momentum could be waning. The ADA/USDT pair could attempt a recovery from the support line, which is likely to hit a wall at the 20-day EMA ($0.34).If the price turns down from this level, it will suggest that bears continue to sell on rallies. That could result in a retest of the support line. If this level cracks, the selling could accelerate and the pair may drop to $0.25. Contrarily, a break above the 20-day EMA could embolden the buyers who may push the pair to the downtrend line.Related: Bitcoin price levels to watch as traders bet on sub-$14K BTCDOGE/USDTAfter trading between the moving averages for several days, Dogecoin (DOGE) plunged below the 50-day SMA ($0.08) on Nov. 20. This indicates that the uncertainty resolved in favor of the bears.DOGE/USDT daily chart. Source: TradingViewThe 20-day EMA ($0.09) is sloping down and the RSI is in the negative area, indicating that the DOGE/USDT pair could decline to the immediate support at $0.07. If this level also gives way, the pair could complete a 100% retracement of the entire rally and drop to $0.06. Conversely, if the price rebounds off the current level or $0.07, the bulls will again try to propel the pair above $0.09. A close above this resistance could signal that the corrective phase may be over. The pair could then rally to $0.12.MATIC/USDTPolygon (MATIC) dropped to the uptrend line on Nov. 21. This level has acted as a support on two previous occasions, hence the bulls will again try to defend it.MATIC/USDT daily chart. Source: TradingViewA recovery from the uptrend line could face strong selling near the 20-day EMA ($0.91). If the price turns down from this level, the pair could again retest the uptrend line. A break below this level could pull the pair to the important support at $0.69. This level is likely to attract buyers.On the upside, the 20-day EMA remains the key resistance to keep an eye on. If buyers drive the price above the 20-day EMA, the pair could rise to $0.97 and later to the stiff overhead resistance at $1.05.DOT/USDTPolkadot (DOT) remains in a strong downtrend. The bears pulled the price below the pennant formation and the Nov. 10 intraday low of $5.32 on Nov. 20. This indicates the resumption of the downtrend. DOT/USDT daily chart. Source: TradingViewBuyers may attempt to start a recovery from the psychological level of $5 which could reach the breakdown level from the pennant. If bears flip this level into resistance, the prospects of a decline to $4.08 increase.On the contrary, if buyers thrust the price above the 20-day EMA ($5.86), it will indicate aggressive buying at lower levels. That may trigger short covering from the aggressive bulls, clearing the path for a possible rally to $6.50. The views, thoughts and opinions expressed here are the authors’ alone and do not necessarily reflect or represent the views and opinions of Cointelegraph.

Čítaj viac

TON, TWT, CHZ and QNT breakout amid traders’ crypto contagion fears

The FTX collapse continues to stoke fears of a contagion in the cryptocurrency space as investors wait to hear about businesses that may face the heat. One of the marquee names to come under the circle of suspicion is the Grayscale Bitcoin Trust (GBTC), which has seen its discount to Bitcoin’s (BTC) price reach record levels of about 50%.Traders hate uncertainty and shy away from investing during these periods. That could be one of the reasons for a lack of buying interest in Bitcoin even after the sharp fall in its price. The Stock-to-Flow (S2F) model, which had seen its popularity soar during the bull phase, is coming under increasing criticism after the deviation between Bitcoin’s price and its projected price hit levels never seen before. Does this suggest that the pessimism has reached an extreme or is it just that the S2F model is flawed?Crypto market data daily view. Source: Coin360During a bear phase, the general trend is down but there are always pockets of strength that may offer trading opportunities to long-only investors. However, rallies during bear markets are short-lived, hence traders may consider booking profits near strong resistance levels.Let’s look at the charts of five cryptocurrencies that may attempt a rally in the near term.BTC/USDTBitcoin continues to trade inside the tight range between $16,229 and $17,190. Generally, periods of tight consolidation are followed by an increase in volatility.BTC/USDT daily chart. Source: TradingViewThe downsloping moving averages and the relative strength index (RSI) in the negative zone indicate that the path of least resistance is to the downside. If the price breaks below $16,229, the Nov. 9 intraday low of $15,588 may be threatened. A break and close below this support could signal the resumption of the downtrend. The next support on the downside is $12,200.If bulls want to avoid a further decline, they will have to push and sustain the price above the breakdown level of $17,622. Such a move will suggest strong demand at lower levels. The pair could then climb to the psychological level of $20,000.BTC/USDT 4-hour chart. Source: TradingViewThe BTC/USDT pair has been trading near the moving averages, which have flattened out. This suggests that the pair has entered a state of equilibrium as both the buyers and sellers are undecided about the next directional move.However, this uncertainty is unlikely to continue for long. If the price plummets below $16,229, the selling pressure could pick up momentum and the pair may drop to $15,588. If this support gives way, the pair may start the next leg of the downtrend.On the contrary, if the price rises and breaks above $17,190, it will suggest that the current tight range was used by the bulls to accumulate. The pair could then rally to $18,200 and later to $18,730. TON/USDTToncoin (TON) has recovered sharply from its June low and managed to hold on to a large part of the gains. This suggests that traders are in no hurry to dump their positions at higher levels.TON/USDT daily chart. Source: TradingViewThe TON/USDT pair has formed a symmetrical triangle, which usually acts as a continuation pattern. Both moving averages are gradually sloping up and the RSI is in the positive territory, indicating a slight advantage to the bulls.If the price rebounds off the 20-day exponential moving average ($1.65), the bulls will try to drive the price above the triangle. If they can pull it off, the pair could rally to $2.15 and thereafter climb toward the target objective of $2.87.Alternatively, if the price slips below the 20-day EMA, the pair could drop to the 50-day simple moving average ($1.50) and then to the support line. TON/USDT 4-hour chart. Source: TradingViewThe pair is facing stiff resistance at $1.80. Repeated failure to sustain the price above this level may have tempted short-term traders to book profits. The bears are trying to capitalize on this situation and sink the price below the 50-SMA. If this support cracks, the pair could dive to $1.55.Conversely, if the price rebounds off the current level, the bulls will again try to scale the wall at $1.80. The repeated retest of a resistance level tends to weaken it. A close above this resistance could open the doors for a possible rally to $2. CHZ/USDTChiliz (CHZ) is attempting to form an inverse head and shoulders pattern, which will complete on a break and close above the neckline. If that happens, it may signal the start of a new uptrend.CHZ/USDT daily chart. Source: TradingViewThe pattern target of the reversal formation is $0.54 but the bears are unlikely to give up easily. They are aggressively defending the neckline. If the price breaks below the 50-day SMA ($0.21), the CHZ/USDT pair could decline to $0.18 and subsequently to $0.14.Alternatively, if the price bounces off the current level, buyers will again attempt to propel the pair above the neckline and gain control.The flattening moving averages and the RSI just below the midpoint do not give a clear advantage either to the bulls or the bears. Hence, it is better to wait for the price to breakout before establishing fresh positions.CHZ/USDT 4-hour chart. Source: TradingViewThe pair turned down sharply from $0.27 and the bears have pulled the price below the moving averages. If the price sustains below the 50-SMA, the pair could drop to $0.20. That could put the bears in the driver’s seat.On the other hand, if the price turns up from the current level and rises above the 20-EMA, it will suggest that traders are viewing the dips as a buying opportunity. The pair could then rise to $0.26 and later to $0.28. Buyers will have to drive the price above this level to challenge the resistance at $0.30.Related: FTX funds on the move as thief converts thousands of ETH into BitcoinQNT/USDTAlthough Quant (QNT) has corrected sharply in the past few days, it is attempting to take support and bounce off the support line. This indicates demand at lower levels.QNT/USDT daily chart. Source: TradingViewThe downsloping 20-day EMA ($128) indicates advantage to bears but the RSI is trying to form a positive divergence. This suggests that the selling pressure could be easing. Buyers will have to propel and sustain the price above the 20-day EMA to indicate that the corrective phase may be over. The QNT/USDT pair could then rise to the 50-day SMA ($151) and thereafter to $180.This positive view could invalidate in the near term if the price continues lower and breaks below the uptrend line. The pair could then drop to $87 and later to $79.QNT/USDT 4-hour chart. Source: TradingViewThe recovery in the pair is facing selling near the downtrend line. This suggests that bears are active at higher levels. The bears have pulled the price below the moving averages and will try to extend the decline to $105 and then to $94.To invalidate this negative view, the bulls will have to kick and sustain the price above the downtrend line. The pair could then rise to $125 where the bears may mount a strong defense. If buyers overcome this barrier, the up-move may reach $136.TWT/USDTWhile most major cryptocurrencies extended their downtrend in the past few days, Trust Wallet Token (TWT) has moved in the opposite direction and risen sharply. This indicates outperformance in the near term.TWT/USDT daily chart. Source: TradingViewThe TWT/USDT pair soared from $1.03 on Nov. 10 to $2.73 on Nov. 14, a 165% rally within a short time. That pushed the RSI deep into the overbought territory, suggesting a minor correction or consolidation in the near term and that is what happened.The pair is finding support near the 50% Fibonacci retracement level of $1.88 but the bulls are struggling to push the price above $2.45. This suggests the pair may consolidate between $1.81 and $2.45 for a few days.Both moving averages are sloping up and the RSI remains in the positive territory, indicating that bulls have the advantage. If buyers drive the price above the $2.45 to $2.73 resistance zone, the pair could resume its uptrend. This positive view could invalidate on a break and close below the 20-day EMA ($1.70).TWT/USDT 4-hour chart. Source: TradingViewThe bears pulled the price below the 50-SMA but they are struggling to keep the pair down. This suggests strong buying at lower levels. If buyers push the price above the 20-EMA, the pair could rise to the downtrend line. A break above this level could clear the path for a possible rally to $2.45. This remains the key hurdle for the bulls to overcome. If they succeed in breaking it, the pair may retest $2.73.On the downside, a slide below $1.92 could result in a decline to $1.81. This is an important level to keep an eye on because a break below it could tilt the advantage in favor of the bears.The views and opinions expressed here are solely those of the author and do not necessarily reflect the views of Cointelegraph.com. Every investment and trading move involves risk, you should conduct your own research when making a decision.

Čítaj viac

Price analysis 11/18: BTC, ETH, BNB, XRP, ADA, DOGE, MATIC, DOT, UNI, LTC

The sentiment across the cryptocurrency ecosystem remains fragile as market participants assess the impact of the FTX crisis on various businesses within and outside of the crypto sector. Trading firm QCP Capital said in its latest circular on Telegram that crypto assets may continue their underperformance till the new year. QCP projects Bitcoin (BTC) to plunge to $12,000 and Ether (ETH) to $800.Looking at the brighter side, FTX could be the last major player to bite the dust during the current bear market cycle, according to CK Zheng, co-founder of crypto hedge fund ZX Squared Capital. Zheng also added that institutional investors who have a long-term horizon may continue to invest in blockchain technology and select cryptocurrencies such as Bitcoin and Ethereum.Daily cryptocurrency market performance. Source: Coin360When the sentiment is bearish, rumors create panic among traders who dump their holdings out of fear. Usually, these occasions form a bottom. Traders may remain cautious and avoid placing large bets until the dust settles and the markets confirm a bottom.What are the important levels to keep an eye on and which could suggest that the correction may be over? Let’s study the charts of the top-10 cryptocurrencies to find out.BTC/USDTBitcoin continues to trade below the breakdown level of $17,622, which is a negative sign. After a period of high volatility, the price has been stuck inside the range between $16,229 and $17,190.BTC/USDT daily chart. Source: TradingViewThe 20-day exponential moving average ($17,980) is sloping down and the relative strength index (RSI) is in the negative territory, indicating that bears are in control. If the price turns down and breaks below $16,229, the BTC/USDT pair could retest the Nov. 9 low of $15,588. A break and close below this support could trigger panic selling, which could pull the pair to $12,200. On the contrary, if buyers drive the price above $17,190, it will suggest strong demand at lower levels. The pair could then rally to the overhead resistance zone between $17,622 and the 20-day EMA. A break and close above this zone could indicate the start of a new up-move.ETH/USDTEther has been gradually losing ground in the past few days. The bears may try to build upon their advantage by pulling the price below the immediate support of $1,171. If they succeed, the pair could decline to the support line of the descending channel pattern.ETH/USDT daily chart. Source: TradingViewThe downsloping 20-day EMA ($1,325) and the RSI in the negative zone indicate that sellers have the upper hand. If bears pull the price below the support line of the channel, the selling could accelerate and the ETH/USDT pair may drop to $1,000.The first sign of strength will be a break and close above the moving averages. Such a move could open the gates for a possible rally to the downtrend line. The bulls will have to clear this hurdle to signal the start of a new up-move. BNB/USDTBNB (BNB) once again dipped close to the strong support of $258 on Nov. 17 but the bulls held their ground. Buyers will now attempt to start a relief rally that could reach the 20-day EMA ($291).BNB/USDT daily chart. Source: TradingViewThe downsloping 20-day EMA and the RSI in the negative territory indicate that bears are in control. If the price turns down from the current level or the 20-day EMA, the bears will make one more attempt to break the support at $258. If they can pull it off, the BNB/USDT pair could dive to $239 and then to $216.Contrarily, if bulls push the price above the 20-day EMA, the pair could rise to the overhead resistance at $300. The bulls will have to clear this hurdle to open the doors for a possible rally to $338.XRP/USDTXRP (XRP) is facing selling near the downtrend line. This suggests that the bears are trying to build upon their advantage and pull the price below the immediate support of $0.36.XRP/USDT daily chart. Source: TradingViewThe downsloping 20-day EMA ($0.41) and the RSI in the negative territory indicate that the path of least resistance could be to the downside. If the $0.36 level gives way, the XRP/USDT pair could plunge to $0.32.To invalidate this bearish view, buyers will have to overcome the stiff challenge in the zone between the downtrend line and $0.41. If that happens, the pair could pick up momentum and rally toward the 50-day SMA ($0.45).ADA/USDT Cardano (ADA) remains in a strong downtrend and the bears are trying to sink the price below the crucial support at $0.31. However, the bulls are likely to have other plans and they may try to defend this level aggressively.ADA/USDT daily chart. Source: TradingViewAny relief rally is likely to face stiff resistance in the zone between $0.35 and the 20-day EMA ($0.36). If the price turns down from this zone, the likelihood of a break below $0.31 increases. The ADA/USDT pair could then plummet to the support line. This is an important level to keep an eye on because if it cracks, the next stop could be $0.25.This negative view could invalidate in the near term if buyers push the price above the 20-day EMA. The pair could then rise to the downtrend line. A break and close above this resistance could suggest a potential trend change.DOGE/USDTDogecoin (DOGE) has been trading between the moving averages for the past few days. This suggests that the bulls are buying the dips to the 50-day SMA ($0.08) and the bears are selling the relief rallies to the 20-day EMA ($0.09).DOGE/USDT daily chart. Source: TradingViewThe downsloping 20-day EMA and the RSI just below the midpoint indicate a minor advantage to the bears. If the price turns down and slips below the 50-day SMA, the DOGE/USDT pair could drop to $0.07 and later to $0.06.The bulls are likely to have other plans as they will try to push and sustain the price above the overhead resistance at the 20-day EMA. If they succeed, the pair could start a stronger recovery and rally toward $0.12. MATIC/USDTAfter trading between the moving averages for the past few days, Polygon (MATIC) closed below the 50-day SMA ($0.89) on Nov. 17. Buyers tried to push the price back above the 50-day SMA on Nov. 18 but are facing stiff resistance from the bears.MATIC/USDT daily chart. Source: TradingViewIf buyers push the price back above the 50-day SMA, the MATIC/USDT pair could rise to the 20-day EMA ($0.95). The bears are likely to mount a strong defense at this level but if bulls overcome this barrier, the pair could rally to $1.05.Alternatively, if the price fails to rise above the moving averages, it will suggest that the sentiment remains negative and traders are selling on rallies. That could increase the likelihood of a drop to the uptrend line.Related: Binance sees record 138K BTC inflows as opinions differ on what Bitcoin price will do nextDOT/USDTThe price action of the past few days has formed a pennant, which generally acts as a continuation pattern. The downsloping moving averages and the RSI in the negative territory indicate that sellers have the edge in Polkadot (DOT). DOT/USDT daily chart. Source: TradingViewIf the price turns down and breaks below the pennant, the selling could pick up. The DOT/USDT pair could start the next leg of the downtrend on a break below $5.32. The next support on the downside is at $4.32.Conversely, if the price continues higher and breaks above the pennant, it will invalidate the bearish setup. The pair could then rise to the 50-day SMA ($6.22). A break and close above this level could suggest that the short-term downturn could be over.UNI/USDTUniswap (UNI) turned down from the 50-day SMA ($6.43) on Nov. 16 but the bulls are attempting to form a higher low at $5.66. UNI/USDT daily chart. Source: TradingViewThe bulls will have to push and sustain the price above the 50-day SMA to gain the upper hand. If they manage to do that, the UNI/USDT pair could attempt a rally to $7.36 and thereafter to $7.79.The long wick on the Nov. 18 candlestick shows that the bears are defending the moving averages. The downsloping 20-day EMA ($6.20) and the RSI just below the midpoint suggest that bears are at an advantage. A break and close below $5.66 may clear the path for a retest of $5.14.LTC/USDTLitecoin (LTC) broke and closed above the 20-day EMA ($59) on Nov. 17 and the RSI jumped into positive territory, indicating that bulls have a slight edge.LTC/USDT daily chart. Source: TradingViewThe up-move is likely to face stiff resistance at $65. If the price turns down from this level, the LTC/USDT pair could again drop toward the moving averages. Contrary to this assumption, if buyers drive and sustain the price above $65, the bullish momentum could pick up and the pair could attempt a rally to the overhead resistance at $75. The bears are expected to defend this level with all their might. If the price turns down from $75, it will suggest that the pair may extend its stay inside the $46 to $75 range for a few more days.The views and opinions expressed here are solely those of the author and do not necessarily reflect the views of Cointelegraph.com. Every investment and trading move involves risk, you should conduct your own research when making a decision.

Čítaj viac

Price analysis 11/16: BTC, ETH, BNB, XRP, ADA, DOGE, MATIC, DOT, UNI, LTC

The collapse of FTX cryptocurrency exchange has created a liquidity crisis in the crypto space, which could extend the crypto winter through the end of 2023, according to a research report by Coinbase. According to analysts, the FTX implosion could keep the institutional investors at bay because they are even more likely to tread cautiously for some time.The crisis has negatively impacted several crypto-focused companies who have assets stuck on FTX following the company’s bankruptcy filing on Nov. 11. Investors also fear the contagion could spread, causing further damage to the cryptocurrency ecosystem.Daily cryptocurrency market performance. Source: Coin360Although several investors were rattled by the collapse of FTX, billionaire venture capitalist and serial blockchain investor Tim Draper remains bullish on Bitcoin (BTC). In a Nov.15 interview with Cointelegraph, Draper doubled down on his $250,000 target for Bitcoin in 2023. However, investors should take the price projection with a pinch of salt because it is unlikely that Bitcoin will start a roaring bull market in the near future. What are the key support and resistance levels to watch out for on Bitcoin and altcoins? Let’s study the charts of the top-10 cryptocurrencies to find out.BTC/USDTBitcoin broke and closed below the June low of $17,622 on Nov. 9. This marked the resumption of the downtrend. Although bulls tried to stage a strong recovery on Nov. 10, their efforts met with heavy selling above $17,622. This suggests that the bears have flipped the level into resistance.BTC/USDT daily chart. Source: TradingViewThe 20-day exponential moving average ($18,271) has turned down and the relative strength index (RSI) is in the negative territory. This suggests that the bears have the upper hand.If the price sustains below $17,622, it will increase the prospect of a break below $15,588, If that happens, the BTC/USDT pair could extend its decline to $12,200.Contrary to this assumption, if the price turns up and breaks above the 20-day EMA, it will suggest strong demand at lower levels. The pair could then challenge the psychological level at $20,000.ETH/USDTEther (ETH) has been declining inside a descending channel pattern for the past several weeks. The failure to push the price above the channel on Nov. 4 may have led to profit-booking by the short-term traders.ETH/USDT daily chart. Source: TradingViewThe buyers aggressively bought the dip to the support line on Nov. 10 but the relief rally fizzled out near the 50-day simple moving average ($1,372). This suggests that bears are selling at higher levels.The bears will again strive to sink the price below the channel. If that happens, the selling could intensify and the ETH/USDT pair could drop to $1,000. To gain the upper hand, buyers will have to push the price above the moving averages. The pair could then rise to the downtrend line.BNB/USDTBNB (BNB) soared to $398 on Nov. 8 but the bulls could not sustain the higher levels as seen from the long wick on the day’s candlestick. The selling continued on Nov. 9 and pulled the price near the strong support at $258.BNB/USDT daily chart. Source: TradingViewThe bulls purchased the drop on Nov. 10 but they could not thrust the price above the 20-day EMA ($295). This suggests that the sentiment turned negative and bears were selling the relief rallies to the 20-day EMA.The bears will again try to break the support at $258 and if they manage to do that, the BNB/USDT pair could drop to $239 and later to $216. This negative view will be invalidated in the near term if bulls push and sustain the price above $313.XRP/USDTXRP (XRP) re-entered the $0.41 to $0.30 range on Nov. 8, indicating a lack of demand at higher levels. The selling continued on Nov. 9 and the price dropped to $0.32.XRP/USDT daily chart. Source: TradingViewBuyers purchased the dip and tried to push the price back above $0.41 but the bears did not relent. This suggests that the bears have flipped the $0.41 level into resistance. The bears will again try to pull the pair to the critical support at $0.30. This is an important level for the bulls to defend because a break and close below it could signal the resumption of the downtrend. On the upside, the first sign of strength will be a break and close above $0.41. The XRP/USDT pair could then rise to the 50-day SMA ($0.45).ADA/USDT Cardano (ADA) is in a strong downtrend. Although both moving averages are sloping down, the RSI is attempting to form a bullish divergence, indicating that the selling pressure may be reducing.ADA/USDT daily chart. Source: TradingViewThe first sign of strength will be a break and close above the downtrend line. Such a move will suggest a potential trend change. The ADA/USDT pair could then attempt a rally to $0.52.On the other hand, if the price continues lower and breaks below $0.31, the pair could drop to the support line. This line has arrested the decline on three previous occasions, hence the bulls may again buy the dip to this level. If buyers fail to defend the level, the pair could extend its downtrend to $0.25.DOGE/USDTDogecoin (DOGE) witnessed a sharp rally from $0.06 on Oct. 25 to $0.16 on Nov. 1. That pushed the RSI into extremely overbought levels, which may have tempted short-term traders to book profits.DOGE/USDT daily chart. Source: TradingViewThe selling picked up momentum after bulls failed to defend the 50% Fibonacci retracement level of $0.11. Buyers defended the 50-day SMA ($0.08) on Nov. 9 but the bears halted the recovery at the 20-day EMA ($0.09). The DOGE/USDT pair has been trading between the moving averages for the past few days. If bears sink the price below the 50-day SMA, the pair could complete a 100% retracement and drop to $0.06. Contrarily, a break above $0.10 will suggest that the bulls are back in the game. The pair could then rise to $0.12.MATIC/USDTPolygon (MATIC) soared above the overhead resistance of $1.05 on Nov. 4 but the rally met with stiff resistance at $1.30 on Nov. 5. Buyers tried to resume the up-move on Nov. 7 but could not clear the overhead hurdle.MATIC/USDT daily chart. Source: TradingViewThe bears sold aggressively on Nov. 8 and 9 and pulled the price below the moving averages but the buyers held the uptrend line. The MATIC/USDT pair rebounded sharply on Nov. 10 but the bears sold at higher levels and pulled the price back below the 20-day EMA ($0.96) on Nov. 12.If the price slides below the 50-day SMA ($0.89), the pair could drop to the uptrend line. A break below this support could open the doors for a retest of the crucial support at $0.69. On the contrary, if buyers push the price above the 20-day EMA, the pair could rise to $1.05.Related: Bitcoin price dips to $16.4K over Genesis woes as execs defend GBTCDOT/USDTPolkadot (DOT) plunged below the strong support zone of $6 to $5.68 on Nov. 9. This indicates the resumption of the downtrend. DOT/USDT daily chart. Source: TradingViewBuyers attempted to push the price back above $6 and trap the aggressive bears but the sellers held their ground. This indicates that the bears are trying to flip the $6 level into resistance.The downsloping 20-day EMA ($6.12) and the RSI in the negative territory indicate advantage to the bears. The sellers will make one more attempt to pull the DOT/USDT pair below $5.32. If they succeed, the pair could extend its decline to $4.32. To invalidate this negative view, the bulls will have to push and sustain the price above the moving averages.UNI/USDTUniswap (UNI) had been trading between $5.14 and $7.36 for the past several days. Buyers drove the price above the resistance on Nov. 4 but could not build upon this advantage. The bears pulled the price back into the range on Nov. 6.UNI/USDT daily chart. Source: TradingViewThis may have trapped the aggressive bulls who then rushed to the exit. Long liquidation and selling by the bears pulled the price below the support of $5.14 on Nov. 8 but this proved to be a bear trap. The bulls bought the dip and pushed the price back into the range on Nov. 10. The recovery is facing stiff resistance at the moving averages, indicating selling at higher levels. The bears may again attempt to sink and sustain the price below the range but the bulls are expected to defend the support aggressively. This suggests that the UNI/USDT pair may remain range-bound between $4.71 and $7.79 for a few more days.LTC/USDTLitecoin (LTC) has been range-bound between $46 and $75 for the past several weeks. The failure of the bulls to push the price above $75 on Nov. 7 may have attracted profit-booking by short-term traders. That pulled the price near the support of $46 on Nov. 9.LTC/USDT daily chart. Source: TradingViewWhen the price is stuck inside a range, traders generally buy the dips to the support level and that is what happened on Nov. 10. The LTC/USDT pair continued its rise on Nov. 11 but met with strong selling near $65. This suggests that bears are active at higher levels.The flattish moving averages and the RSI near the midpoint indicate a balance between supply and demand. This indicates that the pair could trade in a tight range between $53 and $65 for some time. The views and opinions expressed here are solely those of the author and do not necessarily reflect the views of Cointelegraph.com. Every investment and trading move involves risk, you should conduct your own research when making a decision.

Čítaj viac

Získaj BONUS 8 € v Bitcoinoch

nakup bitcoin z karty

Registrácia Binance

Burza Binance

Aktuálne kurzy