Price analysis 3/17: BTC, ETH, BNB, XRP, ADA, DOGE, MATIC, SOL, DOT, SHIB
Bitcoin has risen above $25,000 and if bulls flip this level into support during the next pullback, it will signal the start of a new up-move to $32,000.
Čítaj viac
Bitcoin has risen above $25,000 and if bulls flip this level into support during the next pullback, it will signal the start of a new up-move to $32,000.
Čítaj viac
Credit Suisse has pulled the U.S. equities markets lower, but a positive sign is that Bitcoin and select altcoins are holding near their local highs.
Čítaj viac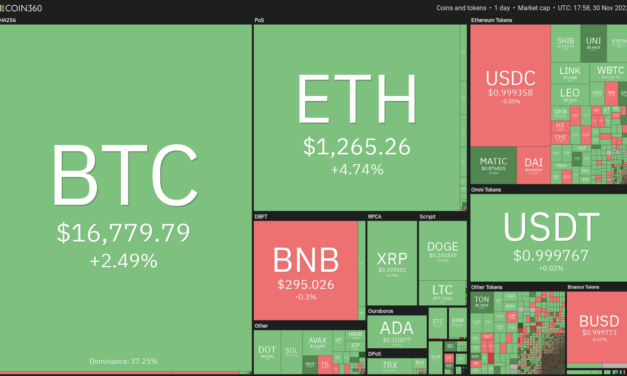
Bitcoin (BTC) has shrugged off the weakness in the United States equities markets and is attempting to start a recovery on Nov. 30. Buyers are attempting to achieve a monthly close above $17,000. This suggests that the selling that had picked up due to the FTX crisis may be reducing.Usually, smaller investors panic and dump their holdings in a bear market but it has been the opposite with Bitcoin investors. According to Glassnode data released on Nov. 27, investors holding less than one Bitcoin, also called shrimps, bought 96,200 Bitcoin since the FTX crash. Along similar lines, investors holding between 1 to 10 Bitcoin, classified as crabs, bought 191,600 Bitcoin over the past 30 days. This shows investors are continuing to accumulate at lower levels.Daily cryptocurrency market performance. Source: Coin360However, a sharp recovery in Bitcoin’s price is unlikely for some time. Trading firm QCP Capital believes that the United States Consumer Price Index data on Dec. 13 and the U.S. Fed’s policy decision on Dec. 14 could act as risk factors because many investors could be “forced to continually sell assets to raise liquidity.” QCP expects the situation to turn around only in the second or third quarter of next year after the Fed possibly pivots and releases liquidity in the system.Could Bitcoin lead the cryptocurrency markets higher? Let’s study the charts of the top-10 cryptocurrencies to find out.BTC/USDTBitcoin turned up from $15,995 on Nov. 28 and broke above the developing descending triangle pattern on Nov. 30. This invalidated the bearish setup and may have attracted buying from the bulls who are trying to push the price above the 20-day exponential moving average ($16,910).BTC/USDT daily chart. Source: TradingViewA close above the 20-day EMA will be the first sign that the bears may be losing their grip. The BTC/USDT pair could then rally to $17,622 and later to the 50-day simple moving average ($18,434). The sellers are expected to defend this zone with vigor.If the price turns down from the overhead zone but bounces off the 20-day EMA, it will suggest that bulls are buying the dips. That could increase the possibility of a rally to $20,000 and then to $21,500.Another possibility is that the price turns down from $17,622. If that happens, it will suggest that the pair may consolidate between $15,476 and $17,622 for some more time.ETH/USDTEther (ETH) turned down from the 20-day EMA ($1,234) on Nov. 26 but the bulls arrested the decline at $1,151 on Nov. 28. This indicates a pick-up in demand and a sign that the sentiment could be turning positive.ETH/USDT daily chart. Source: TradingViewBuyers have pushed the price above the 20-day EMA and will next attempt to break above the 50-day SMA ($1,335). If they succeed, the ETH/USDT pair could rally to the resistance line of the descending channel. This level may attract strong selling by the bears because a break above the channel could indicate a possible trend change.To invalidate this bullish view, the bears will have to defend the 50-day SMA and pull the price back below $1,051. The pair could then decline to the support line of the channel.BNB/USDTBNB (BNB) bounced off the moving averages on Nov. 29 but the bulls are struggling to build upon this move. This suggests that bears are likely to pose a strong challenge between $300 and $318.BNB/USDT daily chart. Source: TradingViewThe 20-day EMA ($292) is flattening out and the RSI is just above the midpoint, indicating a balance between supply and demand. The advantage could tilt in favor of the buyers if they catapult the price above $318. That could clear the path for a rally to $338 where the bears may again erect a stiff barrier.This positive view could invalidate in the near term if the price turns down and plummets below the moving averages. The pair could then decline to the support at $258. XRP/USDTThe bulls successfully defended the retest of the breakout from the symmetrical triangle on Nov. 28. This is a positive sign as it shows that traders are buying the dips in XRP (XRP).XRP/USDT daily chart. Source: TradingViewThe bounce has reached the overhead resistance at $0.41, which is an important level to keep an eye on. If bulls catapult the price above this resistance, the XRP/USDT pair could attempt a rally to $0.45 and then to $0.51.On the other hand, if the price turns down from the current level, it will suggest that the bears are aggressively selling near $0.41. They will then again try to pull the price inside the triangle. If they can pull it off, the pair could drop to $0.34. ADA/USDT Cardano (ADA) remains in a downtrend but the bullish divergence on the RSI suggests that the bearish momentum may be weakening.ADA/USDT daily chart. Source: TradingViewThe bulls will have to thrust and sustain the price above the 20-day EMA ($0.32) to signal strength. If they do that, the ADA/USDT pair may start a recovery to the downtrend line. The 50-day SMA ($0.36) may act as a resistance but is likely to be crossed. Conversely, if the price turns down from the 20-day EMA, it will indicate that bears are selling on minor rallies. The bears will then try to resume the downtrend and sink the price to the support line.DOGE/USDTDogecoin (DOGE) bounced off the 20-day EMA ($0.09) on Nov. 28, indicating that the sentiment has turned positive and traders are buying the dips.DOGE/USDT daily chart. Source: TradingViewThe upsloping 20-day EMA and the RSI above 60 suggest that bulls have the upper hand. Buyers are trying to extend the recovery to the 50% Fibonacci retracement level of $0.11 and next to the 61.8% retracement level of $0.12. The sellers are likely to mount a strong defense in this zone. If the price turns down from it, the DOGE/USDT pair could again drop to the 20-day EMA.On the contrary, if buyers thrust the price above the overhead zone, the pair could complete a 100% retracement and rally to $0.16.MATIC/USDTPolygon (MATIC) remains stuck between the 20-day EMA ($0.88) and the uptrend line. The 20-day EMA is flattening out and the RSI is near the midpoint, indicating a balance between supply and demand. MATIC/USDT daily chart. Source: TradingViewThe bulls are trying to drive the price above the moving averages and gain the upper hand. If they succeed, the MATIC/USDT pair could climb to $0.97 and then rally to $1.05. This level could again attract selling by the bears but if bulls clear this hurdle, the bullish momentum could pick up.This positive view could invalidate in the near term if the price turns down from the moving averages and slides below the uptrend line. The pair could then drop to the important support at $0.69.Related: FTM price rebounds 50% as Fantom reveals 30 years runway (without having to sell its token)DOT/USDTPolkadot (DOT) turned up from $5.06 on Nov. 28, indicating that bulls are attempting to form a low at $5. The price reached the 20-day EMA ($5.52) on Nov. 30, which is likely to act as a formidable resistance. The RSI has formed a bullish divergence as it has not tracked the DOT/USDT pair lower. This indicates that the selling pressure could be weakening and increases the likelihood of a break above the 20-day EMA. If that happens, the pair could rise to the 50-day SMA ($6) and later attempt a rally to the downtrend line. Alternatively, if the price turns down from the 20-day EMA, it will suggest that bears are viewing the relief rallies as a selling opportunity. A break below $5 could signal the resumption of the downtrend. The next support on the downside is $4.32.LTC/USDTThe long tail on Litecoin’s (LTC) Nov. 28 candlestick shows strong buying at lower levels. This suggests that buyers are trying to flip the breakout level of $75 into support. LTC/USDT daily chart. Source: TradingViewThe rising 20-day EMA ($69) and the RSI in the positive territory indicate the path of least resistance is to the upside. Buyers will have to push the price above $84 to start a new up-move, which could reach $104.Instead, if bulls fail to propel the price above $84, the bears will again try to sink the LTC/USDT pair below the 20-day EMA. If they manage to do that, several aggressive bulls may get trapped resulting in long liquidation. The pair may then fall to the 50-day SMA ($60). UNI/USDTThe bulls are buying the dips to the support line of the symmetrical triangle pattern. This is a positive sign as it indicates demand at lower levels. Buyers are trying to strengthen their position by pushing Uniswap (UNI) above the 20-day EMA ($5.67).UNI/USDT daily chart. Source: TradingViewThe RSI has risen close to the midpoint, indicating that the bearish momentum may be weakening. If buyers sustain the price above the 20-day EMA, the UNI/USDT pair may attempt a rally to the resistance line of the triangle. A break above the triangle will suggest a potential trend change.Contrarily, if the price fails to rise above the moving averages, it will suggest that the bears continue to sell on rallies. They will then again try to pull the price below the triangle and open the doors for a decline to $4.60 and then $3.33.The views, thoughts and opinions expressed here are the authors’ alone and do not necessarily reflect or represent the views and opinions of Cointelegraph.
This article does not contain investment advice or recommendations. Every investment and trading move involves risk, and readers should conduct their own research when making a decision.
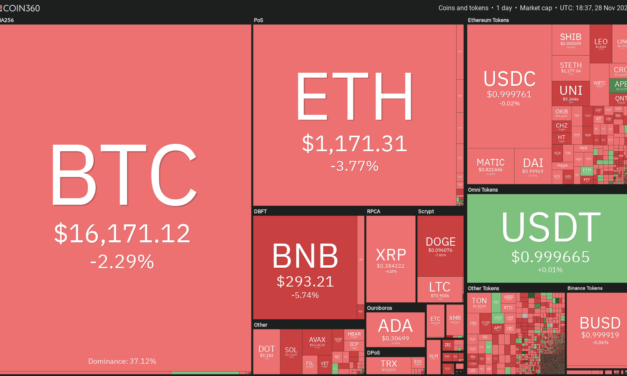
China witnessed a spike in Covid cases and that has resulted in strict lockdown restrictions in several parts of the country. This triggered widespread protests in China and has possibly pulled the global stock markets lower. In addition to the turmoil in China, the cryptocurrency markets, which are already in a bear grip, are reeling under pressure from the Chapter 11 bankruptcy filing by BlockFi and its subsidiaries. Bitcoin (BTC) is down 21% in November, on track to its worst November performance since 2018.Daily cryptocurrency market performance. Source: Coin360The sharp fall in Bitcoin’s price has drastically reduced the number of wallets holding more than $1 million worth of Bitcoin. There were 112,898 millionaire wallets on Nov. 8, 2021, but Glassnode data shows that as of Nov. 25, only 23,245 wallets boast of a Bitcoin balance worth $1 million or more.Could the weakness in the S&P 500 index (SPX) pull Bitcoin below $16,000? Let’s study the charts to find out.SPXThe recovery in the S&P 500 index has risen close to the downtrend line. The bears are likely to defend this level as they had done on two previous occasions.SPX daily chart. Source: TradingViewThe sellers will have to sink the price below the 20-day exponential moving average (3,922) to tilt the short-term advantage in their favor. Post that, the index could drop to the 50-day simple moving average (3,794) and later to 3,700.Contrarily, if the price turns down from the current level or the overhead resistance but bounces off the 20-day EMA, it will suggest that traders continue to buy on dips. That could improve the prospects of a break above the downtrend line. If that happens, the index could rise to 4,300. Such a move will suggest that the downtrend has ended.DXYThe U.S. dollar index (DXY) turned down from 108 on Nov. 21, indicating that the sentiment has turned bearish and the traders may be using the rallies to lighten long positions and establish short positions.DXY daily chart. Source: TradingViewThe downsloping 20-day EMA (108) and the relative strength index (RSI) in the negative territory indicate that bears are in command. If bears succeed in pulling the price below 105, the selling could intensify and the index may slide to 103.50 and then 102.On the other hand, if the rebound off $105 sustains, the recovery could reach the 20-day EMA. If the relief rally again faces rejection at this level, the likelihood of a break below 105 increases.On the upside, buyers will have to pierce the resistance at 108 to signal a strong comeback. The index could then rise to the uptrend line where it may face tough resistance from the bears.BTC/USDTBitcoin’s relief rally could not even reach the 20-day EMA ($16,972), indicating that traders are hesitant to buy at higher levels. The sellers will now try to pull the price to the crucial support at $15,476.BTC/USDT daily chart. Source: TradingViewThe BTC/USDT pair is forming a descending triangle pattern, which will complete on a break and close below $15,476. This negative setup has a target objective at $13,330.The downsloping moving averages indicate advantage to bears but the bullish divergence on the RSI suggests that the bearish momentum could be weakening.If the price turns up and breaks above the downtrend line, it could invalidate the negative setup. That could open the doors for a possible rally to the overhead resistance at $17,622. Buyers will have to kick the price above this level to indicate that the downtrend could be ending.ETH/USDTEther (ETH) reached the 20-day EMA ($1,233) on Nov. 26 but the bulls could not propel the price above it. This suggests that the bears continue to defend the 20-day EMA vigorously. ETH/USDT daily chart. Source: TradingViewThe sellers may try to pull the price to the support line of the descending channel pattern, which is close to the psychologically critical level of $1,000. Buyers are likely to defend this level with all their might but they will have to clear the overhead obstacle at the 20-day EMA to start a sustained recovery. The ETH/USDT pair could then rise to the 50-day SMA ($1,337) and subsequently to the resistance line.On the downside, a break and close below the channel could accelerate selling and sink the pair to the June low at $881.BNB/USDTBNB’s (BNB) recovery turned down from $318 on Nov. 26 and plunged back below the breakout level of $300 on Nov. 28. BNB/USDT daily chart. Source: TradingViewThe bears will try to solidify their position by pulling the price below the moving averages. If they succeed, it will suggest that the break above $300 may have been a bull trap. The BNB/USDT pair could then decline to $275 and later to $258.If the price turns up from the moving averages, it will suggest that lower levels are attracting buyers. The pair could then again rise to $318. If bulls drive the price above this resistance, the pair could rally to $338.XRP/USDTXRP (XRP) rose above the overhead resistance of $0.41 on Nov. 25 but the bulls could not sustain the higher levels as seen from the long wick on the day’s candlestick.XRP/USDT daily chart. Source: TradingViewThis may have attracted selling by the bears who pulled the price below the 20-day EMA ($0.39) on Nov. 28. The price has dipped to the breakout level from the symmetrical triangle. This is an important level to keep an eye on because a break below it will suggest that the XRP/USDT pair may extend its stay inside the $0.30 to $0.41 range for a few more days. The flattening 20-day EMA and the RSI near 45 suggest that the bullish momentum has weakened in the near term.Buyers will have to push and sustain the price above $0.41 to signal the start of a new up-move.ADA/USDT Cardano’s (ADA) relief rally could not even reach the 20-day EMA ($0.33), indicating a lack of demand at higher levels.ADA/USDT daily chart. Source: TradingViewThe bears will try to build upon their advantage and resume the downtrend by pulling the ADA/USDT pair below the support near $0.30. If they do that, the pair could drop to the support line where buyers may step in and arrest the decline.This bearish view could invalidate in the near term if the price rebounds off the support near $0.30 and rises above the 20-day EMA. The pair could then attempt a rally to the downtrend line, indicating that the bears may be losing their grip.Related: New BTC miner capitulation? 5 things to know in Bitcoin this weekDOGE/USDTDogecoin (DOGE) soared above the psychological level of $0.10 on Nov. 27 but the bulls could not sustain the higher levels. Profit booking pulled the price back into the range on Nov. 28.DOGE/USDT daily chart. Source: TradingViewThe 20-day EMA ($0.09) is gradually sloping up and the RSI is in the positive territory, indicating that buyers have a slight edge. If the price springs up from the 20-day EMA, the bulls will try to resume the up-move by pushing the DOGE/USDT pair above $0.11. If they manage to do that, the rally could reach the 61.8% Fibonacci retracement level of $0.12.On the contrary, if the price turns down and breaks below the moving averages, it will suggest that the break above the range may have been a bull trap. The pair could then drop to the support at $0.07. MATIC/USDTBuyers are struggling to push Polygon (MATIC) above the 20-day EMA ($0.88). This suggests that bears are viewing the relief rallies as a selling opportunity.MATIC/USDT daily chart. Source: TradingViewThe MATIC/USDT pair could again drop to the uptrend line. This level has acted as a strong support on four previous occasions, hence the bulls will again try to defend it aggressively. If the price bounces off the uptrend line, the pair could rise to the 50-day SMA ($0.90). A break above this level will suggest that the bulls are on a comeback. The pair could then rise to $0.97. On the contrary, if the price breaks below the uptrend line, the pair could drop to the important support at $0.69. DOT/USDTPolkadot (DOT) is in a strong downtrend. Attempts by the bulls to start a recovery fizzled out at $5.53 on Nov. 24. This suggests that the sentiment remains negative and traders are selling on rallies.DOT/USDT daily chart. Source: TradingViewThe bears have pulled the price near the crucial support at $5. This is an important level for the bulls to defend because if they fail to do that, the DOT/USDT pair could resume the downtrend. The pair could then decline to $4.06.Alternatively, if the price turns up from the current level or rebounds off $5, it will suggest demand at lower levels. Buyers will again try to push the price above the 20-day EMA ($5.57) and extend the relief rally. The pair could then rise to $6.50.The views, thoughts and opinions expressed here are the authors’ alone and do not necessarily reflect or represent the views and opinions of Cointelegraph.
This article does not contain investment advice or recommendations. Every investment and trading move involves risk, and readers should conduct their own research when making a decision.
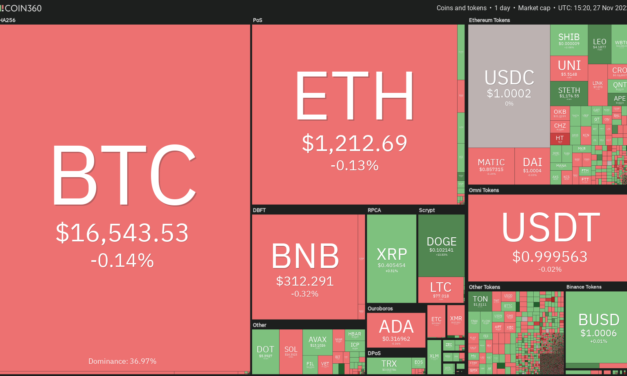
Bitcoin (BTC) has been trading in a tight range since Thanksgiving Nov. 24, as traders are uncertain about the next directional move. Usually, in a bear market, analysts tend to become uber-bearish and project targets that tend to scare away investors.The failure of Bitcoin to start a strong recovery has given rise to several bearish targets, which extend up to $6,000 on the downside. Although anything is possible in a bear market, traders who have a long-term view could try to accumulate fundamentally strong coins in several tranches. Because a bottom will only be confirmed in hindsight and trying to time it is usually a futile exercise.Crypto market data daily view. Source: Coin360In a bear market, all coins do not bottom at the same time. Hence, along with keeping an eye on the broader cryptocurrency market, traders should closely follow the coins of their choice. The cryptocurrencies that lead the market out of the bear phase generally tend to do well when the next bull market begins. Let’s look at the charts of the cryptocurrencies that are trying to start an up-move in the short term.BTC/USDTBitcoin has been consolidating between $15,588 and $17,622 for the past few days. The relative strength index (RSI) has formed a bullish divergence, suggesting that the selling pressure could be reducing.BTC/USDT daily chart. Source: TradingViewThe relief rally could face stiff resistance in the zone between the 20-day exponential moving average ($17,065) and $17,622. If the price turns down from the overhead zone, the BTC/USDT pair could extend its stay inside the range for some more time.If buyers catapult the price above the overhead zone, it will suggest that the downtrend may be ending. The 50-day simple moving average ($18,600) may act as a minor hurdle but if crossed, the up-move could reach the psychological level of $20,000.Alternatively, if the price turns down from the overhead resistance and breaks below $15,588, it could signal the resumption of the downtrend. The pair could then drop to $13,554.BTC/USDT 4-hour chart. Source: TradingViewThe moving averages on the 4-hour chart have flattened out and the RSI is near the midpoint, indicating a balance between supply and demand. This balance could tilt in favor of the bulls if they push the price above $17,000. The pair could then rise to the overhead resistance at $17,622.Instead, if the price slips below $16,000, the pair could drop to the critical support zone between $15,588 and $15,476. A break below this zone could accelerate selling and start the next leg of the downtrend.DOGE/USDTDogecoin (DOGE) broke above the overhead resistance at $0.09 on Nov. 25 but the bears pulled the price back below the level on Nov. 26. Buyers regrouped and pushed the price above the 38.2% Fibonacci retracement level of $0.10 on Nov. 27.DOGE/USDT daily chart. Source: TradingViewThe bears may again try to stop the recovery near $0.10 but if bulls do not allow the price to break below $0.09, the DOGE/USDT pair could pick up momentum and rally toward the 61.8% Fibonacci retracement level of $0.12. If this level is also scaled, the pair may continue its uptrend toward $0.16.On the other hand, if the price turns down from the current level, it will suggest that bears continue to view the rallies as a selling opportunity. The pair could then decline to $0.09. If this support gives way, the 50-day SMA ($0.08) could be challenged.DOGE/USDT 4-hour chart. Source: TradingViewBuyers have pushed the price above the range, which suggests the start of an up-move. The strong rally pushed the RSI into deeply overbought levels, suggesting a minor correction or consolidation in the near term.If the price turns down from the 38.2% Fibonacci retracement of $0.10 but rebounds off the breakout level, it will suggest that the sentiment has turned positive and traders are buying on dips. The bulls will then try to resume the uptrend. The target objective of the breakout from the range is $0.12.This positive view could invalidate in the near term if the price turns down and re-enters the range. The pair could then drop to the 50-SMA.LTC/USDTLitecoin’s (LTC) breakout above the overhead resistance at $75 is the first indication of a potential trend change. The bears tried to pull the price back below $75 and trap the aggressive bulls but the buyers held their ground. LTC/USDT daily chart. Source: TradingViewThe bulls will try to propel the price above the overhead resistance at $84. If they succeed, it could signal the start of a new uptrend. The rising 20-day EMA ($67) and the RSI near the overbought zone indicate the path of least resistance is to the upside. The LTC/USDT pair could then rally toward the target objective of $104.Conversely, if the price turns down from $84, the pair could slide to the $73 to $75 support zone. If this zone breaks down, the pair could slide to the 20-day EMA. The bears will have to pull the price below this support to trap the aggressive bulls.If the price rebounds off the 20-day EMA, the bulls will again try to kick the pair above $84 and start the uptrend.LTC/USDT 4-hour chart. Source: TradingViewThe 4-hour chart shows that the price broke and closed below the 20-EMA but the bears could not build upon this advantage. The bulls purchased this dip and nudged the price back above the 20-EMA. Both moving averages are sloping up and the RSI is just above the midpoint, indicating that buyers have a slight edge.There is a minor resistance at $80, but if bulls thrust the price above this level, the pair could rise to $84. The pair could then attempt a rally to $96. If bears want to invalidate this view in the short term, they will have to pull the pair below $73.Related: Bitcoin mining revenue lowest in two years, hash rate on the declineLINK/USDTChainlink (LINK) has been range-bound between $5.50 and $9.50 for the past many weeks. The strong rebound off the support at $5.50 on Nov. 21 suggests that bulls are aggressively buying the dips to this level.LINK/USDT daily chart. Source: TradingViewThe 20-day EMA ($6.74) has started to turn up and the RSI has risen into the positive territory, indicating a minor advantage to the bulls. If the price sustains above the 50-day SMA ($7.15), the likelihood of a rally to $8.50, and thereafter to $9.50, increases.Contrary to this assumption, if the price turns down and breaks below the 20-day EMA, it will suggest that bears are active at higher levels. The LINK/USDT pair could then again drop toward the support at $5.50 and consolidate near it for a few more days.LINK/USDT 4-hour chart. Source: TradingViewThe strong rebound off the $5.50 level is nearing the overhead resistance at $7.50. If the price turns down from this level and breaks below the 20-EMA, the pair could drop to the 50-SMA. A break below this support could keep the pair stuck between $5.50 and $7.50 for some time.Another possibility is that the price turns down from $7.50 but rebounds off the 20-EMA. The bulls will then again try to drive the price above $7.50 and start the northward march toward $8.50.APE/USDTApeCoin (APE) has been consolidating in a large range between $3 and $7.80 for the past several months. The bears tried to sink the price below the support of the range but could not sustain the lower levels. This suggests strong demand at lower levels.APE/USDT daily chart. Source: TradingViewSustained buying pushed the price above the 20-day EMA ($3.47) on Nov. 26, indicating that the bulls are on a comeback. There is a minor resistance at the 50-day SMA ($4.06), but if bulls clear this roadblock, the APE/USDT pair could rise to the downtrend line. If the price turns down from the downtrend line, the pair could decline to the 20-day EMA. If the pair rebounds off this level, it will suggest that the sentiment has shifted from selling on rallies to buying on dips. That could improve the prospects of a break above the downtrend line. The pair could then climb to $6.On the contrary, if the price turns down from the downtrend line and breaks below the 20-day EMA, the pair could again slide to the strong support at $3.APE/USDT 4-hour chart. Source: TradingViewThe moving averages on the 4-hour chart have started to turn up and the RSI has jumped into the overbought territory, indicating that bulls have a slight edge. The recovery could face resistance at $4 but if bulls do not allow the price to dip below the moving averages, the up-move may reach the downtrend line.This positive view could be invalidated in the near term if the price turns down and breaks below the 50-SMA. Such a move will suggest that bears continue to sell on rallies. The pair could then drop to $3.The views and opinions expressed here are solely those of the author and do not necessarily reflect the views of Cointelegraph. Every investment and trading move involves risk, you should conduct your own research when making a decision.
Čítaj viac
