Autor Cointelegraph By Rakesh Upadhyay

Price predictions 4/22: BTC, ETH, XRP, BNB, SOL, DOGE, HYPE, ADA, BCH, XMR

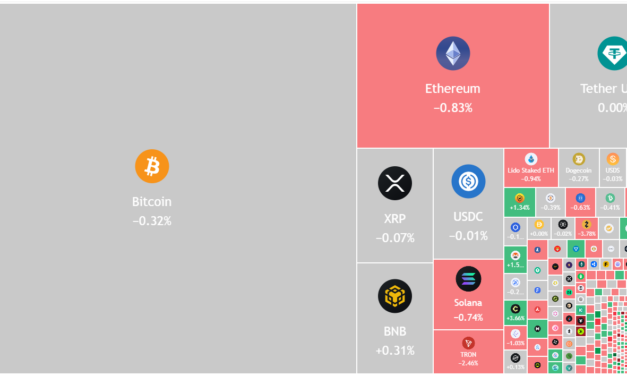
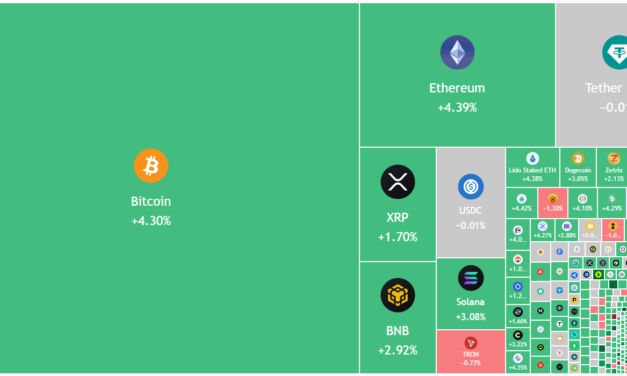
Key points:Bitcoin’s rise above the $78,333 resistance opens the door for a rally to $84,000.Several major altcoins are attempting to rise above their resistance levels, signaling aggressive buying at lower levels.Bitcoin (BTC) rallied above $79,000, indicating that the bulls are back in the game. Crypto market intelligence platform Decode said in a post on X that BTC was ready for a short squeeze, waiting for the bulls to light a fuse in a loaded cannon.Select analysts expect the current relief rally to pick up strength. CryptoQuant analyst CW8900 said in a post on X that BTC’s adjusted Net Unrealized Profit/Loss (NUPL), the difference between total profits and losses currently held by investors, has turned positive. That suggests BTC’s downtrend has ended and the “real rally of this cycle has begun.”Crypto market data daily view. Source: TradingViewThe sharp recovery off the $60,000 level has pushed the Bitcoin Bull Score Index (BSI) into neutral territory for the first time since the bear market began. However, there was a word of caution from CryptoQuant contributor Julio Moreno, who said in a post on X that the BSI had entered neutral territory for a week during March 2022 but had resumed its decline later.Could BTC and select major altcoins extend their recovery? Let’s analyze the charts of the top 10 cryptocurrencies to find out.Bitcoin price predictionBTC turned up from the 20-day exponential moving average ($73,758) on Monday and rose above the $78,333 level on Wednesday, indicating an advantage to the bulls. BTC/USDT daily chart. Source: Cointelegraph/TradingViewIf the BTC price remains above the $78,333 level, the likelihood of a rally to $84,000 increases. Such a move suggests that the BTC/USDT pair may have bottomed out at $60,000.The 20-day EMA is the critical level to watch out for on the downside. Sellers will have to pull the price below the 20-day EMA to invalidate the bullish setup. The pair may then collapse to the 50-day simple moving average ($70,934).Ether price predictionEther (ETH) rebounded off the 20-day EMA ($2,273) on Monday, indicating a change in sentiment from selling on rallies to buying on dips.ETH/USDT daily chart. Source: Cointelegraph/TradingViewThe upsloping moving averages and the RSI in the positive zone signal that the path of least resistance is to the upside. If buyers clear the $2,465 hurdle, the ETH/USDT pair may surge toward the resistance level and then toward $2,800.The first sign of weakness will be a break and close below the 20-day EMA. That signals the bulls are booking profits. The ETH price may then slump to the 50-day SMA ($2,157) and later to the support line.XRP price predictionXRP (XRP) turned up from the moving averages on Monday, indicating that the bulls are viewing the dips as a buying opportunity.XRP/USDT daily chart. Source: Cointelegraph/TradingViewBuyers will attempt to push the XRP price to the downtrend line of the descending channel pattern, where the bears are expected to sell aggressively. If the price turns sharply down from the downtrend line, it suggests that the XRP/USDT pair may spend more time inside the channel.Buyers will get back into the driver’s seat if they propel and sustain the price above the downtrend line. The pair may then climb to the $2 level, signaling a short-term trend change.BNB price predictionBNB (BNB) turned up from the 20-day EMA ($623) on Monday and rose above the $649 resistance on Wednesday. BNB/USDT daily chart. Source: Cointelegraph/TradingViewIf buyers sustain the price above $649, the BNB/USDT pair may surge toward $687. Sellers are expected to mount a strong defense at $687, but if the bulls pierce the resistance, the recovery may extend to $790.On the other hand, if the BNB price turns sharply lower from the overhead resistance and breaks below the moving averages, it suggests the pair may remain within the $687 to $570 range for a while longer.Solana price predictionSolana (SOL) continues to trade near the moving averages, indicating a balance between supply and demand.SOL/USDT daily chart. Source: Cointelegraph/TradingViewIf the price rises above $91, the SOL/USDT pair may climb to the overhead resistance at $98. Sellers are expected to fiercely defend the $98 level, but if the bulls prevail, the uptrend may reach $117.Alternatively, if the SOL price turns down from the overhead resistance and breaks below the moving averages, it suggests that the range-bound action may extend for a few more days.Dogecoin price predictionDogecoin (DOGE) turned up from the moving averages on Monday, indicating that the bulls are attempting a comeback.DOGE/USDT daily chart. Source: Cointelegraph/TradingViewThe DOGE price may rise to the psychological level of $0.10, where the bears are expected to step in. However, if buyers do not give up much ground to the bears, the prospects of a rally to the $0.12 overhead resistance increase.Time is running out for the bears. They will have to swiftly pull the price back below the $0.09 level to retain the advantage. If they do that, the DOGE/USDT pair may slump to the Feb. 6 low of $0.08.Hyperliquid price predictionHyperliquid (HYPE) bounced off the 50-day SMA ($38.41) on Tuesday, indicating that the bulls are buying the dips.HYPE/USDT daily chart. Source: Cointelegraph/TradingViewThe 20-day EMA ($40.90) is flattening, and the RSI is near the midpoint, indicating weakening bullish momentum. That increases the likelihood of a range formation in the near term.The 50-day SMA is the crucial support to watch out for on the downside, as a close below it may deepen the pullback to $34.45. On the upside, bulls will need to push the HYPE/USDT pair above $45.77 to signal a resumption of the uptrend. Related: ‘Powerful move’ looms for Bitcoin price, says Bollinger Bands indicatorCardano price predictionCardano (ADA) has risen to the stiff resistance zone between the 50-day SMA ($0.26) and the downtrend line.ADA/USDT daily chart. Source: Cointelegraph/TradingViewIf buyers push and sustain the ADA price above the downtrend line, it signals a potential short-term trend change. The ADA/USDT pair may then rally to $0.32, then to $0.37.On the other hand, if the price turns sharply down from the downtrend line and breaks below the $0.22 level, it suggests the pair may remain within the descending channel for some time.Bitcoin Cash price predictionBitcoin Cash (BCH) has broken above the 50-day SMA ($454), indicating solid demand at lower levels.BCH/USDT daily chart. Source: Cointelegraph/TradingViewThe moving averages are on the verge of a bullish crossover, indicating that the bulls have the upper hand. Buyers will attempt to strengthen their position by pushing the BCH price above the $486 resistance. If they succeed, the BCH/USDT pair may rally to $520. Contrary to this assumption, if the price turns down from the current level or the overhead resistance and breaks below the moving averages, it suggests that the pair may form a range for some time.Monero price predictionMonero (XMR) surged and closed above $382 on Tuesday, but bulls are struggling to sustain the gains.XMR/USDT daily chart. Source: Cointelegraph/TradingViewIf the price remains above the $382 level, the XMR/USDT pair may initiate a new uptrend toward the pattern’s target of $462.Contrary to this assumption, if the XMR price closes below $382, it suggests that the bears are selling on rallies. The pair may then pull back to the moving averages, which are likely to act as strong support. If the price rebounds off the moving averages, the bulls will again attempt to initiate the uptrend.

Čítaj viac

Price predictions 4/20: SPX, DXY, BTC, ETH, BNB, XRP, SOL, DOGE, HYPE, ADA

Key points:Buyers aggressively bought into the dip in Bitcoin, indicating positive sentiment. That increases the possibility of a rally to $84,000.Several major altcoins have pulled back to their support levels, signaling that the bears remain sellers on rallies.Bitcoin (BTC) corrected over the weekend but is finding buyers at lower levels, indicating a positive sentiment. According to SoSoValue data, US spot BTC exchange-traded funds recorded $996 million in inflows last week, the best weekly performance since early January. The cryptocurrency recovery may be at risk if the US and Iran do not reach a deal before the two-week ceasefire ends on Wednesday, or if the ceasefire is not extended. Trading resource Mosaic Asset Company said in its newsletter that “intensifying hostilities could unwind the bullish action over the past few weeks.”Crypto market data daily view. Source: TradingViewHowever, the short-term uncertainty could not stop Michael Saylor’s Strategy from adding more BTC to its portfolio. The BTC treasury company purchased 34,164 BTC between April 13 and April 19 for $2.54 billion, according to an 8-K filing with the US Securities and Exchange Commission on Monday. That boosted Strategy’s holdings to 815,061 BTC acquired for $61.56 billion.Could buyers resume the relief rally in BTC and the major altcoins? Let’s analyze the charts of the top 10 cryptocurrencies to find out. S&P 500 Index price predictionThe S&P 500 Index (SPX) rallied sharply last week, rising to a new all-time high of 7,147 on Friday.SPX daily chart. Source: Cointelegraph/TradingViewThe sharp upward move propelled the relative strength index (RSI) into overbought territory, suggesting the index is at risk of a minor consolidation or pullback in the short term. The first support on the downside is at the breakout level of 7,002, followed by the 20-day exponential moving average (6,828). If the price rebounds off the 20-day EMA, it signals that the uptrend remains intact.Sellers have an uphill task ahead of them. They will have to swiftly yank the price below the moving averages to signal a comeback. US Dollar Index price predictionThe US Dollar Index (DXY) turned down sharply from the 20-day EMA (98.73) on April 13 and dropped to the 97.74 support on Friday.DXY daily chart. Source: Cointelegraph/TradingViewThe index is attempting to initiate a relief rally but is expected to encounter selling pressure at the 20-day EMA. If the price again turns down from the 20-day EMA, the possibility of a break below the 97.74 level increases. That may sink the price to the 96.21 support.The index is likely to remain inside the 95.55 to 100.54 range for a while longer. The next trending move is expected to begin on a close above the 100.54 resistance or below the 95.55 support.Bitcoin price predictionBTC has bounced off the 20-day EMA ($72,832), suggesting the bulls are seeing dips as buying opportunities.BTC/USDT daily chart. Source: Cointelegraph/TradingViewThe bears are unlikely to give up easily and will attempt to halt the recovery in the $76,000 to $78,333 zone. If the BTC price turns down from the overhead zone and breaks below the moving averages, it suggests that the market has rejected the breakout.On the other hand, a break and close above the overhead resistance zone signals the resumption of the up move. The BTC/USD pair may then skyrocket to $84,000 and eventually to the pattern target of $92,000.Ether price predictionBuyers tried to push Ether (ETH) above the $2,415 level on Saturday, but the bears held their ground. That started a pullback to the 20-day EMA ($2,252).ETH/USDT daily chart. Source: Cointelegraph/TradingViewBuyers will have to fiercely defend the 20-day EMA and secure a close above the $2,415 level to signal the resumption of the relief rally. If they do that, the ETH/USDT pair may march to the $2,800 level.Sellers are likely to have other plans. They will attempt to push the ETH price below the moving averages, keeping the pair within the $1,916 to $2,415 range for some time.BNB price predictionBNB (BNB) continues to oscillate between $570 and $687, signaling a balance between supply and demand.BNB/USDT daily chart. Source: Cointelegraph/TradingViewThe flattish moving averages and the RSI near the midpoint do not signal an advantage either to the bulls or the bears. If the BNB price breaks above $650, the next target is likely $687.Instead, if the price breaks below the 20-day EMA, the BNB/USDT pair may plunge toward the range’s support at $570. The next trending move is expected to begin on a close above $687 or below $570.XRP price predictionXRP (XRP) has been consolidating between the $1.27 support and the $1.61 resistance for several days.XRP/USDT daily chart. Source: Cointelegraph/TradingViewThe flattish moving averages and the RSI just above the midpoint suggest that the range-bound action may extend for a few more days. Buyers will have to achieve a close above the downtrend line to signal a potential trend change. The XRP price may then surge to $2.On the downside, a break and close below the $1.27 level signals that the bears are back in the driver’s seat. There is support at the $1.11 level, but that may be broken. The XRP/USDT pair may then tumble toward the support line of the descending channel pattern.Solana price predictionSolana (SOL) fell below its moving averages on Sunday, suggesting that higher levels are attracting sellers.SOL/USDT daily chart. Source: Cointelegraph/TradingViewThe flattish moving averages and the RSI near the midpoint indicate that the range-bound action may continue for a while. If the price remains below the moving averages, bears will attempt to push the SOL/USDT pair toward the $76 support.Buyers will have to push the SOL price above the $90 level to open the door to a rally toward the $98 resistance. A close above the $98 level suggests the start of a sustained recovery to the $117 level.Related: Bitcoin daily gains near 3% as stocks ignore US-Iran war threat, oil dropsDogecoin price predictionDogecoin (DOGE) turned down from the $0.10 psychological level on Friday and has fallen to the moving averages.DOGE/USDT daily chart. Source: Cointelegraph/TradingViewThe flat moving averages and the RSI near the midpoint do not give either buyers or sellers a clear advantage. If the DOGE price breaks below the moving averages, the $0.09 support may be tested. A break below the $0.09 level may start the next leg of the downward move to $0.08 and subsequently to $0.06.Buyers will have to push the price above the $0.10 level and maintain it to signal strength. The DOGE/USDT pair may then climb toward the $0.12 resistance level, where bears are expected to step in.Hyperliquid price predictionHyperliquid (HYPE) fell back below the breakout level of $43.76 after staying above it for several days.HYPE/USDT daily chart. Source: Cointelegraph/TradingViewThe bulls are attempting to halt the pullback at the 20-day EMA ($41.03), but the bears continue to exert pressure. If the 20-day EMA gives way, the HYPE/USDT pair may plummet toward the 50-day SMA ($38.09) and then toward $34.45.On the contrary, a bounce off the 20-day EMA suggests that the lower levels continue to attract buyers. The bulls will then attempt to drive the HYPE price above the $45.77 level again. If they succeed, the pair may skyrocket to the $50-$51.43 zone.Cardano price predictionCardano (ADA) rose above the 50-day SMA ($0.26) on Friday, but the bulls could not sustain the higher levels.ADA/USDT daily chart. Source: Cointelegraph/TradingViewThe ADA/USDT pair turned lower on Saturday, falling below the $0.25 level. Sellers will attempt to strengthen their position by driving the ADA price below $0.23. If they manage to do that, the pair may resume its downtrend to $0.22 and later to the support line of the descending channel pattern.Buyers will have to push the price above the downtrend line and maintain it there to signal a potential short-term trend change. The pair may then rise to $0.32, then to $0.37.

Čítaj viac

Získaj BONUS 8 € v Bitcoinoch

nakup bitcoin z karty

Registrácia Binance

Burza Binance

Aktuálne kurzy