Autor Cointelegraph By Rakesh Upadhyay

Price predictions 6/3: BTC, ETH, BNB, XRP, SOL, HYPE, DOGE, ZEC, ADA, XLM

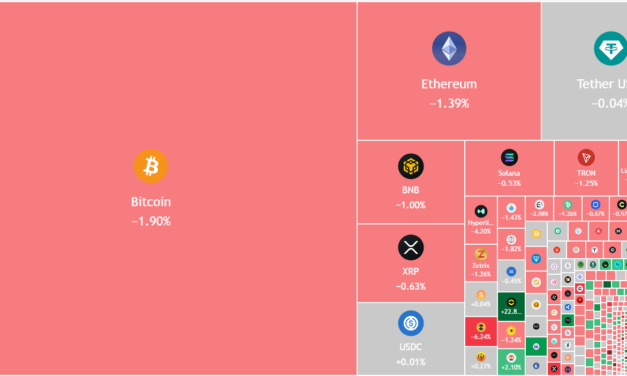
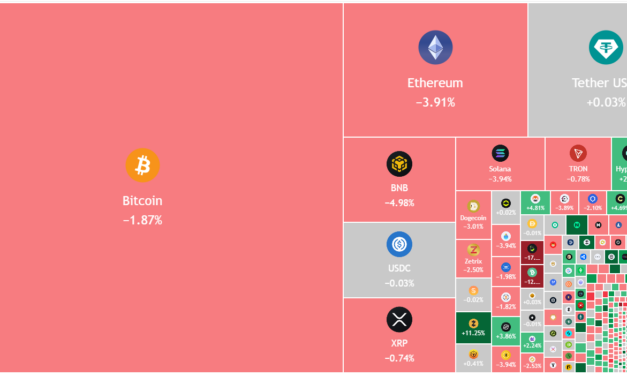
Key points:Bitcoin risks falling below $65,000, but lower levels are likely to attract solid buying by the bulls.HYPE, ZEC and XLM look strong on the charts while other major altcoins risk resuming their downtrend.Bitcoin (BTC) is attempting a bounce off the $65,426 level, but the bulls are struggling to hold onto higher levels. The launch of fresh strikes by the US and Iran has hurt sentiment, but Bitrue Research Institute research lead Andri Fauzan Adziima told Cointelegraph that the fall was more about “leveraged liquidations, heavy ETF outflows, and technical breakdowns than pure Iran news, but it amplifies the fear.”All eyes have shifted to BTC’s yearly lows of $60,000. Veteran trader Peter Brandt said in a post on X that BTC has formed an expanding triangle, a common and reliable pattern. He projects a decline to about $56,000, but added that a move above $75,000 would invalidate this bearish view.Crypto market data daily view. Source: TradingViewThe short-term trend has turned negative, but the bulls are unlikely to give up without a fight. Buyers are expected to enter the $65,000 to $60,000 zone, but relief rallies are likely to be sold into. Volatility is likely to increase over the next few days as the bulls and bears battle for supremacy. Buyers will have to propel the price above $77,000 to signal that BTC has bottomed out in the short term. What are the crucial support levels to watch out for in BTC and the major altcoins? Let’s analyze the charts of the top 10 cryptocurrencies to find out.Bitcoin price predictionBTC collapsed after breaking below the support line on Tuesday, indicating aggressive liquidation of long positions.BTC/USDT daily chart. Source: Cointelegraph/TradingViewThere is support at $65,000, but that may not hold. That clears the path for a drop to the $62,500 to $60,000 support zone. Buyers are expected to defend the zone with all their might, as a close below it would signal a resumption of the downtrend. The BTC/USDT pair then risks falling to $50,000.The bears will attempt to maintain their advantage by selling the relief rallies to the 20-day exponential moving average ($74,064). Buyers will have to secure a close above the 50-day simple moving average ($76,966) to signal a comeback.Ether price predictionEther’s (ETH) $1,916 to $2,465 range resolved to the downside on Tuesday, indicating that the bears are in control.ETH/USDT daily chart. Source: Cointelegraph/TradingViewThe ETH/USDT pair may dip to the solid support at $1,750. The oversold level on the relative strength index (RSI) suggests a bounce is possible from $1,750, but rallies are likely to be sold into. A shallow rebound increases the possibility of a break below the $1,750 level. If that happens, the ETH price may plummet to $1,550.Buyers have an uphill task ahead of them. They will have to swiftly push and sustain the price above the 20-day EMA ($2,056) to suggest that selling pressure is easing. The pair may then rise to the 50-day SMA ($2,218).BNB price predictionBNB (BNB) fell below the breakout level of $687 on Monday and extended its decline to the 50-day SMA ($645) on Tuesday.BNB/USDT daily chart. Source: Cointelegraph/TradingViewThe drop back below $687 may have trapped the aggressive bulls. The $628 level may act as a temporary support, but it is likely to be broken. If that happens, the BNB/USDT pair may plummet to solid support at $570.This negative view will be invalidated in the near term if the BNB price turns up sharply from the current level and breaks above $745. That signals solid demand at lower levels. The pair may then march to $790 and later to $900.XRP price predictionXRP (XRP) broke below the strong support of $1.27 on Tuesday, indicating that the bears are in charge.XRP/USDT daily chart. Source: Cointelegraph/TradingViewThe next support on the downside is the Feb. 6 intraday low of $1.11. Buyers are expected to fiercely defend the $1.11 level, as a close below it signals the start of the next leg of the downtrend to $1.On the way up, the downtrend line is the first hurdle for the bulls to overcome. If they clear that, the XRP/USDT pair may climb to $1.61. Sellers are expected to pose a substantial challenge at the $1.61 level, but if the bulls prevail, a new up move may begin.Solana price predictionSolana (SOL) closed below the $76 support on Tuesday, indicating that the bears have overpowered the bulls.SOL/USDT daily chart. Source: Cointelegraph/TradingViewThe bulls will attempt to push the SOL price back above $76, but are expected to face significant resistance from the bears. If the price declines from $76, the next stop is likely the Feb. 6 low of $67. Buyers will strive to hold the $67 level, as a close below it may sink the SOL/USDT pair to $60.Buyers will have to drive and maintain the price above the moving averages to suggest that the break below $76 may have been a bear trap.Hyperliquid price predictionHyperliquid (HYPE) has held strong among all the mayhem, signaling that the bulls expect the uptrend to continue.HYPE/USDT daily chart. Source: Cointelegraph/TradingViewProfit-booking was seen near $75, but the shallow pullback suggests the bulls view the dips as buying opportunities. If buyers push the HYPE price above $75, the rally could reach the $85-$89 zone.The first support on the downside is $64, and then the breakout level of $59.41. If the HYPE/USDT pair rebounds off $59.41, it suggests that the bulls have flipped the level into support. The buyers will then again attempt to resume the uptrend.Dogecoin price predictionDogecoin (DOGE) has dipped to the support of the $0.09 to $0.12 range, where buyers are expected to step in.DOGE/USDT daily chart. Source: Cointelegraph/TradingViewIf the DOGE price turns up from the current level, the bears will attempt to halt the recovery at the 20-day EMA ($0.10). If the price turns down sharply from the 20-day EMA, the risk of a break below $0.09 increases. The DOGE/USDT pair may then slump to $0.08.This negative view will be invalidated in the near term if the price rises above the moving averages. That suggests the pair may extend its stay inside the range for a few more days. Related: Bitcoin copying 2022 ‘almost perfectly’ as trader sees key support failingZcash price predictionZcash (ZEC) turned up and closed above the 20-day EMA ($568) on Tuesday, indicating buying at lower levels.ZEC/USDT daily chart. Source: Cointelegraph/TradingViewThe bulls will have to drive and maintain the ZEC price above $690 to signal the resumption of the uptrend. If they manage to do that, the ZEC/USDT pair may rally to $750, where the bears are expected to mount a strong defense. However, if buyers overcome the barrier, the pair may soar to $856.Sellers are likely to have other plans. They will attempt to pull the price below the neckline of the developing head-and-shoulders pattern. A close below the neckline signals that the pair may have topped out in the short term.Cardano price predictionCardano (ADA) continued lower, plunging below the $0.22 support on Tuesday, signaling the resumption of the downtrend. ADA/USDT daily chart. Source: Cointelegraph/TradingViewThe RSI has slipped into oversold territory, increasing the likelihood of consolidation or a relief rally in the near term. Any recovery attempt is expected to face selling at $0.22 and then at the 20-day EMA ($0.24). If the ADA price breaks down from the overhead resistance, the bears will attempt to pull the ADA/USDT pair down to $0.20.Buyers will be back in the driver’s seat on a close above the 50-day SMA ($0.25). That suggests the market rejected the break below $0.22.Stellar price predictionStellar (XLM) has been in a bull phase of its own, rising from $0.14 on May 23 to $0.30 on May 30. XLM/USDT daily chart. Source: Cointelegraph/TradingViewThe sharp rally prompted profit-booking by short-term traders, pulling the XLM price down to the 50% Fibonacci retracement level at $0.22. If the price rises from the current level, the bulls will attempt to push the XLM/USDT pair above $0.27 and then $0.30. If they succeed, the pair may surge to $0.35.Contrary to this assumption, if the price declines and breaks below the 61.8% retracement level at $0.20, it suggests the pair may have topped out in the near term.

Čítaj viac

Price predictions 5/27: BTC, ETH, BNB, XRP, SOL, DOGE, HYPE, ZEC, ADA, XMR

Key points:Bitcoin is under pressure as net outflows from the BTC ETFs highlight a shift in institutional investor sentiment.Most major altcoins look weak, suggesting the bears are in control.Bitcoin (BTC) fell below $75,000 on Wednesday, indicating that the bears are slowly taking charge of the crypto market. Institutional investors seem to be on a selling spree, with BTC exchange-traded funds recording net outflows of $1.88 billion since May 15, per Farside Investors’ data. Glassnode said in a post on X that persistent net outflows from BTC ETFs on nearly every trading day since May 7 add “to the supply side without a visible demand offset.”BTC’s weakness has sent it tumbling below its long-term valuation average, according to Bitwise. The asset management firm said in a recent report that in the past, only 36% of BTC’s market-value-to-realized-value (MVRV) readings were lower than the current level of 1.42. In comparison, roughly 99% of historical Nasdaq-100 price-to-book ratios were below their present levels, signaling the widest valuation gap on record between BTC and US tech stocks.Crypto market data daily view. Source: TradingViewWhile others panic, a whale has used the drop as a buying opportunity. Blockstream CEO Adam Back said in a post on X that a BTC whale had hoovered up 450 “cheap Bitcoins” per day for the past eight and a half days using a time-weighted average price method.Could BTC and select major altcoins bounce off their strong support levels? Let’s analyze the charts of the top 10 cryptocurrencies to find out.Bitcoin price predictionBTC turned down from the 20-day exponential moving average ($77,431) on Tuesday, signaling that the bears are selling on minor relief rallies.BTC/USDT daily chart. Source: Cointelegraph/TradingViewThe bulls will attempt to defend the crucial $76,000 to $74,289 support zone, while the bears will strive to pull the BTC price below it. If the support zone crumbles, the short-term advantage will tilt in favor of the bears. The BTC/USDT pair may then descend to the support line near $70,500, which is likely to attract buyers.On the contrary, if the price bounces off the support zone, the bulls will again strive to drive the pair above the 20-day EMA. If they succeed, the pair may rally to $82,000 and then to $84,000.Ether price predictionBuyers have failed to push Ether (ETH) back above the support line, indicating that the bears are attempting to flip the level into resistance. ETH/USDT daily chart. Source: Cointelegraph/TradingViewThere is psychological support at $2,000, but if that level cracks, the ETH/USDT pair may decline to the $1,916-$1,750 zone.Buyers have an uphill task ahead of them. They will have to push the ETH price above the moving averages to signal strength. If they do that, it suggests that the market has rejected the breakdown below the channel. That increases the likelihood of a rally to $2,465, then to the channel’s resistance line.BNB price predictionBuyers are attempting to sustain BNB (BNB) above the 20-day EMA ($652), but the bears have kept up the pressure.BNB/USDT daily chart. Source: Cointelegraph/TradingViewIf the 20-day EMA gives way, the bears will strive to strengthen their position by pulling the BNB price below the 50-day SMA ($636). If they can pull it off, the BNB/USDT pair may tumble to $610, then to $570.Conversely, if the price rebounds off the moving averages, it suggests demand at lower levels. The bulls will then again endeavor to clear the $687 overhead hurdle. If they do that, the pair may rally to $730 and then to $790.XRP price predictionXRP (XRP) continues to gradually slide toward the $1.27 support, indicating that the bears remain in control. XRP/USDT daily chart. Source: Cointelegraph/TradingViewBuyers are expected to mount a strong defense at $1.27, but the relief rally is likely to face selling at the 20-day EMA ($1.37) and then at the downtrend line. If the XRP price declines sharply from the 20-day EMA, it increases the likelihood of a break below $1.27. If that happens, the XRP/USDT pair may plunge to $1.11 and then to $1.The first sign of strength will be a break and close above the downtrend line. The pair may then climb to the $1.61 resistance. Buyers will have to pierce the $1.61 level to signal a potential trend change.Solana price predictionSolana’s (SOL) has been getting squeezed between the 20-day EMA ($86.42) and the $82.65 support.SOL/USDT daily chart. Source: Cointelegraph/TradingViewThe 20-day EMA has started to turn down, and the RSI is in the negative territory, indicating a slight edge to the bears. If the price breaks below $82.65, the SOL/USDT pair may plummet to the $76 support.Alternatively, if the SOL price rises sharply from the $82.65 level and breaks above the 20-day EMA, it suggests the pair may remain within the $76 to $98 range for a while longer.Dogecoin price predictionThe failure of the bulls to push Dogecoin (DOGE) above the 20-day EMA ($0.10) suggests a negative sentiment.DOGE/USDT daily chart. Source: Cointelegraph/TradingViewSellers are attempting to sink the DOGE price below $0.10, opening the door to a retest of $0.09 support. Buyers are expected to defend the $0.09 level with all their might, as a close below it may sink the DOGE/USDT pair to $0.08.Contrary to this assumption, if the price rises and closes above the 20-day EMA, it suggests the pair may extend its range-bound action between $0.09 and $0.12 for a few more days. Buyers will have to secure a close above $0.12 to start a new uptrend toward $0.14 and then $0.16.Hyperliquid price predictionHyperliquid (HYPE) pulled back from $64.93 on Monday, signaling profit-booking by short-term traders.HYPE/USDT daily chart. Source: Cointelegraph/TradingViewThe bulls are attempting to arrest the pullback at the breakout level of $59.41. If they succeed, it suggests that the bulls have flipped the level into support. That improves the prospects of a break above the $64.93 level. The HYPE/USDT pair may then surge toward $77.Instead, if the HYPE price breaks below $59.41, the correction may deepen to the 20-day EMA ($52.14). Buyers are expected to fiercely defend the 20-day EMA, as a slide below it would signal the start of a deeper correction toward the 50-day SMA ($44.92).Related: Three key XRP metrics suggest ‘explosive price expansion’ is nextZcash price predictionZcash (ZEC) declined from the $690 level on Monday, indicating profit-taking by short-term traders.ZEC/USDT daily chart. Source: Cointelegraph/TradingViewSellers are attempting to sustain the price below the 20-day EMA ($571), opening the door to a deeper correction. If they manage to do that, the ZEC price may plummet to $486 and then to the 50-day SMA ($457). The 20-day EMA is flattening, and the RSI has dropped toward the midpoint, indicating that the bulls are losing their grip. Buyers will have to thrust the ZEC/USDT pair above $690 to seize control.Cardano price predictionCardano (ADA) remains below its moving averages, indicating that the bears have the advantage.ADA/USDT daily chart. Source: Cointelegraph/TradingViewSellers will endeavor to pull the ADA price to the $0.22 support. Any attempt by the bulls to start a recovery is expected to face strong selling at the 20-day EMA ($0.25). If the price declines sharply from the 20-day EMA, it increases the risk of a break below $0.22.On the upside, a break and close above the moving averages suggests that the ADA/USDT pair may continue to oscillate inside the $0.22 to $0.31 range for some more time. The next trending move is expected to begin on a close above $0.31 or below $0.22.Monero price predictionMonero (XMR) has been trading within an ascending channel, suggesting buyers have the edge. XMR/USDT daily chart. Source: Cointelegraph/TradingViewThe XMR price has bounced off the 50-day SMA ($378), indicating buying on dips. There is resistance at the downtrend line, but if the level is breached, the XMR/USDT pair may rise toward the resistance line. The bullish momentum may pick up if buyers drive and maintain the price above the resistance line.Contrarily, if the price turns down from the downtrend line and breaks below the 50-day SMA, it suggests that the bears are selling on rallies. The pair may then drop to the support line.

Čítaj viac

Price predictions 5/25: SPX, DXY, BTC, ETH, XRP, BNB, SOL, DOGE, HYPE, ZEC

Key points:Bitcoin needs to cross and maintain above $78,000 to start a stronger recovery toward $84,000.HYPE and ZEC remain strong while other major altcoins struggle to rise above their overhead resistance levels. Bitcoin (BTC) bounced on Saturday following US President Donald Trump’s announcement in a post on his Truth Social platform that negotiations between the US and Iran were “proceeding in an orderly and constructive manner.” Buyers extended the recovery on Monday and are attempting to sustain above $77,500.The uncertainty of the past few days has resulted in $1.55 billion in net outflows from the US BTC exchange-traded funds. Crypto sentiment platform Santiment said in a report on Friday that sharp outflows from BTC ETFs indicate retail capitulation, which has “historically correlated with conditions favorable for patient accumulation” for long-term holders rather than panic. Crypto market data daily view. Source: TradingViewCryptoQuant analyst Darkfost said in a post on X that BTC’s apparent demand has dropped to about -147,000 BTC, the most bearish since December 2025. That suggests a sustainable rally would be difficult without the support of genuine spot demand. However, the analyst added that the current environment creates “interesting opportunities for long-term investors capable of remaining patient.”Could BTC and the major altcoins break above their overhead resistance levels? Let’s analyze the charts of the top 10 cryptocurrencies to find out. S&P 500 Index price predictionThe S&P 500 Index (SPX) rallied toward the all-time high of 7,517 on Friday, indicating that buyers remain in command.SPX daily chart. Source: Cointelegraph/TradingViewIf the price rises and maintains above 7,500, the index may start the next leg of the uptrend toward the 8,000 level. The first sign of weakness will be a break and close below the 20-day exponential moving average (7,324). Such a move suggests that the short-term traders are booking profits. That may start a deeper correction to 7,180 and then the breakout level of 7,002. Until then, all dips are likely to be viewed as a buying opportunity.US Dollar Index price predictionThe US Dollar Index (DXY) turned down from 99.51 on Thursday, indicating that the sellers are active at higher levels.DXY daily chart. Source: Cointelegraph/TradingViewThe 20-day EMA (98.80) is expected to act as a strong support on the way down. If the price rebounds off the 20-day EMA with strength, it increases the likelihood of a rally above the 99.51 level. The index may then climb to the stiff overhead resistance at 100.54. Buyers will have to pierce the 100.54 level to signal the start of a new up move.Sellers are likely to have other plans. They will attempt to pull the price below the 20-day EMA, opening the door to a drop toward the 97.74 support.Bitcoin price predictionBTC closed below the $76,000 support level on Friday, but the bulls bought the dip and reclaimed it on Saturday. That shows demand at lower levels.BTC/USDT daily chart. Source: Cointelegraph/TradingViewSellers are attempting to stall the relief rally at the 20-day EMA ($77,893), but the bulls continue to exert pressure. If buyers propel the price above the 20-day EMA, the BTC/USDT pair may climb to $80,000 and eventually to $84,000.Contrary to this assumption, if the BTC price declines and breaks below $74,289, it suggests the bears are attempting to take charge. The pair may then slide toward the support line, which is likely to attract buyers.Ether price predictionBuyers are attempting to push Ether (ETH) back into the ascending channel pattern, but the bears have held their ground.ETH/USDT daily chart. Source: Cointelegraph/TradingViewThe downsloping 20-day EMA ($2,184) and the relative strength index (RSI) in the negative zone indicate a slight edge to the bears. If the price drops below the 20-day EMA, the ETH/USDT pair may dip to the psychological level of $2,000, then to $1,916.This negative view will be invalidated in the near term if the bulls push ETH price above the moving averages and hold. If that happens, it suggests that the market rejected the break below the support line. The pair may then ascend to the $2,465 resistance.XRP price predictionXRP (XRP) continues to trade below the moving averages, indicating that the bears remain in control.XRP/USDT daily chart. Source: Cointelegraph/TradingViewSellers will attempt to strengthen their position by pushing the XRP price below the $1.27 support level. If they manage to do that, the XRP/USDT pair may plummet to $1.11, then to the psychological support level at $1.Buyers will have to achieve a close above the downtrend line of the descending channel pattern to signal a comeback. If they do that, the pair may rise to the $1.61 overhead resistance. A close above $1.61 signals a potential trend change.BNB price predictionBNB (BNB) dipped below the 20-day EMA ($652) on Saturday, but the long tail on the candlestick shows buying near the 50-day SMA ($635).BNB/USDT daily chart. Source: Cointelegraph/TradingViewThe flattish 20-day EMA and the RSI just above the midpoint give a slight edge to the bulls. Buyers will have to secure a close above the $687 resistance to signal the start of a new uptrend toward $730, and subsequently toward $790.Instead, if the BNB price declines from the $687 level and breaks below the 50-day SMA, it suggests the bears have not given up. The BNB/USDT pair may then extend its stay inside the $570 to $687 range for some more time.Solana price predictionSolana (SOL) bounced off the $82.65 support on Saturday, but the bulls are struggling to clear the 20-day EMA ($87.12) hurdle.SOL/USDT daily chart. Source: Cointelegraph/TradingViewIf the price drops below the 20-day EMA, sellers will again attempt to push the SOL/USDT pair below the $82.65 support. If they can pull it off, the SOL price may plummet to the $76 support. Buyers are expected to aggressively defend the $76 level, as a close below it may sink the pair to $67.On the upside, a break and close above the 20-day EMA suggests selling pressure is easing. The pair may then attempt a rally to the $98 level, where the bears are expected to mount a strong defense.Related: XRP price in ‘value zone’ near $1.40 as whales pull $170M from exchangesDogecoin price predictionBuyers are attempting to maintain Dogecoin (DOGE) above the 50-day SMA ($0.10), but the bears have kept up the pressure.DOGE/USDT daily chart. Source: Cointelegraph/TradingViewThe downsloping 20-day EMA ($0.10) and the RSI in the negative territory indicate an advantage to bears. A close below the 50-day SMA clears the path for a drop to the $0.09 level. Buyers will attempt to keep the DOGE price within the $0.09 to $0.12 range by defending the support level.Alternatively, a close above the 20-day EMA signals buying at lower levels. The DOGE/USDT pair may then rally to the $0.12 resistance. A close above the $0.12 level clears the path for a new up move.Hyperliquid price predictionHyperliquid (HYPE) rallied to a new all-time high of $64.72 on Sunday, indicating that the bulls remain in control.HYPE/USDT daily chart. Source: Cointelegraph/TradingViewThe HYPE/USDT pair pulled back on Monday, but the long tail on the candlestick shows that the bulls continue to buy the dips. That increases the possibility of a resumption of the uptrend toward the next target objective at $77.The first support on the downside is the breakout level at $59.41, followed by $54.07. A break and close below the $54.07 level may start a deeper correction to the 20-day EMA ($50.54) and then the 50-day SMA ($44.05). Zcash price predictionZcash (ZEC) turned up sharply from the 20-day EMA ($572) on Saturday, indicating a positive sentiment.ZEC/USDT daily chart. Source: Cointelegraph/TradingViewA minor negative for the bulls is the developing negative divergence on the RSI. That suggests the bullish momentum may be weakening. Sellers will have to tug the ZEC price below the 20-day EMA to start a deeper correction toward $487.This negative view will be invalidated in the near term if the ZEC/USDT pair continues higher and closes above $690. That clears the path for a rally to $750, likely to attract aggressive selling from the bears.

Čítaj viac

Price predictions 5/22: BTC, ETH, BNB, XRP, SOL, DOGE, HYPE, ADA, ZEC, BCH

Key points:Bitcoin has dipped below $77,000, signaling that the bears are poised to seize control.Altcoins are a mixed bag, with some attempting to push through the overhead resistance while others struggle to hold on to the support.Bitcoin (BTC) has dipped below $77,000, indicating that the bears are attempting to seize control. Glassnode said the true market mean at $78,300 has historically acted as a dividing line between bear and bull market regimes. If the price breaks sharply below the level, it suggests that the recent rally may have been a “local top within the ongoing bear market.”Institutional investors seem to be selling, as evidenced by the sharp decline in the Coinbase premium over the past few days. LVRG research director Nick Ruck told Cointelegraph that the decline of the Coinbase premium signals selling from large holders, which “could weigh on near-term price momentum across major crypto assets.”Crypto market data daily view. Source: TradingViewWhat is the crucial level that suggests the bulls are back in command? Independent analyst Filbfilb said in a post on X that the previous two bear markets had ended after “a >+20% weekly candle and a break of the weekly super trend.” If the current bear trend has to fail, BTC has to rise above the super trend level at $88,000.Could BTC and select major altcoins hold on to their strong support levels? Let’s analyze the charts of the top 10 cryptocurrencies to find out.Bitcoin price predictionBTC turned down at the 20-day exponential moving average ($78,280), suggesting the bears are attempting to take charge.BTC/USDT daily chart. Source: Cointelegraph/TradingViewThe $76,000 level is the critical support to watch on the downside, as a close below it would signal an advantage to the bears. That increases the risk of a drop to the support line, which is likely to attract buyers.Time is running out for the bulls. They will have to push and maintain the BTC price above the 20-day EMA to gain the upper hand. If they do that, the BTC/USDT pair may begin its journey toward $82,000 and eventually reach the crucial $84,000 level.Ether price predictionSellers are attempting to retain Ether (ETH) below the support line, but the bulls have kept up the pressure.ETH/USDT daily chart. Source: Cointelegraph/TradingViewThe bulls will have to drive the ETH price above the moving averages to signal a comeback. If they do that, it suggests that the break below the support line may have been a bear trap. The ETH/USDT pair may climb to $2,465 and then to the resistance line of the ascending channel pattern.Contrary to this assumption, if the price declines from the current level or the 20-day EMA and breaks below $2,077, it would signal that the bears remain in control. That may sink the pair to the $1,916 support.BNB price predictionBNB (BNB) rose above the 20-day EMA ($650) on Wednesday, and the bulls are attempting to push the price to $687.BNB/USDT daily chart. Source: Cointelegraph/TradingViewSellers will attempt to defend the $687 resistance, but if the bulls prevail, the BNB/USDT pair may march toward $730 and then $790. Such a move suggests that the pair may have bottomed out at $570.The bears are likely to have other plans. They will attempt to defend the overhead resistance and pull the BNB price below the 50-day simple moving average ($631). If they succeed, the pair may extend its stay within the $570 to $687 range for a while longer.XRP price predictionXRP (XRP) remains below the moving averages, indicating that the bears are in no mood to let go of their advantage. XRP/USDT daily chart. Source: Cointelegraph/TradingViewSellers will attempt to strengthen their position by pushing the XRP price below the $1.27 support level. If they manage to do so, the XRP/USDT pair may plummet to $1.11, where buyers are expected to step in.The first sign of strength will be a close above the downtrend line. The pair may then ascend to $1.61, a crucial level to watch. If buyers overcome the barrier, the pair may surge toward $2.40.Solana price predictionSolana’s (SOL) relief rally reached the 20-day EMA ($87.83), where the bears are expected to pose a strong challenge.SOL/USDT daily chart. Source: Cointelegraph/TradingViewIf buyers propel the SOL price above the 20-day EMA, it suggests demand at lower levels. The SOL/USDT pair may then climb to the $98 overhead resistance. A close above $98 signals the start of a new up move toward $117.On the contrary, if the price declines sharply from the 20-day EMA and breaks below $82.65, it suggests the bears remain in control. The pair may then tumble to the $76 support.Dogecoin price predictionDogecoin (DOGE) turned up from the 50-day SMA ($0.10) on Wednesday, but the relief rally is facing resistance at the 20-day EMA ($0.11).DOGE/USDT daily chart. Source: Cointelegraph/TradingViewIf buyers pierce the 20-day EMA, the DOGE/USDT pair may rise to the $0.12 overhead resistance. Sellers are expected to defend the $0.12 level, as a close above it would signal a short-term trend change. The DOGE price may then soar to $0.14 and later to $0.16.The 50-day SMA is the critical support to watch on the downside, as a break below it could sink the pair to the $0.09 level.Hyperliquid price predictionHyperliquid (HYPE) continued its uptrend, skyrocketing to a new all-time high of $62.65 on Thursday.HYPE/USDT daily chart. Source: Cointelegraph/TradingViewSellers are fiercely defending the $59.41 level, as they have not allowed the bulls to close above it. The first support on the downside is the 38.2% Fibonacci retracement level of $53.29. If the HYPE price rebounds off the $53.29 level with strength, the bulls will again attempt to resume the uptrend. A close above $62.65 opens the door to a rally toward $77.Alternatively, a close below the $53.29 level suggests that the short-term traders are booking profits. The HYPE/USDT pair may then tumble to the 50% retracement level of $50.41 and then the 20-day EMA ($46.97). The deeper the fall, the longer the time needed for the resumption of the uptrend.Related: XRP adds 4,300 new wallets in 24 hours, but why is price stuck?Cardano price predictionCardano (ADA) has been trading just below its moving averages, suggesting the bulls have not given up.ADA/USDT daily chart. Source: Cointelegraph/TradingViewA break and close above the 20-day EMA ($0.25) opens the doors for a recovery to $0.29 and, after that, to $0.31. Buyers will have to clear the $0.31 hurdle to signal the start of a new up move.Instead, if the ADA price turns down from the moving averages, it suggests that the bears remain in control. There is support at $0.24, but if the level breaks down, the ADA/USDT pair may slump to the bottom of the $0.22 to $0.31 range.Zcash price predictionZcash (ZEC) pole vaulted above the $643 resistance on Wednesday, but the bulls are struggling to sustain the higher levels.ZEC/USDT daily chart. Source: Cointelegraph/TradingViewThe relative strength index is forming a negative divergence, indicating that the bullish momentum is weakening. If the ZEC price closes below the $643 level, it signals the possibility of a deeper correction toward the 20-day EMA ($547).If the ZEC/USDT pair turns up from the current level or the 20-day EMA, it indicates that the uptrend remains intact. The bulls will then make one more attempt to clear the $690 level, clearing the path for a rally to the $750 resistance.Bitcoin Cash price predictionBitcoin Cash (BCH) has risen above the breakdown level of $375, but the rebound lacks strength. BCH/USDT daily chart. Source: Cointelegraph/TradingViewThe relief rally is expected to face selling at the 38.2% Fibonacci retracement level of $393 and then at the 20-day EMA ($414). If BCH price declines from $393, the risk of a break below $348 increases. The BCH/USDT pair may then resume the downtrend and plunge to $300.This negative view will be invalidated in the near term if buyers drive and maintain the price above the 20-day EMA.

Čítaj viac

Price predictions 5/20: BTC, ETH, BNB, XRP, SOL, DOGE, HYPE, ADA, ZEC, BCH

Key points:Bitcoin is at a critical juncture, as a close below $76,000 may deepen the pullback toward $70,000.HYPE and ZEC are in an up move, but most other major altcoins are struggling to find support. Bitcoin (BTC) has risen above $77,500, but the recovery is expected to face resistance in the $78,500-$82,000 range. The net outflows of $979.7 million from spot BTC exchange-traded funds this week, according to Fireside Investors data, suggest that investors have turned cautious in the near term.Crypto analyst Ardi said in a post on X that the next retest of the $74,000 to $75,000 zone may be the most important test of this entire bear market. The zone is important because it acted as stiff resistance in 2024 and then flipped into support during the retest in 2025. A break below the support zone may “expose the market to a much deeper rotation back toward the bear market lows.”Crypto market data daily view. Source: TradingViewAlthough BTC appears weak in the near term, analysts do not anticipate a sharp decline. CryptoQuant analyst Sunny Mom said in a recent QuickTake analysis that if BTC holds the $70,700 level, it is likely to consolidate in the $70,000 to $82,000 range “to burn time and digest the supply.”Could BTC and the major altcoins start a strong recovery? Let’s analyze the charts of the top 10 cryptocurrencies to find out.Bitcoin price predictionBTC is attempting a bounce off the breakout level at $76,000, indicating that the bulls are striving to turn it into support.BTC/USDT daily chart. Source: Cointelegraph/TradingViewSellers are unlikely to give up easily and may vigorously defend the 20-day exponential moving average ($78,484). If the BTC price turns down sharply from the 20-day EMA, it increases the risk of a break below $76,000. If that happens, the BTC/USDT pair may plunge to the support line.Contrarily, a close above the 20-day EMA signals demand at lower levels. The bulls will then endeavor to push the pair to the overhead resistance at $84,000. This is a critical level for the bears to defend, as a close above it clears the path for a rally toward $97,924.Ether price predictionEther (ETH) fell below the support line of the ascending channel pattern on Sunday, but the bears have not been able to capitalize on the breakdown.ETH/USDT daily chart. Source: Cointelegraph/TradingViewThe bulls are striving to push the ETH price back into the channel. If they succeed, the next hurdle is likely to be at the moving averages. If the price turns sharply down relative to the moving averages, the risk of a drop to $1,916 increases.Alternatively, a close above the moving averages suggests that the market has rejected the break below the support line. The ETH/USDT pair may then rally to $2,465, then to the resistance line.BNB price predictionBNB (BNB) is attempting to find support at the 50-day SMA ($629), indicating a lack of aggressive selling at lower levels.BNB/USDT daily chart. Source: Cointelegraph/TradingViewIf the price closes above the 20-day EMA ($648), the bulls will again strive to push the BNB/USDT pair to the $687 resistance. Sellers are expected to aggressively defend the level, as a close above it may push the BNB price to $730 and, after that, to $790. That indicates the pair may have bottomed out in the short term.Instead, if the price turns down and breaks below the 50-day SMA, it suggests the pair may remain within the $570 to $687 range for some time. XRP price predictionXRP (XRP) closed below the 50-day SMA ($1.39) on Monday, but a minor positive is that the bulls have not let the price dip to $1.27.XRP/USDT daily chart. Source: Cointelegraph/TradingViewBuyers will have to achieve a close above the downtrend line to signal a comeback. The XRP/USDT pair may then move higher toward the $1.61 level, where bears are expected to step in. A close above the $1.61 resistance signals a potential trend change. The XRP price may then rally to $2 and later to $2.40.On the contrary, if the price continues lower and or turns down from the downtrend line, it suggests that the bears remain in control. That increases the risk of a break below the $1.27 support. If that happens, the pair may plummet to $1.11.Solana price predictionSolana (SOL) has held above the $82.65 support over the past few days, but bulls are struggling to trigger a strong rebound.SOL/USDT daily chart. Source: Cointelegraph/TradingViewThe 20-day EMA ($87.93) has begun to turn lower, and the RSI is in negative territory, indicating a slight advantage for bears. If the SOL price turns sharply down from the 20-day EMA, the likelihood of a break below $82.65 increases. The SOL/USDT pair may then descend to the $76 support.Buyers are likely to have other plans. They will attempt to push the price above the 20-day EMA and the $91 resistance. If they do that, the pair may reach the $98 level. Dogecoin price predictionDogecoin (DOGE) has been stuck in the $0.09-$0.12 range, suggesting buying on dips and selling on rallies.DOGE/USDT daily chart. Source: Cointelegraph/TradingViewThe bulls are attempting to start a bounce off the 50-day SMA ($0.10), but are expected to hit a hurdle at the 20-day EMA ($0.11). If the DOGE price turns down sharply from the 20-day EMA, the likelihood of a drop to $0.09 increases.On the other hand, a close above the 20-day EMA suggests that the DOGE/USDT pair may climb to the $0.12 resistance. Buyers will have to push and maintain the price above $0.12 to signal the start of a new uptrend to $0.14, and subsequently to $0.16.Hyperliquid price predictionHyperliquid (HYPE) closed above the $45.77 resistance on Monday, signaling the resumption of the uptrend.HYPE/USDT daily chart. Source: Cointelegraph/TradingViewThere is resistance at $51.43, but if the bulls pierce the level, the HYPE price may surge toward $59.41. Sellers are expected to fiercely defend the $59.41 level, as a break above it could push the HYPE/USDT pair into uncharted territory.The first support on the downside is the breakout level of $45.77 and then the 20-day EMA ($44.11). Sellers will have to pull the price below the 20-day EMA to suggest that the bulls are losing their grip. The pair may then tumble to the 50-day SMA ($41.62).Related: Ethereum traders warn of a ‘nasty’ ETH price drop if $2K support breaksCardano price predictionCardano (ADA) has been clinging to the 50-day SMA ($0.25), indicating that the bulls are attempting to reclaim the level.ADA/USDT daily chart. Source: Cointelegraph/TradingViewAny recovery is expected to face selling at the 20-day EMA ($0.26). If the price turns sharply down from the 20-day EMA, the bears will attempt to drive the ADA/USDT pair toward the solid support at $0.22.On the upside, a break and close above the 20-day EMA signals strength. The ADA price may rise toward $0.29, then to $0.31, where bears are likely to mount a strong defense. Zcash price predictionZcash (ZEC) bounced off the 20-day EMA ($519) on Sunday, indicating that the bulls continue to buy the dips.ZEC/USDT daily chart. Source: Cointelegraph/TradingViewBuyers will need to drive the ZEC price above $643 to initiate the next leg of the uptrend. The ZEC/USDT pair may then skyrocket toward $750, where the bears are expected to mount a strong defense.The first support to watch out for on the downside is the 20-day EMA. A break and close below the 20-day EMA suggests that the traders are booking profits. That may pull the pair to the 61.8% Fibonacci retracement level of $442.Bitcoin Cash price predictionBitcoin Cash (BCH) closed below the $419 support on Saturday, signaling the resumption of the downtrend.BCH/USDT daily chart. Source: Cointelegraph/TradingViewThe selling picked up momentum, and the BCH/USDT pair fell below the $375 support on Monday. Buyers are attempting to push the price back above $375, but the bears have held their ground. If the BCH price turns down from $375 and breaks below $348, the pair may plummet to $300.Buyers have an uphill task ahead of them. They will have to push the price above the 20-day EMA ($421) and maintain it to signal a comeback.

Čítaj viac

Získaj BONUS 8 € v Bitcoinoch

nakup bitcoin z karty

Registrácia Binance

Burza Binance

Aktuálne kurzy