
Autor Cointelegraph by Nancy Lubale

XRP sentiment hits 2-year high, but why is price stuck?

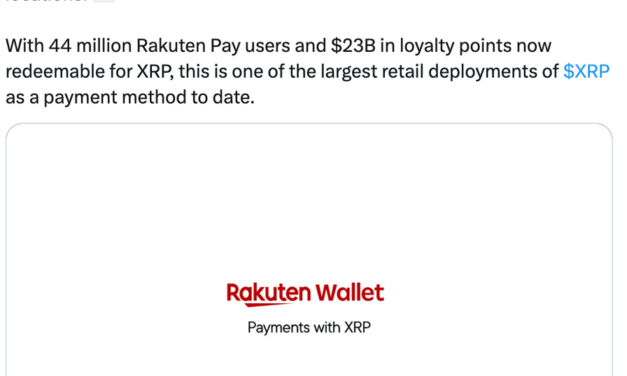
XRP’s (XRP) sentiment on social media has risen sharply over the last few days, but overhead resistance at $1.40 kept the price in consolidation.Key takeaways:XRP’s social media sentiment has risen 240% over the last 30 days to a two-year high.XRP price recovery may face resistance at $1.40, with a prolonged consolidation likely..XRP sentiment jumps on integration with Rakuten Pay News of XRP’s integration with the Japanese payment platform, Rakuten Wallet, has sparked renewed optimism among investors. Related: XRP set for ‘strongest’ 2026 monthly ETF inflows as bulls target $2This integration allows Rakuten’s over 44 million users to convert their loyalty points (worth over $23 billion) directly into XRP, trade it in-app, and spend it at over 5 million merchant locations via the Rakuten Pay app. This marks “one of the largest retail deployments of $XRP as a payment method to date,” bridging loyalty programs, payments, and crypto utility in a major world economy, Ripple said in an X post on Thursday.XRP integrates with Rakuten Pay. Source: RippleAs a result, XRP saw its “2nd highest bullish sentiment across social media in the past 2 years,” Santiment said in a Thursday post on X. Santiment’s Positive/Negative sentiment indicator, which measures the ratio of positive to negative social media mentions for a cryptoasset, shows XRP has a score of 3.9, levels last seen in early 2024.This was more than 240% higher than the 1.135 value recorded on March 29, following a 20% price drop over two weeks. Traders are showing excitement over the fact that XRP is “seeing further adoption,” the onchain data provider said, adding:“As far as price goes, these events don’t often instantly lead to major price outbreaks. It is usually after the initial wave of euphoria, after FOMO calms down, that the impact of this kind of news sees the bullish outcome.”XRP’s Positive/Negative sentiment metric. source: Santiment“Buy $XRP with points. Spend it across millions of merchants in Japan,” analyst John Squire said in reaction to the development, adding:“This is what mass adoption looks like.”Following this news, XRP/USD jumped 2% over the last 24 hours, but remains 62% below its $3.66 multi-year high reached in July 2025. XRP faces stiff resistance above $1.40XRP’s recent 18% rally from its local low at $1.27 reached on April 5 was stopped at $1.48, coinciding with the upper boundary of a symmetrical triangle. This trend line has suppressed the price since early February, as shown in the chart below. Bulls must push the price above the $1.40-$1.45 resistance zone to confirm a bullish breakout from the triangle. This area is also where the 50-day exponential moving average, the 100-day simple moving average and the upper trend line of the triangle sit, reinforcing the significance of this resistance zone.XRP/USD daily chart. Source: Cointelegraph/TradingViewAccording to XRP’s cost-basis distribution data, investors hold approximately 2 billion XRP at an average cost of $1.40-$1.45, creating a potential resistance zone. This concentration suggests many investors may sell at break-even, potentially stalling XRP’s upward momentum.XRP cost basis distribution chart. Source: GlassnodeA break above this supply area could open the way for a rally toward the measured target of the triangle at $2.10, about 50% above the current price. In a Friday post on X, analyst ChartNerd said a big move was brewing for XRP price once resistance above $1.40 is “cleared.”As Cointelegraph reported, the XRP/USD pair was required to hold the $1.27 support and rise above the moving averages around $1.40 to signal a trend change. This article is produced in accordance with Cointelegraph’s Editorial Policy and is intended for informational purposes only. It does not constitute investment advice or recommendations. All investments and trades carry risk; readers are encouraged to conduct independent research.

Čítaj viac

Bitcoin analysts explain why BTC price can’t take out $80K

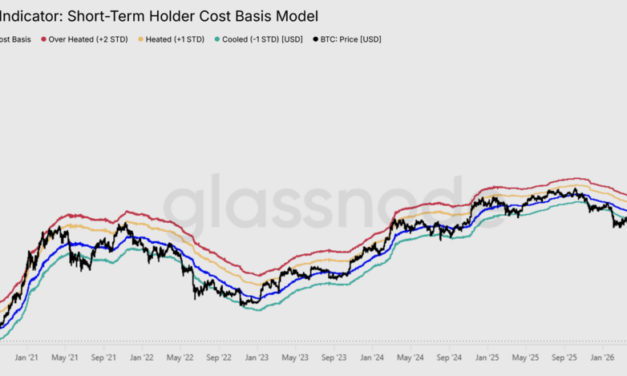
Bitcoin (BTC) rebounded 32% to a 10-week high of $79,500 on April 22 from its sub-60,000 multi-year low. But recent buyers took advantage of the rally to exit as the price has since corrected to $76,000 on Thursday, with $80,000 proving a tough barrier to break.Key takeaways:Bitcoin sell pressure risk exists around $80,000, a resistance level that may delay the bulls.Short-term holders and Bitcoin ETF investors keep selling, frustrating recovery attempts.Bitcoin price can’t crack $80,000As Cointelegraph reported, Bitcoin failed to break above $80,000 as its rebound fell short of a bull market comeback.This is due to the resistance zone between the True Market Mean at $78,000 and the Short-Term Holder (STH) cost basis at $79,000, which continues to cap upward momentum, as recent buyers used this range to exit near breakeven.“This behavior is a textbook pattern in bear markets, where price approaches the breakeven level of the most price-sensitive cohort, the incentive to exit positions overwhelms incoming demand, exhausting upside momentum,” Glassnode said in its latest Week Onchain newsletter, adding:“With this rejection confirming overhead resistance, the mid-term bias tilts toward further downward pressure.”Bitcoin STH cost basis model. Source: GlassnodeBitcoin’s cost basis distribution data shows that investors hold about 475,301 BTC at an average cost of $77,800-$80,880, reinforcing the significance of this resistance zone.Traders say the BTC/USD pair must flip the resistance at $80,000 into support to target higher highs toward $84,000.After reclaiming the 50-day and 100-day simple moving averages, BTC/USD has sent “one bottoming signal after another firing on higher timeframes,” technical analyst SuperBitcoinBro said in a Wednesday post on X, adding:“But I agree it needs to get past 80K.”Daan Crypto Trades said the $80,000 level remains the “main level for the bulls in the short/mid term.”BTC/USD daily chart. Source: X/Daan Crypto TradesAs Cointelegraph reported, Bitcoin breaking $80,000 would signal that the bulls are still in control, paving the way for the next big resistance at $84,000.BTC selling by short-term holders halts rally Additional onchain data shows “heavy distribution” by short-term holders, as these investors booked profits on Bitcoin’s recent rally to $80,000.The 24-hour SMA of STH Realized Profit shows that as the price approached the $80,000 level, recent buyers realized profits at a rate of $4 million per hour. The 24-hour SMA of STH Realized Profit is a real-time measure of how aggressively recent buyers are realizing gains.The metric spiked as high as $7.2 million per hour on April 15, about roughly “four times the base level that had established itself since mid-April, confirming that short-term holders seized the rally as a distribution opportunity,” Glassnode said, adding:“The buy side simply lacked sufficient liquidity to absorb this wave of profit realization, capping momentum and triggering the subsequent rejection.”Bitcoin Entity-Adjusted STH realized profit. Source: GlassnodeMore selling pressure came from US spot Bitcoin exchange-traded funds, which have recorded outflows for three consecutive days, totaling $390 million.This marked the longest outflow streak since March 20, when a three-day outflow streak accompanied an 11.5% BTC price drop after rejection at $76,000. Spot BTC ETF flows chart. Source: SoSoValueAnalysts at Wise Advise said that the return to spot BTC ETF outflows after a nine-day inflow streak is the first sign that “the local top may be in.”This article is produced in accordance with Cointelegraph’s Editorial Policy and is intended for informational purposes only. It does not constitute investment advice or recommendations. All investments and trades carry risk; readers are encouraged to conduct independent research.

Čítaj viac

Dogecoin leads pre-FOMC rally with 12% gains: Is DOGE price headed to $0.33?

Dogecoin (DOGE) gained as much as 12% on Wednesday, leading gains in a broader relief rally across global risk markets ahead of the US Federal Reserve decision on interest rate cuts. Key takeaways:Dogecoin rallied up to 14% to $0.112 on Wednesday, outperforming the wider crypto market.Dogecoin open interest jumped 25% in 24 hours to $1.74B, signaling growing derivatives interest and institutional participation.A 2023-style fractal suggests DOGE price could rally 300% in the coming weeks.Dogecoin open interest surges 25%DOGE rose as much as 14% to an intraday high of $0.112 on Wednesday from a low of $0.097, outperforming the broader crypto market.Related: Price predictions 4/24: BTC, ETH, XRP, BNB, SOL, DOGE, HYPE, ADA, BCH, XMRDogecoin’s rally was fueled by several factors, including the launch of 21Shares’ physically-backed Dogecoin exchange-traded product (ETP) on Xetra, Germany’s leading electronic trading platform.Source: X/21SharesThe memecoin’s open interest (OI) surged 25% over the last 24 hours and 46% over the last two weeks to $1.74 billion on Wednesday, signaling the return of derivatives traders. Futures OI increasing alongside the price indicates a growing interest from institutional investors, which is generally seen as bullish, as it tends to increase liquidity and attract more trading capital.DOGE OI across all exchanges. Source: GlassnodeDogecoin’s rally also comes ahead of Federal Open Market Committee (FOMC) meeting on Wednesday, with market participants pricing in a 100% chance that interest rates will be left unchanged at 3.50%-3.75%.DOGE’s reaction to FOMC rate cut decisions in 2025 and 2026 shows a clear pattern. The price often moved higher in the days leading up to the meeting, followed by mostly negative returns thereafter, as illustrated in the chart.DOGE/USD daily chart. Source: Cointelegraph/TradingViewPrevious FOMC-linked corrections have coincided with sharp deleveraging phases, last seen in March, when a 15% DOGE price drop was accompanied by a $890 million decline in futures OI and $30 million in total Dogecoin liquidations.DOGE’s 2023 fractal projects 300% price rallyThe DOGE/USD pair is currently displaying a technical pattern that follows a 2023 fractal, in which Dogecoin gained 300%. The weekly chart shows the price bouncing off an ascending trend line that has supported it since mid-2022.A bullish cross from the moving average convergence divergence (MACD) indicator also confirmed the price bottom.DOGE/USD weekly chart. Source: Cointelegraph/TradingViewDogecoin’s current price action is following a similar pattern, again bouncing off the same structural support and a confirmed bullish MACD crossover.Dogecoin’s “weekly chart looks clean: bottom looks in, structure is holding,” analyst Trader Tardigrade said in a recent post on X, adding that the “next leg could send” the DOGE/USD pair to $1.If history repeats itself, DOGE price may rally by more than 300% toward $0.33 over the next few weeks. As Cointelegraph reported, further confirmation of a trend reversal now hinges on the DOGE/USD pair crossing the key $0.10-$0.11 resistance zone.This article is produced in accordance with Cointelegraph’s Editorial Policy and is intended for informational purposes only. It does not constitute investment advice or recommendations. All investments and trades carry risk; readers are encouraged to conduct independent research.

Čítaj viac
XRP set for ‘strongest’ 2026 monthly ETF inflows as bulls target $2

XRP (XRP) price was up 1.2% over the last 24 hours to trade at $1.40 on Wednesday. Several market and technical factors suggest that the XRP/USD pair may climb further as long as key support levels hold.Key takeaways:Spot XRP ETFs are set to record their strongest monthly inflows since December 2025, signaling renewed institutional demand.A symmetrical triangle setup sees XRP price rising roughly 53% as long as support at $1.40 holds.Ripple CEO on XRP: “Lock in”Ripple CEO Brad Garlinghouse is urging the XRP community to “lock in” as massive marketing campaigns take over the Las Vegas Strip ahead of the XRP Las Vegas 2026 (XRPLV26) conference. Related: Bitcoin, stocks risk ‘months’ of losses as Kevin Warsh Becomes Fed chairThe event, which is scheduled for Thursday and Friday will focus on the expanding XRP ecosystem, next-generation applications on the XRP Ledger and community building.On Tuesday, OKX, a major crypto exchange, posted an image of the Las Vegas Sphere lit with the XRP logo, which Ripple CEO Brad Garlinghouse reposted with a simple directive to his followers: “Lock in.”Source: X/OKX/Brad GarlinghouseRipple has heavily promoted the event with massive “Raise the Standard” XRP billboards across the Las Vegas Strip, timed with the ongoing Bitcoin 2026 conference. This has sparked renewed hype and social media buzz around the event.However, historical patterns show Ripple/XRP events rarely trigger sustained price rallies. For instance, XRP price gained 16% over the week following Ripple’s Swell 2025. But this was followed by a 30% drop from $2.56 to $1.81 between Nov. 11 and Nov. 21 of that year.Therefore, without major concrete announcements emerging from the stage, any upside may quickly fade amid broader market forces.XRP ETF demand is “still alive”XRP spot ETFs are gaining steady momentum again, with the latest inflows showing that investor demand is not just returning but holding firm at elevated levels. These investment products posted inflows in 11 of the last 13 days, totaling $82.42 million, according to data from SoSoValue. XRP ETFs have already pulled in $83.9 million in net inflows in April, marking a strong rebound from March’s $31.16 million outflow. This reversal makes April the “strongest monthly inflow since December 2025,” signaling a notable shift in momentum, analyst Xfinancebull said in a Monday post on X, adding:“That does not guarantee instant price fireworks, but it absolutely tells me the bid for regulated $XRP exposure is still alive and building.”Spot XRP ETF flows chart. Source: SoSoValueMeanwhile, global XRP exchange-traded products (ETPs) posted inflows totaling $25 million during the week ending Friday. XRP ETPs have now recorded $148 million in net inflows so far in 2026, bringing the total assets under management (AUM) to roughly $2.6 billion.Crypto funds net flows data. Source: CoinSharesThis indicates a sustained institutional appetite for XRP products, adding to XRP’s tailwinds.As Cointelegraph reported, exchange outflows, positive flows into whale addresses and strong ETF demand improve XRP’s chances of a sustained price recovery.XRP price technicals put 50% rally in playThe XRP/USD pair has spent nearly three months inside a symmetrical triangle, defined by two converging trend lines. Its rebound from the lower trend line support on Wednesday now raises the odds of a move toward the upper boundary.A daily candlestick close above the upper line of the triangle at $1.45 would open the way for a rally toward its measured target at $2.15, about 53% above the current price.However, bulls must overcome resistance from the 100-day exponential moving average (EMA) at $1.52 and the 200-day EMA at $1.75, before reaching this target.XRP/USD daily chart. Source: Cointelegraph/TradingViewNotably, XRP’s chances hinge on bulls defending support at $1.40, which is also the 200-week EMA and the 20-day EMA, making this a key level. A decisive break below it risks invalidating the bullish narrative altogether.It may instead raise the odds of the price declining toward the $0.98 mark, aligning with the triangle’s bearish target.As Cointelegraph reported, a break below the moving averages around $1.38-$1.40 could see XRP price drop toward $1.12 over the next few days.This article is produced in accordance with Cointelegraph’s Editorial Policy and is intended for informational purposes only. It does not constitute investment advice or recommendations. All investments and trades carry risk; readers are encouraged to conduct independent research.

Čítaj viac

Bitcoin price drops below $76K as onchain data sends mixed signals

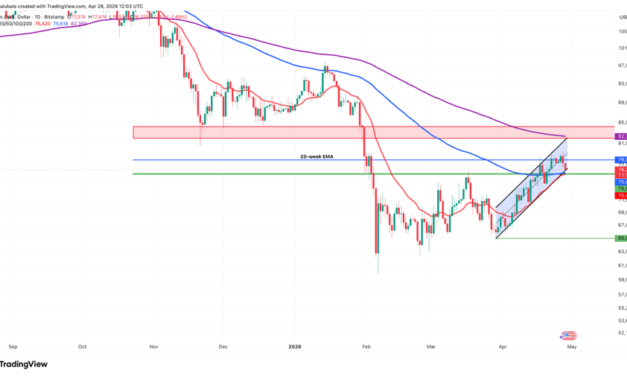
Bitcoin (BTC) fell below $76,000 on Tuesday after failing to break $80,000 as uncertainties surrounding the reopening of the Strait of Hormuz and macroeconomic conditions unnerved the market. Meanwhile, technicals and onchain data sent mixed signals on BTC’s ability to sustain the recovery.Key takeawaysBitcoin is trapped in a tight range with strong technical support at $75,500 and heavy resistance near $80,000.Bitcoin’s onchain metrics are mixed, with buy pressure rising but spot volume and active addresses declining.Bitcoin price is sandwiched between two key levelsBitcoin’s 30% recovery from sub-$60,000 lows reached on Feb. 6 was stopped by selling around the $78,000-$80,000 supply zone.Related: Three Bitcoin charts say BTC price may rally toward $82KNote that this is where the 20-week exponential moving average (EMA) sits currently, reinforcing the importance of this resistance level.MN Capital founder Michael van de Poppe said the ongoing retracement was “typical behavior” ahead of the FOMC meeting. “Bitcoin touched the resistance zone at $79,000 and is consolidating,” van de Poppe said, adding:“I think we’re still in for a strong period on the markets.”BTC/USD daily chart. Source: Cointelegraph/TradingViewOn the downside, Bitcoin retested support at $75,500, which is also the 20-day EMA, the 100-day EMA and the lower trend line of an ascending channel, as shown in the chart above.Glassnode’s UTXO realized price distribution (URPD), which shows the average prices at which ETH holders bought their coins, reveals that immediate resistance is around $78,000 where investors acquired 335,650 BTC. Investors acquired roughly 298,560 BTC at an average price of $75,500, marking it as a key support level.Bitcoin URPD all-time high partitioned. Source: GlassnodeThe chart above also shows a larger supply overhang around $82,000-$84,000, which could stall price rallies, while a significant support zone sits between $65,500 and $67,000.  Notably, this is the price range defined by the ascending parallel channel in the TradingView chart above.Meanwhile, Bitcoin’s liquidation heatmap shows BTC in a classic liquidation sandwich with heavy ask orders around $78,600 and dense bid positions below the spot price, as shown in the figure below. This highlights the relative tightness of the current market structure.Bitcoin liquidation heatmap. Source: CoinGlassAs Cointelegraph reported, buyers are expected to fiercely defend the $75,500-$76,000 support level, while bears are mounting a defense at the $80,000 psychological level.Bitcoin’s onchain “fundamentals remain weak”Bitcoin market data is showing a “mix of bullish momentum and cautious sentiment,” contributing to the uncertainty in the market, data from Glassnode shows.Spot CVD (cumulative volume delta, a metric measuring the difference between buying and selling volume over time) has increased to $54.8 million million from $18.3 million, marking a near 200% increase over the last week.“This reflects strong bullish sentiment among market participants, suggesting heightened confidence in Bitcoin’s short-term direction,” the onchain data provider said in its latest Market Pulse report.Spot volume has decreased by 13.8% to $5.99 billion from $6.95 billion a week ago, “suggesting reduced market activity,” Glassnode added.Bitcoin spot CVD and spot volume charts. Source: GlassnodeMeanwhile, the number of daily active addresses dropped by 1.6% over the same period, “reflecting a more subdued state of network participation and reduced speculative interest,” Glassnode said, adding:“While buying pressure remains firm, reduced speculative activity suggests a more measured approach, with investors balancing risk and capital rotation.”Swissblock’s Bitcoin Fundamental index, which measures network health, growth, demand, activity, and capital flows, echoes this outlook.The index rose toward neutral with BTC’s recovery from macro lows below $60,000, and picked up again as the price reclaimed the $70,000 level.“Bitcoin’s price structure points higher, but fundamentals remain weak,” the private wealth manager said in an X post on Monday, adding:“Price can still rise here. But for a medium-term trend shift, Bitcoin needs neutral-to-strong fundamentals to confirm.”Bitcoin fundamental index. Source: SwissblockInstitutional demand for Bitcoin is also in neutral territory. While Strategy, the largest corporate Bitcoin holder, continues to buy BTC, flows into US-based spot Bitcoin ETFs turned negative, recording $273 million in net outflows on Monday.This article is produced in accordance with Cointelegraph’s Editorial Policy and is intended for informational purposes only. It does not constitute investment advice or recommendations. All investments and trades carry risk; readers are encouraged to conduct independent research.

Čítaj viac

Získaj BONUS 8 € v Bitcoinoch

nakup bitcoin z karty

Registrácia Binance

Burza Binance

Aktuálne kurzy