
Autor Cointelegraph by Nancy Lubale

Bitcoin short-term holder cost basis eyes $92K as next price target

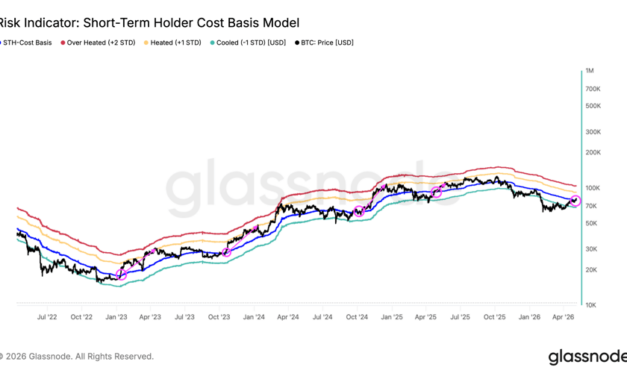
Bitcoin (BTC) buyers resumed their activity during the early Asian trading hours on Wednesday, pushing the price to a new multi-month high of $82,240.Onchain indicators, including the short-term holder (STH) cost basis, suggest that the BTC price can go higher, with the next big target at $92,000. Key takeaways:Bitcoin holders are back in profit, increasing the chances of reaching $92,000.BTC bulls must overcome resistance at $84,000 to continue the uptrend. Bitcoin price eyes $92,000 nextData from TradingView shows that BTC/USD had risen 37% to trade above $82,000 from its multi-month low of $60,000 reached on Feb. 6.This rally has seen Bitcoin rise above the cost basis of its short-term holders, currently at $79,000, according to data from Glassnode.STH cost basis refers to the average purchase price of investors who have held Bitcoin for less than 155 days.Historically, reclaiming this level has coincided with extended recovery phases, as investors returning to profit are often less inclined to sell and more willing to add exposure. The shift can also attract fresh buyers and trigger short squeezes as bearish positioning unwinds.Related: Bitcoin in ‘disbelief rally’ as traders spot $84K BTC price targetThe chart below shows that when the price reclaimed its realized price in April 2025, it rallied 30% toward the upper band of this metric at $112,000 four weeks later. Similar occurrences in October 2024, October 2023 and January 2023 also saw the BTC price rally toward the same onchain level, as shown in the chart below.If BTC breaks above the line, there is a good chance of seeing $92,423 in the short term, about 13% above the current price.Bitcoin STH cost basis. Source: Glassnode“Bitcoin has crossed the coveted ‘short-term holder breakout,’” analyst Mitchell Askew said in a Wednesday post on X, adding:“This typically signals the end of bear markets and consolidation periods.”Bitcoin analyst Plan C said if the price “can find sustained support above this level,” it would confirm that the 50% drawdown from the $126,000 all-time high was just a “mid-cycle correction.” Meanwhile, Bitcoin’s STH spent output profit ratio (SOPR) has flipped positive, showing early signs of a shift in market behavior.The metric is “back above 1, which usually means recent buyers are back in profit and selling pressure is easing,” analyst BitBull said in a Wednesday post on X, adding:“This is where markets often move from accumulation into early bullish phases.”Bitcoin STH SOPR. Source: BitBullAs Cointelegraph reported, several technical indicators suggest that Bitcoin’s bottom is in, with analysts setting targets as high as $250,000 within a year. Bitcoin’s price needs to flip $84,000 into supportBitcoin’s bullish weekly close above the 20-week exponential moving average and true market mean at $78,300 has convinced traders it can move higher from current levels.Analysts say the continuation of Bitcoin’s rally now hinges on breaking above the $82,000-$84,000 supply zone. Bitcoin is retesting the low $80,000s region, which “corresponds with the November lows and the Daily 200MA/EMA coming in a bit higher,” trader and analyst Daan Crypto Trades said in his latest Bitcoin analysis on X.Note that the 200-day EMA and the 200-day simple moving average are at $82,600 and $83,402, respectively.This is a “big level” for Bitcoin bulls, the analyst said, adding:“Acceptance higher can lead to a further bounce back into the $90Ks, but a rejection will likely keep this rangebound with $80K as the ceiling for a while.”BTC/USD daily chart. Source: X/Daan Crypto TradesMN Capital founder Michael van de Poppe shared a chart showing $84,000-$86,000 as the “next resistance zone,” which, if broken, could potentially see Bitcoin “continue to the 50-Week MA around $90K.”Meanwhile, Bitcoin’s whale order book showed “big ask orders concentrated” between $82,000-$84,000, making it a crucial level for the bulls to overcome. Bitcoin whale order book. Source: CoinGlassAs Cointelegraph reported, the BTC/USD pair may rise as high as $92,000 if resistance at $84,000 is broken.This article is produced in accordance with Cointelegraph’s Editorial Policy and is intended for informational purposes only. It does not constitute investment advice or recommendations. All investments and trades carry risk; readers are encouraged to conduct independent research.

Čítaj viac
XRP price copies 2025 chart fractal that last time sparked 66% gains

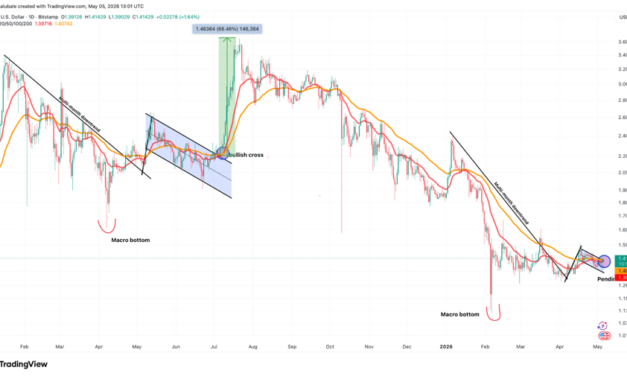
XRP (XRP) is currently displaying a technical pattern that follows a 2025 fractal that produced 66% gains. The daily chart shows XRP price breaking out of a bull flag, which can also result in massive gains.Key takeaways:XRP is currently displaying a technical pattern similar to the 2025 price action that ignited a 66% price rallyXRP’s spot taker CVD has turned positive, suggesting confidence among buyers.XRP price chart fractal targets $2.35XRP’s price action in the daily time frame mirrors a technical structure after recovery from the  April 2025 cycle low, preceding a sharp upward continuation. The formation came after a multi-week consolidation inside a bull flag, followed by a bullish cross by the 20-day and 50-day exponential moving averages (EMAs), as shown in the chart below.Related: XRP set for ‘strongest’ 2026 monthly ETF inflows as bulls target $2The XRP/USD broke above the upper boundary of the flag in early July 2025, triggering a cascade of short liquidations and fresh buying that ultimately delivered 66% gains to its current all-time high of $3.66, less than two weeks later.XRP/USD daily chart. Source: Cointelegraph/TradingViewXRP’s current price action is following a similar pattern, with the price again breaking out of a bull flag pattern and a pending bullish crossover from the moving averages.If history repeats itself, XRP/USD may rally by more than 66% toward $2.35. Further confirmation of a trend reversal now hinges on the price holding above $1.40, which is also the flag’s upper boundary and the 50-day SMA.“XRP is gaining momentum above $1.40, holding firmly over its 100-hour SMA” analyst Jack Straw said in a Tuesday post on X, adding:“A clean break above $1.420 could trigger the next leg up.”Fellow analyst Sam Mti said XRP was “looking good” after a buy signal from the MTI indicator, with potential to move above $1.45 as long as support at $1.40 holds. XRP/USD 1-hour chart. Source: Sam Mti As Cointelegraph reported, buyers will gain the upper hand on a close above the $1.40 level, paving the way for an XRP rally toward $2, then to $2.40.XRP’s spot taker CVD suggests buyers are backXRP’s 90-day spot taker cumulative volume delta (CVD) shows that buy-orders (taker buy) have become dominant again. CVD measures the difference between buy and sell volume over three months.The metric flipped positive (green bars in the chart below) on May 1 as the price broke above the $1.38 resistance and has remained positive since. This indicates optimism among traders, as they’re actively positioning for further gains.If the CVD remains green, it means buyers are not backing down, which could set the stage for another rally as seen in the past. A similar occurrence in June 2025 accompanied 70% XRP price gains. XRP spot taker CVD. Source: CryptoQuantMeanwhile, XRP’s open interest (OI) delta flipped positive, rising to as high as $27 million on May 1, reflecting  a change in active derivatives positioning, data from CryptoQuant shows“A sharp positive reading suggests that new positions are being added to the market,” CryptoQuant analyst Amr Taha said in a QuickTake analysis on Tuesday, adding:“When this happens while price is rising, it often shows that traders are increasing exposure as momentum begins to recover.”XRP OI delta across exchanges. Source: CryptoQuantThis article is produced in accordance with Cointelegraph’s Editorial Policy and is intended for informational purposes only. It does not constitute investment advice or recommendations. All investments and trades carry risk; readers are encouraged to conduct independent research.

Čítaj viac
Bitcoin taps $81K as long-term holders add 330K BTC: How high can price go?

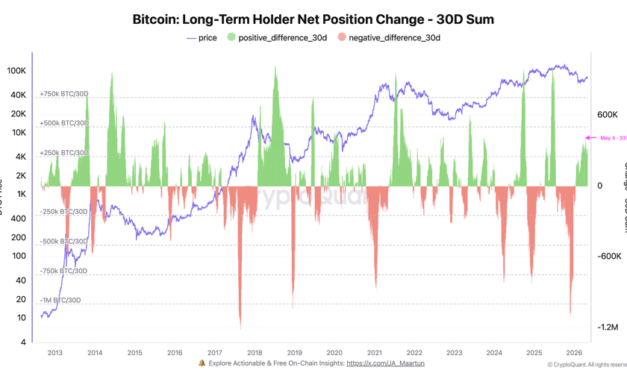
Bitcoin (BTC) rose as much as 2% over the past 24 hours to an intraday high of $81,300 on Tuesday. This brings the weekly and 30-day gains to 5% and 21%, respectively.This rally was accompanied by buying from long-term holders, who have added more than 330,000 BTC over the past month, according to data from CryptoQuant.Key takeaways:Long-term Bitcoin holders added 331,000 BTC over the past 30 days.Spot Bitcoin ETFs have seen a total of $1.18 billion in net inflows over the last three days.Bitcoin’s bull flag projects a BTC price rally to $94,800.Bitcoin long-term holders add $26.7 billion in BTCBitcoin long-term holders (LTHs) — entities holding coins for at least six months without selling — ramped up their holdings as BTC price hit new highs above $81,000. Related: Bitcoin short-term cost basis approaches profitability, but $80K must flip to support firstCryptoQuant data shows that on a rolling 30-day basis, the supply held by LTHs increased by a net 331,000 BTC, worth around $26.7 billion at current market prices as of Tuesday. This represents almost 1.6% of the total supply, suggesting increased accumulation as the price recovers.Bitcoin 30-day rolling LTH supply change. Source: CryptoQuantAlso accompanying Bitcoin’s bullishness are strong inflows into US-based spot Bitcoin exchange-traded funds (ETFs), which have recorded positive flows for three consecutive days totaling $1.18 billion. These investment products attracted $532 million in net inflows on Monday, suggesting increased institutional appetite for BTC.Spot Bitcoin ETF flows table. Source: Farside Investors “ETF flows are back in the markets, and the markets are turning upwards for Bitcoin,” MN Capital founder Michael van de Poppe said in an X post on Tuesday, adding:“I assume we’ll continue to see more strength coming in over the course of the next few weeks as there’s a lot of ETF demand happening.”As Cointelegraph reported, institutions are absorbing more than five times the daily mined BTC supply. How high can Bitcoin price go?The Bitcoin liquidation heatmap showed the price eating away liquidity around $80,000, with millions in bid orders still sitting between the spot price and $84,600.“Bitcoin is on a liquidity hunt,” Bitcoin analyst AlphaBTC said his latest post on X, adding:“Up to $84K is looking Juicy!”Bitcoin liquidation heatmap. Source: GlassnodeThe $84,000 area is on many traders’ radars because it coincides with the CME gap formed in early February. From a technical perspective, the price has validated a bull flag on the daily chart after breaking above the upper boundary at $77,500.A daily candlestick close above the 200-day exponential moving average at $$82,000 will confirm the continuation of the uptrend toward the measured target of the flag at $94,800. Such a move would bring the total gains to 18%.BTC/USD daily chart. Source: Cointelegraph/TradingViewCrypto investor Cryptocupra shared a chart suggesting that Bitcoin’s macro bottom could be in, following the bullish cross from the weekly MACD, paving the way for more upside.  BTC/USD weekly chart. Source: X/CryptocupraAs Cointelegraph reported, the BTC/USD pair may rise as high as $92,000 if the resistance at $84,000 is broken.This article is produced in accordance with Cointelegraph’s Editorial Policy and is intended for informational purposes only. It does not constitute investment advice or recommendations. All investments and trades carry risk; readers are encouraged to conduct independent research.

Čítaj viac
Ethereum holders are back in profit as ETH price chart targets $3K

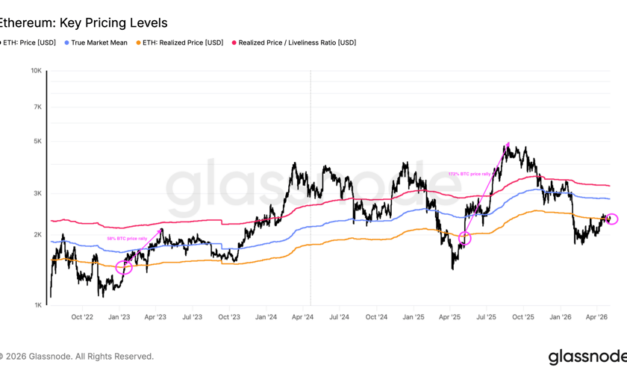
Ether’s (ETH) surge to $2,390 on Monday pushed its value above its realized price, implying that the average holder of ETH is now back in profit. But is this enough for the ETH bulls to reach $3,000?Key takeaways:Ether holders are back in profit, increasing chances for more upside.Ether’s bull flag chart pattern is targeting $3,000.A big potential sell wall exists around $2,800, with 7.1 million ETH on the line.Ether price rises above its cost basisData from TradingView shows that Ether’s price rose 21% to $2,340 on Monday from its local low of $1,940 reached on March 29.This rally has seen ETH rise above its realized price, or the average cost basis of all moved ETH, currently at $2,320, according to data from Glassnode.Related: Ethereum Foundation sells another 10,000 ETH to BitMine in third OTC dealThe average ETH holder returning to profit after unrealized losses provides meaningful financial relief for many holders, and perhaps a bullish outlook.Historically, breaking above this level shifts market sentiment from fear to greed, reducing sell pressure from underwater holders. This often fuels bullish momentum, attracting new buyers and short squeezes.The chart below shows that when the price reclaimed its realized price in May 2025 after trading below it for roughly two months, it went on to rally 173% to its $4,950 all-time high from $1,800. The gains were 58% after ETH/USD reclaimed its cost basis in early 2023. Ethereum: Key pricing levels. Source: GlassnodeTherefore, holding above $2,300 is crucial for the bulls and for a potential retest at $3,000.Analyst Dami-Defi said that a break above the $2,400-$2,600 would trigger the “most violent move of the year” toward $3,000.“Once we break $2,400 we will catapult violently to $2,800 – $3,000.”ETH/USD weekly chart. Source: X/Dami-DefiAs Cointelegraph reported, the ETH/USD pair must overcome resistance at $2,400 to confirm a trend change.ETH price technical analysis: Bull flag targets $3,000Ether’s price action has formed a bull flag chart pattern on the daily chart (see below). The price is retesting the $2,350 resistance, where the flag’s upper boundary and the 100-day exponential moving average (EMA) converge. A daily candlestick close above this level would open the way toward the measured target at $3,018, roughly 30% above the current price. ETH/USD 12-hour chart. Source: TradingViewThe daily relative strength index has increased to 56 from near oversold conditions at 36 in late March, suggesting that ETH bulls are returning to the market.Trader and analyst Cohelson David said a broadening wedge pattern on the 12-hour chart projects an ETH price breakout toward $3,000.ETH/USD 12-hour chart. Source: X/Cohelson DavidHowever, Ether’s cost basis distribution data shows that investors hold about 7.1 million ETH at an average cost of between $2,750 and $2,850, creating a potential resistance zone.This concentration suggests that many investors may sell at breakeven, potentially stalling Ether’s upward move.Ethereum cost basis distribution chart. Source: GlassnodeThis article is produced in accordance with Cointelegraph’s Editorial Policy and is intended for informational purposes only. It does not constitute investment advice or recommendations. All investments and trades carry risk; readers are encouraged to conduct independent research.

Čítaj viac

Bitcoin in ‘disbelief rally’ as traders spot $84K BTC price target

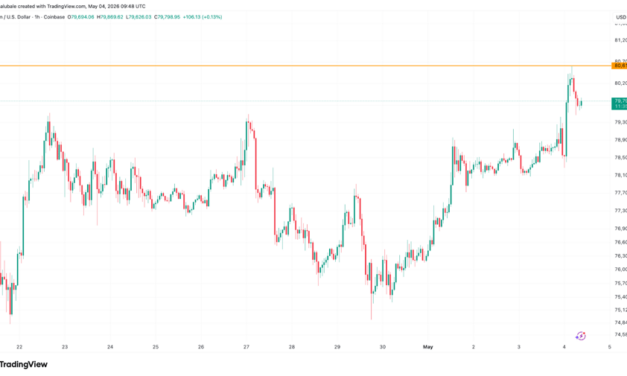
Market analysts said Bitcoin (BTC) is “primed for upward momentum” after rallying past $80,000 during the early Asian trading hours on Monday. Key takeaways:Bitcoin price rises to a 13-week high of $80,610 on Monday amid $462 million in crypto liquidations.The CME gap at $84,000 could act as a “magnet” for BTC price.Bitcoin leads market in fresh May rallyData from TradingView showed 1.6% daily BTC price gains, with BTC/USD rising as high as $80,610 for the first time since Jan. 31.BTC/USD one-hour chart. Source: Cointelegraph/TradingViewEther (ETH), the largest altcoin by market capitalization, was trading at $2,367 at the time of writing, up 2% over the last 24 hours. Fourth-place XRP (XRP) has gained nearly 2% over the last day to trade just above $1.41. Dogecoin (DOGE) climbed the most among the top 10 cryptocurrencies, up 3.5% over the same period.Related: BTC price can ‘easily’ hit $95K: Five things to know in Bitcoin this weekAs a result, the global crypto market capitalization is up 1.6% over the last day toward $2.65 trillion on Monday.Performance of top-cap cryptocurrencies: Source: CoinMarketCap“Bitcoin looks primed for upwards momentum,” MN Capital founder Michael van de Poppe said in an X post on Monday. The analyst added that a “breakout above $79K opens the opportunities” toward the $86,000-88,000 resistance zone and later to $90,000.BTC/USD daily chart. Source: X/Michael van de Poppe“It’s a disbelief rally” for Bitcoin, crypto analyst Matthew Hyland said in response to Bitcoin’s latest push above $80,000, adding:“The many calling for $60K and below will be the ones flipping bullish late above $90K.”Bitcoin’s rally is accompanied by significant short liquidations across the crypto market totaling $452 million over the last 24 hours, signaling intense buying by traders.Meanwhile, Bitcoin taker buy volume saw “two consecutive large hourly buy-volume spikes on Binance of approximately $1.19 billion and $792 million,” CryptoQuant analyst Amr Taha said in a Quicktake note on Monday, adding:“When this type of volume appears near a major breakout level, it often shows that traders are not waiting for a pullback; instead, they are chasing confirmation as the price moves higher.”Bitcoin taker buy volume on Binance. Source: CryptoQuantBTC bulls target $84,000 nextAs Cointelegraph reported, Bitcoin bulls were required to push above $80,000 to sustain the upward momentum.Bitcoin’s 5.5% rally over the last five days saw the BTC/USD pair reclaim key support levels, including the true market mean at $77,500 and the short-term holder cost basis around $78,000. Traders now shifted their focus to the CME gap at $84,000, formed in early February.BTC/USD four-hour chart. Source: X/AlphaBTCBitcoin is on “its way to close the previous large gap from $84K,” trader Daan Crypto Trades said in a Monday post on X, adding“Good to mark these levels on your chart as they could act as ‘magnets’ and local reversal zones if price trades close/into them.”Meanwhile, Bitcoin’s 30-day liquidation map reveals that a break above $84,000 would trigger over $2.85 billion worth of leveraged short liquidations across all exchanges.Bitcoin exchange liquidation map. Source: CoinGlassThis article is produced in accordance with Cointelegraph’s Editorial Policy and is intended for informational purposes only. It does not constitute investment advice or recommendations. All investments and trades carry risk; readers are encouraged to conduct independent research.

Čítaj viac

Získaj BONUS 8 € v Bitcoinoch

nakup bitcoin z karty

Registrácia Binance

Burza Binance

Aktuálne kurzy