Autor Cointelegraph by Nancy Lubale

XRP metrics line up bull signals for ‘full-scale rally’ to $2

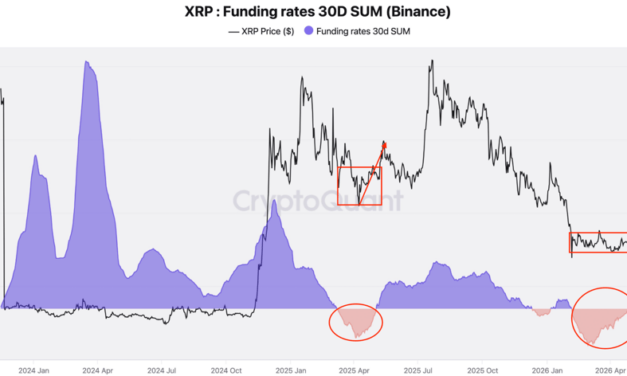
XRP (XRP) rallied 9% over the weekend to $1.50 as several technical and onchain indicators suggested it was due for a “full-scale” upward breakout.Key takeaways:XRP’s funding rates and Bollinger Bands indicator warn of volatility in the coming days.XRP’s symmetrical triangle breakout targets $2.05.XRP bullish reversal signals emergeData from TradingView showed XRP/USD remained 60% below its multiyear high of $3.66 reached in July 2025 and traded 21% below its yearly open of $1.83. Despite this drawdown, several price indicators hinted at a potential upward breakout ahead.Analyzing XRP’s funding rates on Binance, analyst Darkfost flagged a key bullish signal, setting XRP/USD up for an upward run. Related: XRP price copies 2025 chart fractal that last time sparked 66% gainsThe funding rates 30-day sum on Binance have “maintained a bearish bias for nearly three months, even as XRP has posted a 27% gain over the same period,” the analyst said in a recent post on X, adding:“When such a strong consensus forms, especially after a correction exceeding 60%, it is often a sign that a potential reversal may be developing.”XRP/USD funding rates. Source: CryptoQuantPrevious instances show that XRP tends to rise sharply when funding rates recover after prolonged periods of being negative.This notably happened in April 2025, when XRP reached $1.25, before a “bullish recovery eventually triggered a rally that led to a 126% advance,” the analyst added.Meanwhile, the Bollinger Bands indicator, used by traders to assess price momentum and volatility within a certain range, reached its tightest point in 10 months, signaling that a significant price move could be underway.The two-day XRP Bollinger Bands have slipped to their tightest level since July 2025, as shown in the chart below.The XRP/USD pair surged about 90% in July 2025 to its multi-year high at $3.66, after breaking above the upper boundary of the Bollinger Bands. The gains were 72% in July 2024.XRP/USD two-day chart. Source: Cointelegraph/TradingViewAnalyst Seth said XRP has printed the “tightest Bollinger Band squeeze in years” on the daily time frame, adding:“History says this kind of setup resolves with force.”XRP/USD daily with tightening Bollinger Bands. Source: X/SethAs Cointelegraph reported, multiple technical indicators suggested that XRP/USD is bottoming out, pointing to a possible rally to as high as $12.XRP symmetrical triangle breakout is underwayThe XRP/USD pair has broken above a symmetrical triangle on the daily chart, a setup typically associated with bullish reversals after prolonged consolidation.The price has been compressing between two converging trend lines since February, with the upper boundary now acting as key support near the $1.40 psychological level.A daily candlestick close above this level could open the way for a run toward the bullish target of the prevailing chart pattern at $2.05, roughly 41% above the current price. XRP/USD daily chart. Source: Cointelegraph/TradingViewMeanwhile, the moving average convergence divergence (MACD) indicator is trading above the zero line and has produced a bullish cross, indicating rising buying momentum. Historically, similar MACD crossovers have preceded strong rebounds in XRP.Analyst CW8900 said a “full-scale rise for $XRP is imminent,” after the price bounced off a multi-year support line on the three-day chart. XRP/USD three-day chart. Source: X/CW8900As Cointelegraph reported, buyers must break and sustain the XRP price above the $1.40- $1.61 seller congestion zone on the daily chart to signal a long-term trend shift.

Čítaj viac
Bitcoin’s ‘overbought’ signal flashes price top warning with focus on $78K

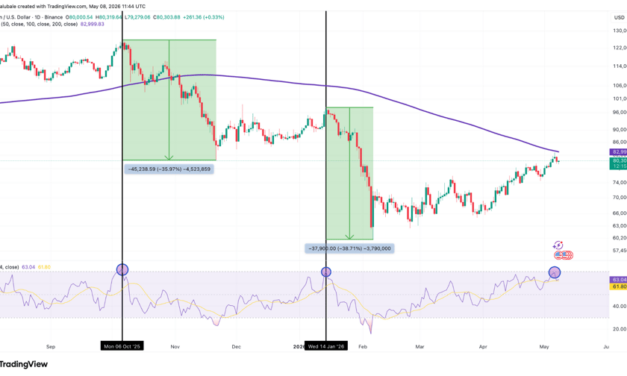
Bitcoin (BTC) traders expect a short-term correction as a key BTC price strength metric rises to its highest levels in almost fifteen weeks.Key takeaways:Bitcoin’s “overbought” RSI historically precedes significant corrections.Bitcoin could see a short-term price drop if the price breaks below the $78,000 support.Bitcoin metrics suggest BTC price is “overheated”Bitcoin’s 36% rally to $82,800 on Wednesday from its macro low of $60,000 has significantly impacted its daily RSI.On the daily chart, the RSI rose to 70 on Wednesday from local lows of 39 in March. “$BTC’s daily RSI went overbought right as we tagged the 200-day EMA,” trader Jelle said in a Friday post on X, adding:“It makes sense to find resistance here.”BTC/USD weekly chart. Source: Cointelegraph/TradingViewRSI measures trend strength and contains three key levels for observers: the 30 oversold boundary, the 50 midpoint and the 70 overbought threshold.When the price crosses these levels, depending on the direction, traders can infer about the future of the current trend. After rallies, BTC usually corrects once the RSI enters the overbought territory.Related: Bitcoin bulls target $115K by December: Does data back the expectation?Analyst Crypto Tice said this is a “rare” signal that has occurred only four times over the last year, with every occurrence leading to a “short-term pullback,” adding:“Overbought conditions on the daily don’t resolve sideways. They resolve with a flush.”Fellow analyst Rekt Fencer pointed out that the “last 2 times this happened, it dumped” 35%-38%, as shown in the chart above.Meanwhile, Bitcoin’s market value to realized value (MVRV) ratio, which measures whether the asset is overvalued, recently entered the “overheated” zone.“Bitcoin breaks above the overheated level on the short-term holder Bollinger Bands for the first time since November 2024,” analyst FrankAFetter said in a recent post on X.The last time it was at similar levels was in November 2024 before a 15% BTC price drop.Bitcoin  STH MVRV Bollinger Bands. Source: CheckOnChainBitcoin support at $78,000 becomes key for BTC priceBitcoin traders agree that $78,000 has now become an important area of support for BTC/USD.The 200-day exponential moving average at $83,000 is acting as resistance, while the “first main area of interest sits at $78,000,” analyst Jelle said in an X post on Friday, adding: “Turn that into support and we can have another go at the MAs.”BTC/USD daily chart. Source: X/JelleFellow analyst Tradermayne said holding the support at $78,000-$80,000 on low time frames would give “bulls a very easy bias level.”BTC/USD weekly chart. Source: Trader MayneOrders are sitting on both sides of the spot price, with analyst Master of Crypto seeing the likelihood of these liquidity clusters being taken out.“$BTC is holding around the $78.5K–$79.1K support zone,” the analyst said in a Friday post on X, adding:“If buyers defend this area, the next move could be toward $82K–$83K where a lot of liquidity is sitting. But if this support breaks, Bitcoin could quickly drop to $75K–$76K.”Bitcoin liquidation heatmap. Source: CoinGlassThe Bitcoin liquidity map shows that a correction below $78,000 would trigger over $3.1 billion worth of leveraged long liquidations across all exchanges.Bitcoin exchange liquidation map. Source: CoinGlass

Čítaj viac

Four signs that show Ethereum's rally is exhausted at $2.4K

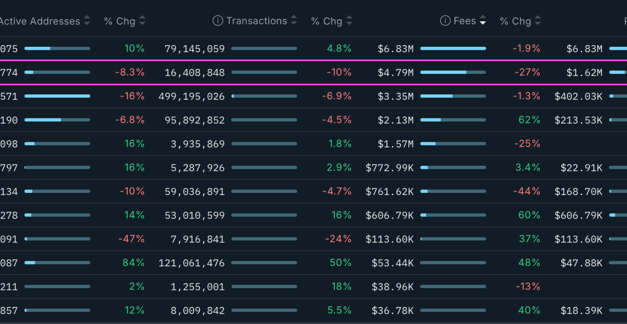
Ether’s (ETH) price has retraced by over 5.6% to $2,275 after being rejected by resistance at $2,400. Now, multiple data points suggest ETH/USD may drop below $2,000.Key takeaways:Low network activity signals declining usage and reduced onchain demand for ETH.Coinbase Premium remains negative as spot Ethereum ETF outflows returned, reflecting strong US-driven sell pressure.Ether’s falling wedge pattern targets $1,830.Ether’s total value locked hits 12-month lowsEthereum’s network fundamentals are weakening, with weekly average transactions dropping by 10% to 4.79 million, per data from Nansen. Active addresses dropped by 8% to 2.5 million over the same period. Related: Three reasons why Ether price rallies fizzle near $2.4KNetwork fees also dropped by approximately 27%, leading to a 47% reduction in onchain revenue over the last seven days. Blockchain comparison: Daily transactions, active addresses and network fees. Source: NansenAdditional data from DefiLlama shows that the weekly DEX volumes dropped to $1.64 billion on May 8, a 46% drop over the last three weeks.Low transaction count, a drop in active addresses and declining DEX volumes reflect reduced ecosystem usage. As a result, the total value locked (TVL) in Ethereum’s DeFi protocols has dropped to $124.7 billion, levels last seen in May 2025.Total value locked on Ethereum. Source: DefiLlamaThis subdued network activity signals weak user conviction, affecting Ether’s ability to sustain upside price momentum. Ether’s exit queue jumps 72,000%Ethereum’s unstaking queue jumped by approximately 72,000% within two weeks to 530,985 ETH on May 2. As of Friday, over 202,000 ETH were queued for redemption, with a wait time of around three days.Number of Ether queued for exit. Source: Validator QueueThe surge comes after a series of significant DeFi hacks, reflecting investor caution. April 2026 saw DeFi platforms suffer a record $625 million in monthly losses following 30 separate attacks, including a $292 million loss from the KelpDAO bridge hack, leading to over $15 billion in deposits withdrawn from the Aave platform. These incidents have prompted investors to unstake ETH to regain liquidity, signaling flight from perceived risk.“The exit queue went from ~700 ETH to ~500K ETH in 2 weeks,” analyst Pete said in a recent post on X, adding:“DeFi yield on Ethereum is getting crushed by hacks, exploits and increasingly nasty attack surfaces.”Despite the sharp surge in outflow pressure, 3.6 million ETH remains queued for staking entry (7x exit volume), pushing total staked ETH to 38.6 million (31.72% of supply) despite 45-day wait times.Ether’s Coinbase Premium remains negativeThe Ethereum Coinbase Premium Index, which tracks the price difference between ETH on Coinbase and Binance, has stayed negative since April 27.A negative premium confirms that the selling pressure is originating heavily from US entities. As long as US investors are selling at a discount compared to the global market, downside momentum will likely accelerate.Ethereum Coinbase Premium Index. Source: CryptoQuantAdditionally, US-based spot Ethereum ETFs snapped a four-day inflow streak with $103 million in net outflows on Thursday, the largest withdrawal since mid-March.Spot Ethereum ETFs flows chart. Source: SoSoValueCoupled with more than $81.6 million in outflows from global Ethereum investment products last week, this points to institutional selling, adding to Ether’s headwinds.Meanwhile, ETH taker buy volume dropped to as low as -$25 million on Binance in recent days, indicating a “sharp increase in aggressive market sell orders,” CryptoQuant analyst BorisD said in a Quicktake note on Friday, adding:“This structure raises the risk of short-term volatility and a support retest for ETH price action.”ETH taker buy volume on Binance. Source: CryptoQuantEther’s rising wedge breakdown is underwayThe daily chart shows the ETH/USD pair validating a rising wedge pattern after the price lost support at the pattern’s lower trend line at $2,300. Bulls are now fighting to keep the price above $2,150-$2,200, where the 100-day and 50-week simple moving averages (SMAs) are, respectively.Another key line of defense is the $2,000 psychological level, which, if breached, would clear the path for Ether’s drop toward the measured target of the wedge at $1,830, about 20% below the current price.ETH/USD daily price chart. Source: Cointelegraph/TradingViewAs Cointelegraph reported, the ETH price may descend to $1,750-$1,850 if support at $2,300 is not reclaimed in the short term.This article is produced in accordance with Cointelegraph’s Editorial Policy and is intended for informational purposes only. It does not constitute investment advice or recommendations. All investments and trades carry risk; readers are encouraged to conduct independent research.

Čítaj viac

Bitcoin analysts say this level must break for BTC price to confirm bottom

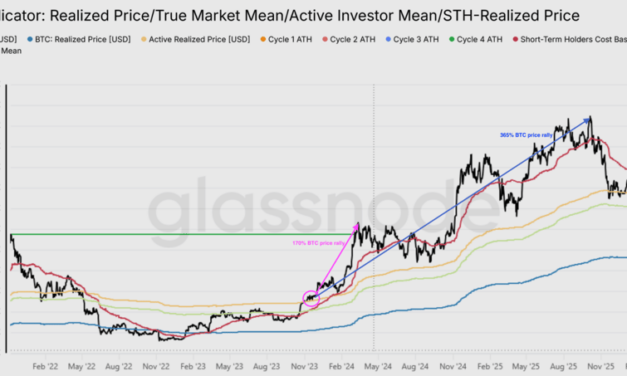
Bitcoin’s (BTC) relief rally to $82,000 appears to be cooling off, and analysts say key levels must be reclaimed for BTC price to “confirm a durable continuation higher.”Key takeaways:Bitcoin must break resistance at $85,000-$88,000 to confirm that the bottom is in.Profit-taking on rallies must cool down for a sustained breakout in BTC price. Bitcoin must reclaim $88,000 as supportBitcoin’s 7% climb over the last week to $81,000 saw it reclaim key levels, including the true market mean at $78,200 and short-term holder (STH) cost basis at $79,100.If the price sustains above these two levels, the 50% drawdown from the $126,000 all-time high to sub-$60,000 levels in February “would rank among the shortest episodes of its kind in Bitcoin market history,” Glassnode said in its latest Week Onchain newsletter, adding:“Attention now shifts to the next major resistance at the Active Realized Price near $85.2K, which tracks the cost basis of all non-dormant supply and represents the next structural threshold the market must reckon with.”Bitcoin risk indicator. Source: GlassnodeThe last time Bitcoin reclaimed its active realized price, in October 2023, it was followed by a 170% rally to its previous all-time high of $74,000 reached in March 2024. These gains increased to 365% once the price hit its current record highs above $126,000.Related: Bitcoin Bollinger Bands push key breakout as creator acts on ‘positive’ signal Bitcoin’s realized price by age cohorts reveals other major levels of resistance sitting higher up: the realized price of the three-to-six-month investor cohort at $88,880, the 12-month-18-month cost basis at $93,450 and the average purchase price of the six-to-12-month investor cohort at $111,850.“For the bottom to be confirmed, price needs to clear $88.88K and hold – not wick through, not retest and fail,” CryptoQuant analyst IT Tech said in a Thursday Quicktake note, adding:“Until then, every rally into $85K-$88K is walking straight into distribution from November 2025-Feb 2026, buyers desperate to get out flat.”Bitcoin realized price – UTXO age bands. Source: CryptoQuantA sustained move above that level could put recent buyers back in profit and reduce sell pressure, confirming a “durable continuation higher,” Glassnode added.Analyst MikybullCrypto highlighted Bitcoin’s core levels of resistance before a “mega solid trend change,” including $88,000 and $92,000, based on Fibonacci level analysis. “Overcome these resistances, then $100K is guaranteed.”BTC/USD daily chart. Source: MikybullCryptoProfit-taking by long-term holders could delay BTC price recovery Bitcoin’s current pullback below $81,000 could be attributed to increased profit-taking by long-term holders.Additionally, the 14-day simple moving average of profit realized by investors who have held BTC for more than one year has increased to about $180 million per day following the recent rally.Should the current recovery continue, “this distribution pressure is likely to intensify,” Glassnode said, adding:“The market’s ability to absorb this gradual increase in supply while sustaining the price above the True Market Mean will be the defining test of whether the current recovery has genuine structural legs.”Bitcoin realized profit by age. Source: GlassnodeMeanwhile, realized losses remain elevated at $479 million per day, approximately 140% above the $200 million per day cycle baseline. A sustained compression of this indicator below $200 million per day would serve as a strong indicator that selling exhaustion is setting in and confirm a “more durable recovery regime,” Glassnode said, adding:“Until that threshold is reached, the dual weight of long-term holder profit taking and top-buyer distribution at thin loss margins is likely to anchor the current rally.”Bitcoin realized loss. Source: GlassnodeThis article is produced in accordance with Cointelegraph’s Editorial Policy and is intended for informational purposes only. It does not constitute investment advice or recommendations. All investments and trades carry risk; readers are encouraged to conduct independent research.

Čítaj viac

Ether tests $2.4K as accumulators add 246K ETH: How high can price go?

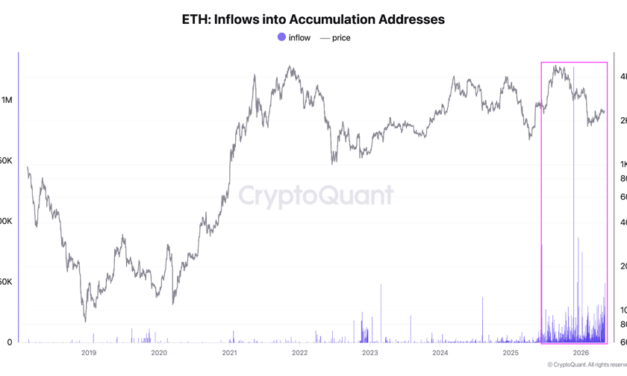
Ethereum accumulation addresses witnessed a surge in daily inflows on Wednesday, suggesting growing confidence in Ether’s (ETH) long-term price trajectory following its latest rise to $2,400.Key takeaways:Accumulation addresses absorbed about $592 million in ETH on Wednesday, signalling aggressive long-term buying.Ether’s ascending triangle projects an ETH price rally to $3,315.Ethereum accumulators add $592 million in ETHEther’s investor confidence has returned following its 39% recovery from a multi-year low below $1,750.Data from CryptoQuant showed daily inflows into accumulation addresses have increased steadily since mid-2025, reaching an all-time high of 1.14 million ETH in November 2025. The inflows have continued to climb in 2026, averaging 200,000 ETH per day.These addresses received 246,620 ETH on Tuesday, worth approximately $592 million at current rates.ETH inflows into accumulation addresses. Source: CryptoQuantAccumulation addresses are wallets that continuously receive ETH without making any outgoing transactions. They may belong to long-term holders, institutional investors, or entities strategically accumulating Ethereum rather than actively trading it.As a result, the total ETH held by these long-term holders reached a record 25 million ETH, marking a 20.36% jump so far in 2026. Large spikes in inflows to these addresses often signal strong confidence in Ether’s long-term potential, with past trends showing that such surges frequently precede price rallies.For example, on June 22, 2025, Ethereum accumulation addresses recorded a daily inflow of over 380,000 ETH. Nearly 30 days later, ETH’s price rose by almost 85%. A similar price rally followed November 2025’s inflow spike into the accumulation addresses.Whale wallets are also showing bullish signals. The chart below shows that whale wallets with a balance of 10,000-100,000 ETH have seen their holdings rise to an all-time high of over 19.5 million tokens, after rapid accumulation over the last 30 days.Wallets with over 100,000 ETH have also increased their holdings to 4.7 million ETH, a 30% increase in 2026. Ethereum: Balance by holder valueAs Cointelegraph reported, Ether’s spot taker cumulative volume delta, which has been increasing since early April, also suggested growing confidence among buyers.How high can the ETH price go?Ether’s liquidation heatmap shows the price eating away liquidity around $2,400, with large bid orders still sitting at $3,000, and between $3,350 and 3,500.“If $ETH breaks through $2,500, a steady rise to $3,000 will follow,” crypto analyst CW8900 said in a Wednesday post on X, adding:“There is almost no resistance for short positions.”ETH liquidation heatmap. Source: CoinGlassFrom a technical perspective, the ETH/USD pair is seeking to break above the horizontal trend line of an ascending triangle at $2,400.A daily candlestick close above the 200-day exponential moving average at $2,700 will confirm the continuation of the uptrend toward the measured target of the triangle at $3,315. Such a move would bring the total gains to 40%.ETH/USD daily chart. Source: Cointelegraph/TradingViewTechnical analyst XForceGlobal shared a chart suggesting that Ether’s macro bottom could be in, with an Elliott Wave analysis projecting a rally to $3,500 once resistance at $2,600-$2,700 is broken.ETH/USD daily chart. Source: XForceGlobalAs Cointelegraph reported, a close above the $2,600-$2,700 region would confirm a trend change, paving the way for the ETH/USD pair to rally toward $3,000.This article is produced in accordance with Cointelegraph’s Editorial Policy and is intended for informational purposes only. It does not constitute investment advice or recommendations. All investments and trades carry risk; readers are encouraged to conduct independent research.

Čítaj viac

Získaj BONUS 8 € v Bitcoinoch

nakup bitcoin z karty

Registrácia Binance

Burza Binance

Aktuálne kurzy