Autor Cointelegraph by Nancy Lubale

Altcoin season ‘quietly’ starting? Analysts spot three bullish indicators

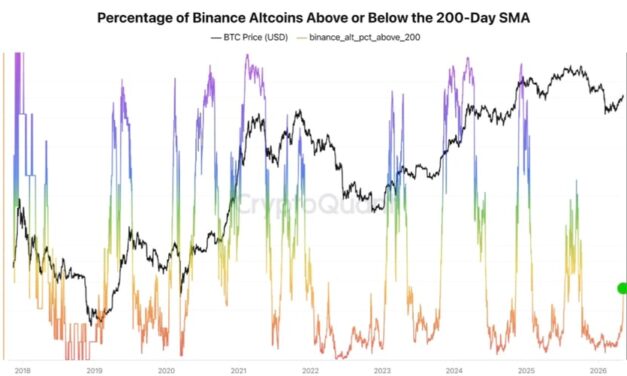
Crypto market analysts say increasing altcoin performance and volumes on Binance, a rising altseason index and a strengthening TOTAL2 macro structure are early signs that the market could enter an altseason in 2026. Key takeaways:Altcoin recovery signals emerge, hinting at a potential altseason in 2026.Rising altcoin trading volume on centralized exchanges and AltSeason Index point to possible capital rotation from Bitcoin.Altcoin market cap chart shows improving technicals. Altcoin market shows early signs of recoveryCrypto analyst Darkfost said that macroeconomic uncertainties surrounding the ongoing US and Israel-Iran war saw the altcoin sector correct by more than 50%.However, the sector appears to be quietly “awakening” as the percentage of altcoins on Binance trading above their 200-day moving average (MA) increased to 21%, levels last seen in September 2025, suggesting that “investor interest in altcoins appears to be gradually returning,” Darkfost said in a Quicktake note on Wednesday, adding:“This represents a crucial indicator for those looking to gain exposure.”Performance of altcoins on Binance. Source: CryptoQuantDarkfost cautioned that it’s still too early to call for an altseason as the metric remains below the levels seen in mid-2025 and Q4 2024, when most altcoins traded between 60-80% above their 200-day MA. Meanwhile, fellow analyst CryptoOnchain pointed to rising activity on centralized exchanges (CEX) as another sign of increasing momentum in altcoins. According to the analyst, altcoin trading volume, excluding the five largest cryptocurrencies, has increased steadily over the past few weeks. The chart below shows the appearance of an Altcoin Volume Increasing Trend (yellow bars), which occurred when the 30-day MA for altcoin trading volume crossed above its 365-day MA.Historically, when this metric flashes yellow, “it signals a clear rotation of capital from major caps into mid and low-cap altcoins,” the analyst said, adding:“If this momentum is sustained, it could serve as a strong confirmation that a broader altcoin rally is underway.” CEX volume ratio vs. Top 5 crypto. Source: CryptoQuantAltcoin  season “approaching”The 90-day AltSeason Index also climbed to 28.6, its highest level in months. The index tracks whether a majority of altcoins outperform Bitcoin over the last 90 days. “The altseason is starting quietly,” CryptoQuant analyst CW8900 said in a recent Quicktake note, referring to the “rapid rise” in the index over the last few weeks, adding:“The real AltSeason is approaching.”Altcoin season index. Source: CryptoQuantAlthough the index has been recovering, its value of 28.6 means only 28.6% of the top 50 cryptocurrencies by market capitalization have outperformed Bitcoin over the last 90 days. This falls short of the 75% “altseason” threshold, according to Blockchaincenter. These include ZCash (ZEC), Bittensor (TAO) and Morphor (MORPHOR), which are up 98%, 72% and 68% over the last three months, compared to Bitcoin’s (BTC) 17% gains. Top 50 Performance over the 90 days. Source: BlockchaincenterCW8900 added:“The indicator also shows that there was no real AltSeason in this cycle. The period when the AltSeason Index reached its highest point was early 2024, and even that value was relatively low compared to previous AltSeasons.”Altcoins show signs of bottoming outData from TradingView showed TOTAL2 — the cumulative market capitalization of all cryptocurrencies except Bitcoin — bouncing off the lower trend line of a multi-year broadening wedge that has defined its price action since mid-2022. In a Wednesday post on X, analyst cryptocupra said TOTAL2’s breakout could mirror the 2021 breakout and rise as high as $8 trillion, adding that “altseason is inevitable.”Altcoins market cap, TOTAL3. Source: X/1000xgirlNebraskangooner’s chart showed TOTAL2 breaking above the upper boundary of an ascending triangle on the daily time frame.TOTAL2 is “breaking out from this bottoming pattern, the analyst said in a recent X post, adding:“Altcoin market primed for more upside as long as this breakout holds.”TOTAL2 daily chart. Source: X/NebraskangoonerFellow crypto analyst GorkemCrypto also shared a bullish argument with a 2021 fractal that projects Bitcoin dominance falling to 40% as capital rotates into altcoins.Bitcoin dominance. Source: X/GorkemCryptoHowever, as Cointelegraph reported, the Bitcoin Dominance Index has climbed to its highest level since November 2025. BTC dominance has been climbing since 2023, suggesting that the current trend still favors BTC over altcoins.

Čítaj viac
Traders say Ethereum ready for a 'strong move' after ETH price taps $2.3K

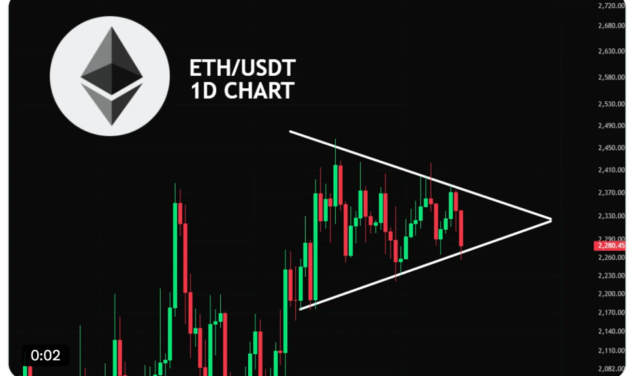
Market analysts said Ether (ETH) was ready to continue its uptrend following moves by JPMorgan and BlackRock to launch tokenized funds on the Ethereum network. Key takeaways:Institutional adoption is underway as JPMorgan and BlackRock plan to launch tokenized funds on Ethereum.Strong technical structures in multiple time frames suggest ETH price is bottoming out. ETH traders anticipate the price to “outperform”Data from TradingView showed ETH/USD trading at $2,320, up 2% over the last 24 hours. The pair failed to crack through resistance at $2,400 last week, as spot Ether exchange-traded fund (ETF) outflows and rising balance on Binance derailed Ether’s recovery.As such, bulls must push and hold the ETH/USD pair above $2,400 to continue the uptrend.In a Wednesday post on X, analyst CryptoJack said ETH is “getting ready for a pump” as it consolidates inside a symmetrical triangle on lower time frames.“A breakout could lead to a strong move soon.”ETH/USD chart. Source: X/CryptoJackCrypto Patel’s chart shows ETH trading inside an ascending triangle that has guided its price action since 2020. ETH is bouncing off the triangle’s lower trendline around $1,800, a zone that previously acted as a launchpad for large upside moves.The analyst sets the upside target for Ether at $10,000-$15,000, saying:“$ETH will outperform this cycle.”ETH/USD two-week chart. Source: X/Crypto PatelFellow crypto analyst Celal Kucuker also shared a bullish argument, laying out a long-term roadmap that places ETH on course for a possible move above $24,000.ETH/USD one-month chart. Source: X/Celal KucukerMomentum indicators support the rebound thesis. Ether’s monthly relative strength index (RSI) has cooled toward a historical support area near 42-455, similar to levels that preceded past rallies.As Cointelegraph reported, buyers will be back in control once the ETH/USD pair breaks above the $2,450-$2,600, confirming a trend shift.Institutional adoption fuels Ether’s bullishnessAs Cointelegraph reported, JPMorgan is set to launch a tokenized money market fund on Ethereum, allowing stablecoin issuers to hold reserves backing their stablecoins while earning interest.Related: Bitmine slows Ethereum buys, targets December to own 5% of supplyBlackRock, the world’s largest asset manager, has also filed for tokenized versions of its Treasury liquidity funds, where official ownership records will be maintained on Ethereum using ERC-20 token standards.Source: Cointelegraph“Institutional adoption just hit another level,” analysts at Ethereum Daily said in a post on X on Wednesday. “This is the most bullish news for Ethereum,” X user Borovik said in a reaction to the news on Wednesday.Tokenized funds on Ethereum, bulls argue, will drive onchain activity, increase gas demand and total value locked (TVL). This will, in turn, boost the blockchain’s legitimacy, making ETH the preferred settlement layer for trillions in TradFi capital. Data from RWA.xyz shows that global tokenized funds already exceed $31 billion, with Ethereum dominating approximately 55% of the space.Total global RWA value. Source: RWA.xyzThese were not the only bullish news for Ethereum. MN Capital founder Michael van de Poppe said that the approval of the CLARITY Act, which is scheduled for markup on Thursday, would be a “massive trigger for the markets.” Market analyst Ethprofit.eth said the CLARITY Act “looks extremely bullish for Ethereum,” while Bitcoin Mami said “institutional demand is going insane post CLARITY Act,” pushing ETH price to $10,000.Polymarket bettors are pricing in a 60% chance that the CLARITY Act will be signed into law in 2026, down 5% over the last 24 hours.Odds of the CLARITY Act being signed into law in 2026. Source: PolymarketIf the CLARITY Act becomes law, Ether is expected to rally, as seen in July 2025, when the signing of the GENIUS Act into law preceded a 65% ETH price rise to its current all-time high of $4,950 from $3,000. 

Čítaj viac

XRP traders say bullishness ‘growing’ as ETFs log largest inflow since January

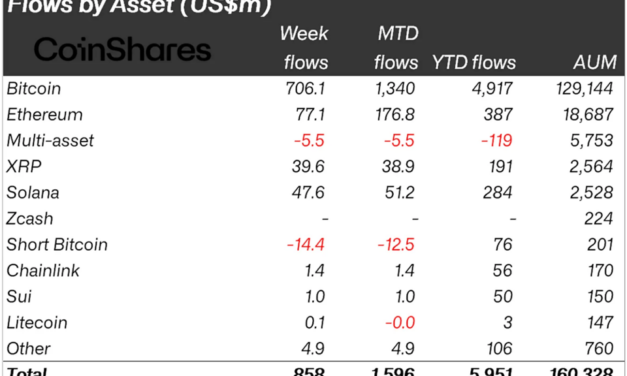
XRP (XRP) price is down 3.2% in the past 24 hours and 6% below its recent high of $1.50 to trade at $1.42 on Tuesday. Despite this pullback, analysts say XRP is still positioned for further gains backed by several market and technical factors.Key takeaways:Spot XRP ETFs logged $25.8 million in inflows on Monday, driving cumulative net inflows to a record $1.35 billion.Analysts say XRP price shows potential for a sustained rally, with charts targeting as high as $10. XRP ETF demand makes a comebackInstitutional demand for XRP investment products has been strengthening, according to data from CoinShares.XRP exchange-traded products (ETPs) posted inflows totaling $40 million during the week ending May 8. These investment products have now recorded $191 million in net inflows so far in 2026, bringing the total assets under management (AUM) to $2.5 billion.Related: XRP price copies 2025 chart fractal that last time sparked 66% gainsCoinShares head of research James Butterfill said this was a “notable acceleration” in inflows supported by developments around the US CLARITY Act, referring to a final compromise proposal regarding stablecoin yields released on May 1.Crypto funds net flows data. Source: CoinSharesMeanwhile, flows into spot XRP exchange-traded funds (ETFs) continue, with over $25 million on Monday, marking five consecutive days of net inflows, and the largest since Jan. 5.Spot XRP ETF flows data. Source: SoSoValueThis streak has pushed the AUM to 1.18 billion and cumulative net inflows to an all-time high of $1.35 billion.Cumulative net inflows into spot XRP ETFs. Source: bluroo.ai This indicates an increased institutional appetite for XRP products, which could positively impact the price.“XRP ETFs just recorded their biggest daily inflow” in over four months, crypto analyst Xaif Crypto said in a Tuesday post on X, adding:“Institutional money is accelerating into XRP at a pace the market is still underestimating.”Fellow analyst CW8900 said XRP’s 90-day spot taker cumulative volume delta (CVD) has flipped green, suggesting that “upward pressure in the spot market is increasing.”XRP spot taker CVD. Source: CryptoQuant. Source: X/CW8900As Cointelegraph reported, XRP social media sentiment recently increased to two-year highs, improving XRP’s chances of a sustained price recovery.Traders say XRP is “preparing for another rally”Data from TradingView shows XRP/USD is up 5% so far in May, with its futures open interest (OI) rising 23% over the same period, per data from CoinGlass.“The upward momentum of $XRP is growing,” CW8900 said in response XRP’s growing OI, adding:“It is preparing for another rally.”In a Tuesday post on X, analyst Bird said “XRP will rally next” after the price broke above a multi-month support line on the daily chart. XRP/USD daily chart. Source: X/BirdAnalyst ChartNerd argues that XRP’s bounce off a multi-month ascending support line sets “the stage for a breakout” toward $1.80, reinforced by a golden cross on the weekly MACD.CryptoPatel sets a more ambitious target, saying that the XRP/USD pair could repeat the Q4 2024 rally on “the road to $10” after breaking out of the $1-$1.30 accumulation range. BTC/USD two-week chart. Source: Crypto PatelAs Cointelegraph reported, multiple technical indicators suggested that an XRP price breakout may be underway, pointing to a possible rally to as high as $12.

Čítaj viac

Four signs that Bitcoin has recovered to ‘full’ bullish momentum

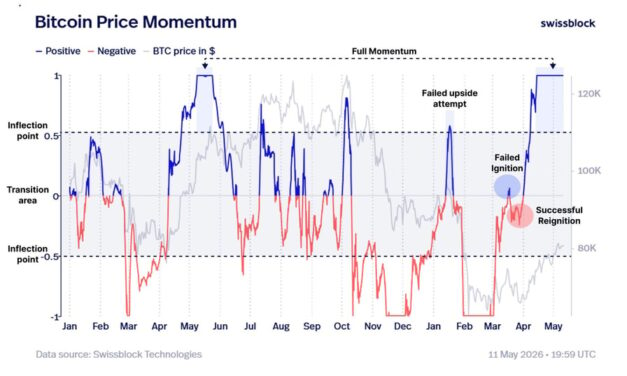
Market analysts said Bitcoin’s (BTC) upside remained intact despite the 2.5% correction from its multi-month high of $82,800 reached on May 6.Key takeaways:Bitcoin has successfully re-entered expansion territory as the Bull Market Support Band turned to support.Bitcoin’s Stablecoin Supply Ratio has recovered from historic lows, indicating fresh liquidity is returning.Bitcoin’s spot taker CVD flips positive, suggesting real spot demand is backBitcoin’s price momentum is expandingPrivate wealth manager Swissblock stated that Bitcoin is “still at full momentum,” despite the slight correction from recent highs.Swissblock said that the latest rally saw the Bitcoin price momentum “successfully reignited and pushed back into full expansion territory.”Related: Bitcoin funding rates turn positive: Is BTC rally to $85K next?Bitcoin is now consolidating inside the cost-basis battlefield, with the true market mean and the short-term holder cost basis around $80,000 acting as support and the active realized price at $85,000 as resistance. Meanwhile, “momentum remains structurally strong,” the wealth manager said, adding:“As long as momentum stays above the transition area, bulls retain control.”Bitcoin price momentum. SwissblockEchoing this observation, analyst The Great Mattsby pointed out that Bitcoin’s Bull Market Support Band has now turned into support, while the 21-week exponential moving average has crossed back above the 20-week simple moving average.“The trend has officially flipped back to bullish.” BTC/USD weekly chart. Source: X/The Great MattsbyBitcoin liquidity signals “strong recovery”The Stablecoin Supply Ratio (SSR) has recovered from its lower historical range below 10, the same zone that marked market bottoms in mid-2021, 2022 and mid-2023. Each time the SSR recovered from these lows, Bitcoin broke out of range and staged a strong rebound, as shown in the chart below.Bitcoin Stablecoin Supply Ratio: Source: CryptoQuantThe recovering SSR suggests that stablecoin liquidity is returning to exchanges again, potentially setting the stage for another bull run for BTC price.The Binance Stablecoin Supply Ratio Oscillator tells the same story. The chart below shows that Bitcoin’s 90D Stablecoin Supply Ratio Oscillator has moved back into positive territory, reaching 12-month highs at 2.8.“This reflects a strong recovery from the negative zone, with stablecoin purchasing demand becoming more active during the current rebound,” CryptoQuant analyst Zizcrypto said in a Tuesday QuickTake note, adding:“For context, the oscillator previously reached 2.43 in May 2025 and 4.00 in November 2024 — both during stronger market phases.”Stablecoin supply ratio oscillator. Source: CryptoQuantBitcoin’s transaction activity is at 20-month highsThe strength in BTC price is reflected in Bitcoin’s network activity, with daily transaction count rising by 116% in May to 831,450 on May 9.This metric was last at similar levels in September 2024, before Bitcoin later rallied above $100,000 during the broader market surge following the US presidential election.Bitcoin’s network activity is “more active than when it was at $100K,” analyst CW8900 said in an X post on Saturday, adding:“The network is already showing signals of a bull market.”Bitcoin daily transaction count. Source: CryptoQuantBitcoin’s daily active address count has also climbed, increasing by 7.1% over the last week to 707,719, while total fee volume surged 37% to $279,300 over the same period, according to Glassnode’s latest Market Pulse report.“Such a significant increase suggests heightened onchain activity, potentially signaling bullish market conditions.”Bitcoin daily active address count. Source: GlassnodeIncreasing transaction count, daily active addresses and fees means more users are interacting with the network. It suggests high network activity, often correlating with increased interest and market confidence.Bitcoin’s “real demand” is backBitcoin’s 90-day spot taker cumulative volume delta (CVD), a measure of the difference between buy and sell volume over three months, shows a “significant shift in capital flow structure,” according to CryptoQuant analyst Rei Researcher. The metric flipped positive (green bars in the chart below) in early May as the price broke above the $78,000 resistance and has remained positive since. “Taker Buy Dominance in the spot market indicates buying pressure from ‘major players’ (Whales/Institutions) looking to hold $BTC rather than just speculating via derivatives,” the Rei Researcher said in a recent Quicktake note, adding: “Real demand has prevailed. When bulls are willing to pay higher prices to own $BTC, a sustainable uptrend usually follows.”Bitcoin spot taker CVD. Source: CryptoQuantIf the CVD remains green, it could set the stage for another rally as seen in the past. A similar occurrence in May 2025 accompanied 65% BTC price gains. Meanwhile, Bitcoin’s spot demand is also accelerating, with spot CVD rising 47% to $62 million from $42 million a week ago, additional data from Glassnode shows.“This increase indicates a significant uptick in buying aggression among market participants,” the onchain data provider said, adding:“This behavior implies heightened conviction, with aggressive traders actively setting higher market prices, potentially signaling continued bullish momentum.”Bitcoin: Spot CVD. Source: GlassnodeAs Cointelegraph reported, Bitcoin’s market value to realized value (MVRV) ratio suggests BTC’s market structure is strengthening, which may be an early sign of a new bull market.

Čítaj viac

Bitcoin ‘golden cross’ appears for the first time since 2023: Will BTC price rally?

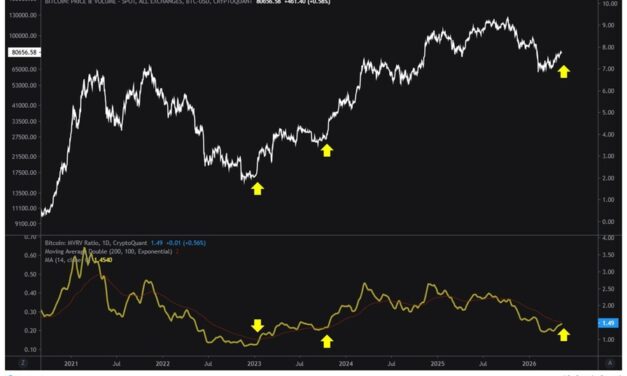
Bitcoin (BTC) could be set for an extended uptrend, with a pending bullish signal from a key valuation metric suggesting that BTC prices might go “much higher,” according to crypto analysts.Key takeaways:Bitcoin’s MVRV golden cross signals a shift to bullishness, historically preceding prolonged price rallies.Bitcoin traders argue $60,000 was the bear market bottom, see “huge” BTC price breakout next.Bitcoin MVRV momentum sends a “trend reversal signal”Bitcoin’s Market Value to Realized Value (MVRV) ratio, an indicator that measures whether the asset is overvalued, is about to print a “golden cross,” an occurrence that has previously preceded massive price rallies, according to CryptoQuant analyst CW8900.Related: Saylor signals another Bitcoin buy after hinting at selling in Q1 earnings call“A golden cross between the $BTC MVRV Ratio and the 200D EMA line is imminent,” the analyst said in an X post on Sunday, adding: “This signal is a representative trend reversal signal and is a bullish indicator.”Bitcoin MVRV momentum indicator. Source: CryptoQuantThe last time the indicator produced this bullish crossover was just after the 2022 cycle bottom, preceding a 90% BTC price rally to $31,000 from $16,300 in Q1 2023. Another cross in September 2023 was followed by a 400% bull run to the current all-time high of $126,000 reached in October 2025.In an earlier analysis, CW8900 highlighted a golden cross when the 30-day simple moving average (SMA) of Bitcoin’s MVRV ratio crossed above its 90-day SMA in late April, saying:“$BTC has completely turned to a bullish trend.”Source: CW8900Meanwhile, Bitcoin’s recent rally to $83,000 boosted the short-term holder (STH) cost basis level as newer buyers returned to profitability.STH cost basis refers to the average purchase price of investors who have held Bitcoin for less than 155 days.The chart below shows that the price could rise higher to touch the “heated” band of this metric, currently at $92,000. Despite profit-taking at current prices, the STH risk zone suggests BTC can go higher in the short term with the “heated” band at $92,000 and the overheated band at $104,000.Bitcoin short-term cost basis bands. Source: GlassnodeBitcoin analysts say BTC’s “huge breakout” is comingAs Cointelegraph reported, analysts say Bitcoin is at a make-or-break point as it retests the 200-day moving average at $82,500. A break above this level could end the multi-month downtrend, while a rejection could result in a fresh sell-off toward $50,000. Analyst Shib Spain argues that BTC’s break above a multi-month downtrend line on the weekly chart marked a structural shift from bearish dominance, reinforced by a bullish crossover from the MACD indicator. “Bitcoin’s huge breakout is coming. MACD bullish reversal forming,” the analyst said in a recent post on X, adding:“The bull run is just getting started.”BTC/USD daily weekly chart. Source: Shib SpainFellow analyst Moustache highlights the BTC market cap and its RSI bouncing off multi-year support lines on the monthly time frame, as shown in the chart below.“Just like in 2022, I’ve called the bottom for $BTC again this cycle,” the analyst said in an X post on Monday, adding:“Prices will go much, much higher. We’ve got something big to look forward to.”Bitcoin market cap, USD. Source: X/MoustacheAs Cointelegraph reported, several analysts predict a “supercycle” rally toward $180,000-$250,000 as early as this year, supported by institutional accumulation and a strengthening technical setup.

Čítaj viac

Získaj BONUS 8 € v Bitcoinoch

nakup bitcoin z karty

Registrácia Binance

Burza Binance

Aktuálne kurzy