Autor Cointelegraph by Nancy Lubale

Bitcoin falls to $76K after Trump says ‘clock is ticking’ for Iran

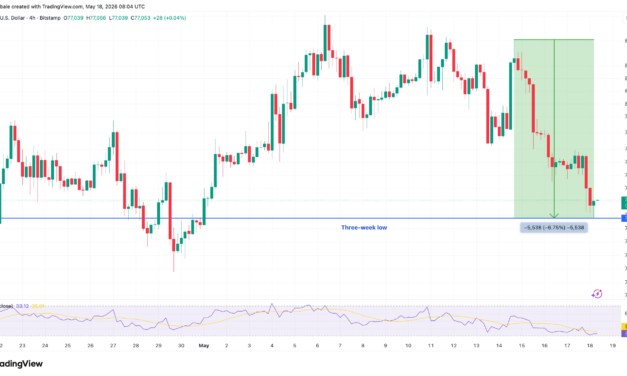
Bitcoin (BTC) dropped to $76,000 during the early Asian trading hours on Monday as US-Iran tensions resurfaced. Key takeawaysBitcoin falls to $76,500 as bearish momentum becomes increasingly tied to geopolitical developments.Over $607 million in long positions have been liquidated in the last 24 hours.Bitcoin traders say support at $76,000 should hold to avoid a BTC price drop to $65,000.Bitcoin hits three-week lows with 7% dropData from TradingView showed BTC price dropped as much as 7% over the last three days to three-week lows of $76,500, erasing all the gains made since May 1. BTC/USD one-hour chart. Source: Cointelegraph/TradingViewThe losses come just days after BTC/USD reached 13-week highs around $83,000, boosted by strong inflows into spot exchange-traded funds and optimism surrounding the US CLARITY Act.Related: BTC price ‘bull trap’ at $76.5K? Five things to know in Bitcoin this weekOn Sunday, however, US President Donald Trump issued fresh threats against Iran regarding delays in the peace agreement, warning that the “clock is ticking.”Source: TruthSocial/Donald J. Trump“Trump confirms the clock is ticking for Iran. The US is allegedly preparing for a potential new military operation against Iran,” analyst CryptoRover said in a Monday post on X, adding:“This is extremely dangerous for $BTC.”The move in Bitcoin was accompanied by $607 million in long liquidations over the last 24 hours, with BTC long liquidations accounting for $190 million.This brought the total liquidations across the crypto market over the last 24 hours to $677 million.Total crypto liquidation across all exchanges. Source: CoinGlassOil also saw volatility, with WTI rising over 3% in a matter of hours to $104 per barrel before correcting to $101.CFDs on WTI crude oil one-hour chart. Source: Cointelegraph/TradingView“WTI surged above $103 as Trump publicly lost patience with stalled peace talks and a waiver for Russian crude sales expired, adding to supply fears around the still-disrupted Strait of Hormuz,” trading resource Capital.com said in a Monday X post, adding:“Higher oil means hotter future inflation, reinforcing higher-for-longer Fed expectations and lifting both the dollar and yields — a tough combination.”Bitcoin traders say bears “back in the driver’s seat”Bitcoin traders, meanwhile, looked at the technical setup for clues as to where the price might head next.Analyst CryptoJelleNL said that a bearish divergence from the relative index as BTC/USD ran into resistance at $82,000 was responsible for the “pullback we’re in right now,” adding:“Bears getting back in the driver’s seat?”BTC/USD daily chart. Source: X/CryptoJelleNLMN Capital founder Michael van de Poppe said immediate support at $76,000 should hold to “prevent a market-wide crash.”An accompanying chart showed other support levels to watch if this area is lost, including the $71,000-$73,000 demand zone and the local low at $65,000.BTC/USD chart. Source: X/Michael van de PoppeThe local low at $65,000 coincides with the target of an inverted V-shaped pattern, as shown on the daily chart below. This represents a 16% drop from the current price.BTC/USD daily chart. Source: Cointelegraph/TradingViewNote that the BTC/USD pair experienced a similar sharp correction of the same magnitude after being rejected by the 200-day moving averages in April 2025.

Čítaj viac
Ethereum analysts see ‘downside risks’ as bears eye 20% ETH price drop

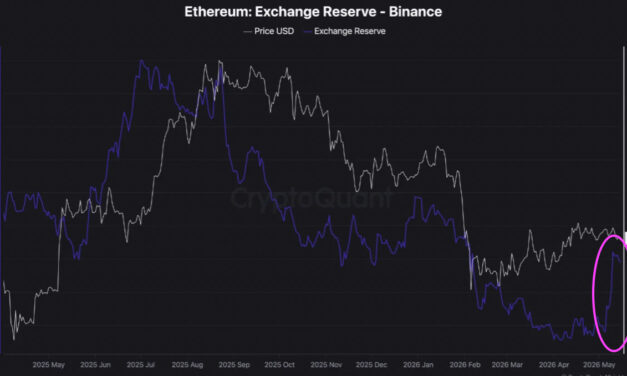
Market analysts say Ether (ETH) faces “downside risks” that could trigger another 20% downtrend toward $1,700, new analysis said.Key takeaways:Rising Ether supply on exchanges and declining ETF inflows suggested a possible ETH price drop over the coming days.Ether’s rising wedge pattern projected a potential 22% drop to $1,725ETH inflows to exchanges rise Ether’s 40% recovery from multi-month lows below $1,800 was dampened by resistance from the $2,400 level. Analysts have outlined several reasons for Ether’s inability to break $2,400, including “significant” inflows into exchanges, according to CryptoQuant analyst BorisD. The chart below shows a sharp increase in ETH reserves held on Binance to 3.84 million from 3.36 million between May 5 and May 9. The analyst explained that as inflows accelerated, the “price action failed to show strong continuation to the upside,” dropping 7% to $2,260 from $2,390 over the same period.“This suggests that liquidity was being both absorbed and distributed within the range,” BorisD said, adding:“The broader structure still points toward downside risk remaining dominant for now.”ETH exchange reserve on Binance. Source: CryptoQuantWhile other analysts see potential for fresh upside in the coming days, “those moves may primarily serve distribution purposes rather than signal the start of a strong bullish trend,” the analyst added. Making the same observations, fellow analyst PelinayPA said any short-term rebound in ETH would be “followed by high volatility, and then a continuation of the broader downtrend,” adding:“The large amount of ETH being moved onto exchanges continues to create significant resistance against upward price movements.”This coincided with sharp exchange inflows, as the Ether net position change among exchanges rose to 585,000 ETH on May 13, marking the largest spike since December 2025, when ETH was trading at $3,000. This preceded a 42% drop to $1,750 in February.ETH: Exchange net position changeSuch inflows typically indicate distribution by large holders, who move tokens from cold storage or redeem ETH investment products.Meanwhile, demand for spot Ethereum ETFs continues to decline, with these investment products recording outflows for four consecutive days, totalling $190 million. This points to a drop in demand from US investors, adding to Ether’s headwinds.Spot ETH ETFs flows chart. Source: SoSoValueEther’s rising wedge targets $1,725The daily chart shows ETH/USD validating a rising wedge breakdown, after the price breached the support provided by the lower trend line of the pattern at $2,280.A daily candlestick close below this level will confirm the breakdown, clearing that path for Ether’s drop toward the wedge’s measured target at $1,725, representing 22% decline from the current price. This coincides with its previous macro low reached on Feb. 6. ETH/USD daily chart. Source: Cointelegraph/TradingViewRising wedges are typically bearish reversal patterns, and Ether’s break below the pattern is “starting to become a concern,” analyst ShangoTrades said in a recent X post.Zooming out, fellow analyst CryptoBullGod said ETH could drop to $1,280, which is the measured target of a bear flag, as shown on the weekly chart below.ETH/USD weekly chart. Source: CryptoBullGod

Čítaj viac

Bitcoin stalls above $80K despite CLARITY Act pass: What will trigger a breakout?

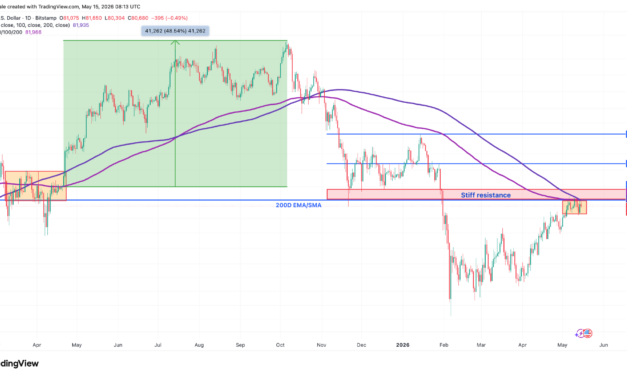
Bitcoin’s (BTC) Thursday rally to $82,000, buoyed by the Senate Banking Committee’s advancement of the CLARITY Act, has stalled amid stiff overhead resistance and weakening ETF demand. Still, analysts said that BTC’s upward momentum may increase if key conditions are met.Key takeaways:BTC bulls must flip the $82,000-$84,000 into new support.Return of strong institutional demand via spot Bitcoin ETFs is required for the uptrend to continue.  Bitcoin price must establish $82,000 as new supportData from TradingView showed BTC tested overhead resistance at $82,000, which has rejected the price since last week.Note that this is where the 200-day simple moving average (EMA) and the 200-day exponential moving average (SMA) converge, reinforcing the importance of this level.Related: Bitcoin trades at a ‘discount’ on Coinbase: Is a $76K retest next?“If Bitcoin is going to go higher, it should really break above the 200 EMA now at $82,000 and hold it,” analyst Sykodelic said in a Thursday post on X, adding:“Reject again here and I think we will get a deeper retrace, $74k – $77k levels.”Analysts at Galaxy Trading said that the price has been trading below these moving averages since October 2025, and breaking them will be “another bullish confirmation” for Bitcoin.BTC/USD daily chart. Source: Cointelegraph/TradingViewThe last time BTC price broke convincingly above the moving averages with strong volume was in April 2025, triggering a 48.5% rally to its current all-time high of $126,000.Bitcoin’s cost-basis distribution heatmap reveals another major level of resistance, sitting further up, between $84,000 and $85,400, where investors acquired roughly 1.05 million BTC.Analyst Sherlock said this is “one of the biggest supply clusters” that the BTC market must absorb to continue higher. Bitcoin cost basis distribution heatmap. Source: GlassnodeMeanwhile, Bitcoin’s liquidation heatmap shows heavy ask orders at $82,000-$83,000, highlighting the bears’ main line of defense. Bitcoin liquidation heatmap. Source: X/AlphaBTCAs Cointelegraph reported, a break and close above $82,000-$84,00 opens the gates for a rally to the $92,000 resistance zone. A close above this resistance zone could signal the beginning of the next leg up.Bitcoin ETF outflows diminishOne factor that could trigger a BTC price breakout is a resurgence in institutional demand, which has faltered amid inconsistent inflows into spot Bitcoin exchange-traded funds (ETFs).Data from Farside Investors shows that spot Bitcoin ETFs snapped a five-day inflow streak totaling nearly $1.7 billion with $269 million in outflows on May 7 as Bitcoin dipped below $80,000.These outflows continued this week, with the $635 million on Wednesday, marking the largest withdrawal since late January. Spot Bitcoin ETF flows table. Source: Farside InvestorsStrong and consistent inflows must return for Bitcoin to continue its recovery, Glassnode said in this week’s newsletter, adding:“If sustained, continued institutional accumulation could provide the demand base required for Bitcoin to challenge higher overhead supply zones in the weeks ahead.”Data from Capriole Investments, meanwhile, shows that while the number of Bitcoin treasury companies buying BTC daily has increased slightly over the last few weeks, it remains significantly lower than its peak seen in mid-2025.Bitcoin treasury companies buyers. Source: Capriole Investments Michael Saylor’s Strategy, the largest corporate Bitcoin treasury holder, is one of the few companies consistently buying, adding 535 BTC for $43 million last week.The purchase brought Strategy’s total Bitcoin holdings to 818,869 BTC, purchased for about $61.86 billion at an average price of $75,540 per coin.

Čítaj viac

XRP whale wallets hit all-time highs: Will it push price above $1.50?

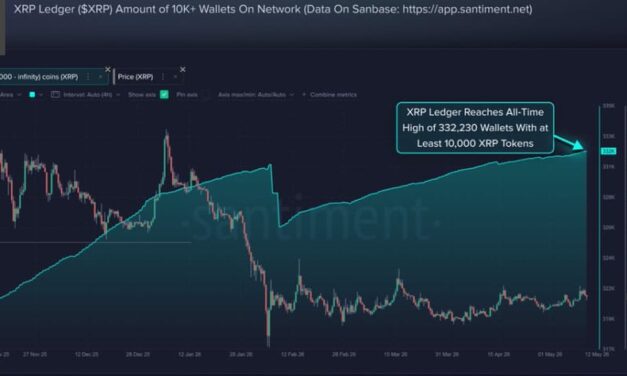
XRP (XRP) has recovered from its April lows of $1.26, rising as much as 19% to a three-week high of $1.50 on Sunday.Whale activity, network growth and a strengthening technical setup suggested that the XRP/USD pair was primed for a move higher once resistance at $1.50 is broken. Key takeaways:XRP whale addresses hit record highs of 332,230, indicating accumulation.XRP Ledger monthly transactions hit an all-time high of 71 million in April.Price must break above the $1.50 resistance to continue its upside toward $2.XRP whales show growing convictionXRP whales remain confident about the prospects of a breakout, using the recent consolidation range to accumulate more tokens. Santiment’s whale count metric indicates that the number of wallets holding at least 10,000 XRP has reached an all-time high of about 332,230.“This extends a consistent growth trend that has been building since June, 2024,” Santiment said in an X post on Wednesday.  Related: XRP analysts watch key support zone as $12 price target emergesThe market intelligence firm explained that the amount of mid to large stakeholders continuing to grow is an important long-term signal showing that “larger holders have kept accumulating even during periods of volatility and uncertainty,” adding:“Historically, rising numbers of mid-to-large wallets suggest increasing conviction from investors who are less focused on short-term price swings and more interested in long-term positioning.”XRP Ledger whale wallets. Source: SantimentThis aligns with growing XRP Ledger (XRPL) activity, whose monthly transactions jumped to a new all-time high of 71 million in April from 43 million a year ago, representing a 65% year-over-year growth, according to data from Evernorth.The XRP treasury firm said that the growth was driven by institutional utility tied to Bitstamp, RLUSD, Braza Bank, and DeFi protocols as XRPL continues to expand its compliance-focused infrastructure.XRPL transaction activity. Source: EvernorthMeanwhile, analyst CW8900 said XRP whale long positions remain dominant relative to retail positions, suggesting that they are “maintaining a bullish view” of the marketXRP whales vs. retail delta. Source: CW8900XRP needs to flip $1.50 into supportXRP is seeking to break out from an ascending triangle, which has capped its price action since early February,  as shown below.An ascending triangle is a bullish continuation pattern formed when the price consolidates between a horizontal resistance line (flat top) and a rising support trendline (higher lows). A breakout above resistance with increased volume often precedes a strong upward move.XRP appears to be on a similar trajectory, but bulls need to flip $1.50, where the 100-day exponential moving average (EMA) and the triangle’s resistance line converge, to confirm the breakout. Note that the price has been rejected from this supply area four times since mid-February.Another stiff barrier lies within the $1.67 and $1.70 supply zone, where the 200-day EMA sits. Higher than that, the next logical move would be toward the measured target of the triangle at $1.98, roughly 36% above the current price.XRP/USD daily chart. Source: Cointelegraph/TradingView“$XRP has been defending its daily 20 EMA since it was reclaimed in early May ($1.42), which has since been guiding the price higher,” analyst ChartNerd said in a Thursday post on X, adding:“$1.50/55 remains an imminent resistance to break.”Zooming out, fellow analyst Neel said XRP/USD “needs a clear break above $1.60 for any meaningful short-term rally,” but rising above $2.00 would “generate fresh momentum.”XRP/USD weekly chart. Source: X/NeelAs Cointelegraph reported, the $1.50-$1.60 is a critical level for the bulls to overcome in the short term, as a break above could signal a potential trend change, propelling XRP price toward $2.40.

Čítaj viac

Analysts are watching these Bitcoin price levels ahead of CLARITY Act vote

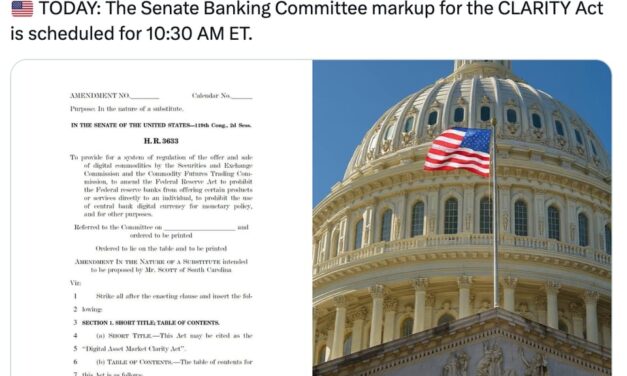
Bitcoin (BTC) bulls made another attempt to reclaim the $80,000 level on Thursday, as traders expect price swings before and after the CLARITY Act vote.Key takeaways:Odds of the CLARITY Act being signed into law in 2026 rose to 67% in May.BTC price must hold $78,000-$79,000 as support for a bullish push to $84,000 or higher.A 67% chance the CLARITY Act is signed into law in 2026The CLARITY Act, a proposed US bill that would set clearer rules for how regulators oversee the crypto market and stablecoins, is scheduled for a Senate Banking Committee markup vote on Thursday.Source: CointelegraphPrediction market traders say that there is a 67% chance that the CLARITY Act will be signed into law in 2026, according to Polymarket.Odds of the CLARITY Act being signed into law in 2026. Source: PolymarketTraders on rival site Kalshi price-in the odds of the Act becoming law before August and Dec. 31, 2026, at 62% and 67%, respectively.If the CLARITY Act passes, it could clearly classify Bitcoin as a digital commodity under the Commodity Futures Trading Commission (CFTC) oversight, reducing legal uncertainty for the industry and further legitimizing crypto in the US. Related: Bitcoin to $100K in Q2? Strategy’s STRC unlocks potential to buy 3K BTC in two daysBitcoin is expected to react positively, similar to the GENIUS Act signed in July 2025, which provided the first major US stablecoin framework. Bitcoin was already trading near all-time highs and climbed further amid regulatory optimism.MN Capital founder Michaël van de Poppe was bullish, saying:“Big day today with the CLARITY Act vote. Might be a historical day for everyone involved in Crypto and could, very well, signal the start of a stronger cycle.”Analyst Sharky predicts a muted immediate pump, with the real strong move coming “90 days later, when institutional money finally has legal clarity.”Not all analysts were optimistic about the event, however, with trading resource Material Indicators saying the passing of the CLARITY Act is “somewhat baked-in to $BTC price,” adding:“Passing it will likely deliver a knee-jerk reaction from the market that pumps price briefly, but like all narratives, that rally will fade.”As Cointelegraph reported, some traders expect a quick move in Bitcoin price toward $90,000 following the CLARITY Act vote, supported by improving market conditions and easing selling pressure.Analysts highlight key BTC price levels to watchBitcoin may have delivered an impressive bounce to $82,000 last week, but the bullish sentiment was dampened by resistance from the 200-day moving averages around this level.The support at $78,000 remains key for bulls, representing the short-term holder realized price and the true market mean.This coincides with the 21-week exponential moving average (green line), as highlighted by analyst Rekt Capital in the chart below, saying:“Downside wicking below it would be fine as long as price ends the week with a weekly candle close above the EMA to confirm it as retested support.”BTC/USD weekly chart. Source: X/Rekt CapitalBitcoin’s realized price by age cohorts reveals another major level of support sitting further down: the cost basis of the 1-week-to-1-month investor cohort at $76,900.“The momentum of the ongoing rally has been driven largely by a wave of accumulation over the past 30 days,” Glassnode said in its latest Week Onchain newsletter, adding:“This cohort’s cost basis now sits at approximately $76.9K, forming the most immediate support floor in the short term.”Bitcoin realized price by age. Source: GlassnodeOn the upside, the cost basis of investors who accumulated BTC during the November 2025-February consolidation period at $86,900 represents the “most probable near-term resistance zone as these holders approach breakeven and face a growing incentive to distribute into strength,” the onchain data provider added. Crypto trader and analyst Daan Crypto Trades said a break above $82,000 will see BTC rise to fill the CME gap at $84,000, eventually “continuing quite a lot higher” from that point.BTC/USD daily chart. Source: X/Daan Crypto TradesAs Cointelegraph reported, key support levels for the bulls were the 20-day EMA at $79,000 and the 50-day SMA at $74,000, while bears were expected to defend $84,000.

Čítaj viac

Získaj BONUS 8 € v Bitcoinoch

nakup bitcoin z karty

Registrácia Binance

Burza Binance

Aktuálne kurzy