Autor Cointelegraph by Nancy Lubale

Ethereum traders warn of a ‘nasty’ ETH price drop if $2K support breaks

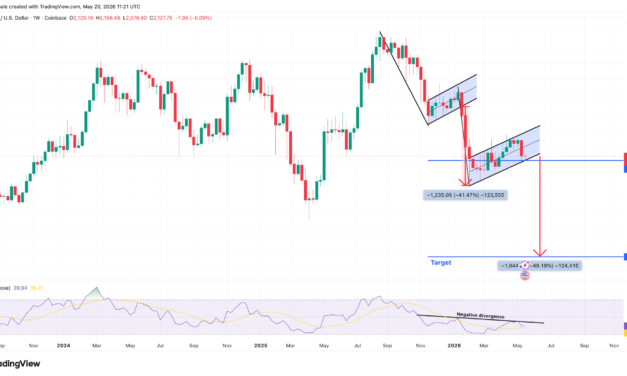
Market analysts say Ether’s (ETH) price may drop to $1,000 if a breakdown from a bearish chart pattern is confirmed.Key takeaways:Ether’s bear flag targets 50% ETH price drop to $1,075. Ether risks over $1.70 billion in long liquidations if the price breaks below $2,000.Whale accumulation weakens as major ETH holders reduce exposure.Ether’s bear flag targets $1,000 ETH priceEther’s downtrend could accelerate if the price breaks below the lower trend line of a bear flag at $2,000 on the daily chart, where a similar breakdown in January led to a 41.5% ETH price drop.Related: Ether taker volume turns negative for first time in two months: Will ETH fall under $2K next?A bear flag pattern is a bearish continuation setup that forms after the price consolidates inside an up-sloping channel following a sharp price drop.The measured target of the flag, derived from the previous downtrend’s height added to the breakdown point at $2,000, is $1,075, down 49% from the current price.ETH/USD weekly chart. Source: Cointelegraph/TradingView“$ETH is about to break the bear flag pattern,” analyst Coin Signals said in a Monday post on X, adding that if the price fails to hold above the lower trend line at 2,000, a “sell-off to $1800 or a new low” would follow.Fellow analyst Keith Alan told his followers to be “prepared for the nasty scenario,” involving the confirmation of a death cross between the 21-day simple moving average (SMA) and 50-day SMA, and validation of a bear flag in the daily time frame.“Momentum indicators also show deterioration on both daily and weekly RSI timeframes,” the analyst said in a recent article on X.“Failure to establish support, however, opens the door to a sequence of progressively lower technical support levels” toward the measured target of the bear flag structure around $1,300, he added.ETH/USD daily chart. Source: X/Keith AlanFellow analyst Crypto Patel said that ETH’s validation of a rising wedge pattern was underway, with a downside target of $1,500.“Ethereum has lost a key rising trendline. As long as the price stays below it, weakness can continue.”ETH/USD daily chart. Source: X/Crypto PatelMeanwhile, Ethereum’s liquidation map shows that a correction below $2,000 would trigger over $1.70 billion worth of leveraged long ETH liquidations across all exchanges, according to CoinGlass data.ETH exchange liquidation map. Source: CoinGlassEthereum whale accumulation dropsEther’s latest rebound to $2,400 did not trigger broad-based accumulation across major wallet cohorts, Glassnode data showed.For instance, the number of mega-whale wallets holding more than 10,000 ETH has declined sharply to a 10-month low of 1,050, with the 30-day change dropping to as low as -70, levels last seen in early February.Ethereum mega-whale address count balance ( >10K ETH). Source: GlassnodeIn other words, large players are taking advantage of recent liquidity to de-risk, reflecting a lack of mid-term confidence.The picture looks similar among smaller wallet cohorts.Ethereum wallets holding 1,000 to 10,000 ETH have also been declining, falling to a nine-month low of 4,750 on May 8. The 30-day change remains negative, hovering around -50 at the time of writing.Ethereum whale and shark address count balance. Source: GlassnodeTaken together, the data suggest ongoing distribution and weak conviction across key ETH holder cohorts, reinforcing the risk of a deeper drop if $2,000 breaks.This reduction in whale counts aligns with the recent inflows into exchanges, indicating the path of least resistance remains down in the immediate future and selling pressure mounts.

Čítaj viac
Bitcoin’s ‘momentum is fading’: Traders have these support levels in mind

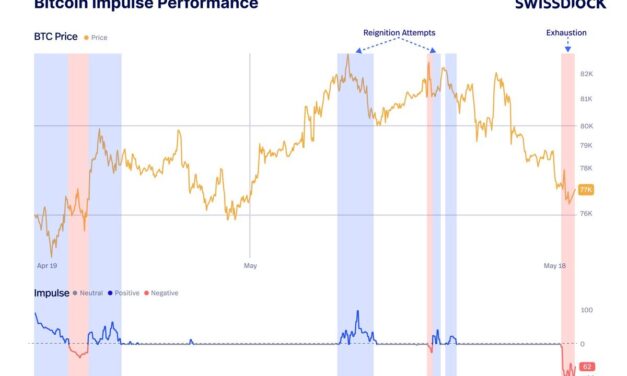
Market analysts say Bitcoin (BTC) is showing “momentum exhaustion” after its 8% drop from multi-month highs above $82,000, with bulls expected to defend key crucial support levels. Key takeaways:Bitcoin momentum weakens after rejection above the $82,000 level.Analysts warn BTC could fall to $65,000 if support at $74,000-$76,000 fails.Bitcoin’s price momentum is “weakening”Private wealth manager Swissblock stated that Bitcoin’s momentum is fading following failure to “sustain expansion” above $82,000. Swissblock said that Bitcoin’s positive momentum has been losing “force with every bounce,” contributing to the latest drop to $76,000. Related: Bitcoin price stays under $77K as US bond yields near 20-year highsBitcoin is now trading at $77,200, with the true market mean and the short-term holder cost basis around $78,000 now acting as immediate resistance.“Bitcoin is losing its capacity to regenerate strong positive momentum internally,” the wealth manager said, adding:”Momentum exhaustion is not the breakdown itself. It is the process that usually comes before it.”Bitcoin performance impulse. Source: SwissblockEchoing this observation, analyst Axel Adler Jr pointed out that Bitcoin’s slow impulse performance indicator has “turned negative for the first time since April,” adding:“Momentum is fading exactly as macro pressure is rising. Without Slow back above zero, every rally is unconfirmed.”Bitcoin impulse performance. Source: CryptoQuantBitcoin’s price momentum indicator has also decreased significantly, falling by 29% over the last week to 47.1 from 66.7, indicating a “shift from strong upward to weakening momentum,” Glassnode said in its latest Market Pulse report, adding:“Bitcoin’s market structure is beginning to soften as momentum, spot demand, and speculative positioning weaken across the market.”Bitcoin price momentum. Source: GlassnodeKey Bitcoin support levels to watchAs Cointelegraph reported, Bitcoin’s upside hinges on bulls keeping the price above the $74,000-$75,000 zone, as it has repeatedly served as key support over the last two years. This is where the key moving averages are found, including the 50-day exponential moving average (EMA), the 100-day 100-day EMA and the 50-day simple moving average (SMA), as shown in the chart below.This reinforces the importance of this demand zone and the fact that BTC/USD has not yet dipped below, “may be the most bullish thing” for Bitcoin, trading resource Material Indicators said in a recent X post.BTC/USD daily chart. Source: Cointelegraph/TradingViewThe second area of interest lies between $72,000 (100-day SMA) and the psychological level at $70,000. If this level is lost, BTC price could drop to $65,000 or later revisit the macro low below $60,000, reached on Feb. 6.Analyst Daan Crypto Trades Bitcoin said that if the support at $75,000-$76,000 is lost, the BTC/USD pair would retest the $72,000 “level pretty quickly.”BTC/USD daily chart. Source: X/Daan Crypto TradesZooming out, trader CryptoAmsterdam said it would be “good” if the BTC/USD pair held support at $74,000-$76,000 (the orange area on the three-day chart below) with other areas of defense around $72,000. The analyst sets downside targets at $60,000 and $50,000 in case these support levels are breached. BTC/USD three-day chart. Source: X/CryptoAmsterdamAs Cointelegraph reported, a key support level for the bulls was the 50-day SMA at $75,600, which, if lost, could see the BTC/USDT pair sink to $65,000.

Čítaj viac

XRP price risks 50% drop despite 9-day ETF inflow streak

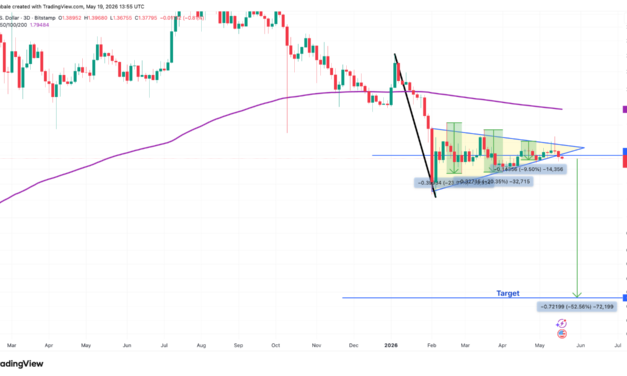
XRP (XRP) has fallen 12% over the last five days, and the confirmation of a bearish pattern now points to the risk of more losses ahead.Key takeaways:XRP/USD’s bear pennant pattern on the three-day chart points to a possible 52.5% drop toward $0.65.Persistent institutional demand through exchange-traded products supports the case for a recovery in XRP price. XRP’s descending triangle breakdown is underwaySince early February, the XRP/USD pair has been consolidating inside a bear pennant on the three-day chart.In technical analysis, bear pennants are typically viewed as bearish continuation patterns. The pattern was confirmed when the price produced broke below the pennant’s lower trend line at $1.40, as shown in the chart below.Related: JPMorgan lifts Bitcoin ETF exposure in Q1, led by BlackRock’s IBITThe downside target is derived by taking the height of the initial drop (the pennant’s post) and placing it lower from the point where the price breaks below the pattern’s lower trend line.XRP/USD three-day chart. Source: Cointelegraph/TradingView,XRP’s measured downside target comes in near $0.65, about 52.5% below current levels.XRP’s Stoch RSI on the weekly chart “has confirmed a deathcross, marking the third time this signal has flashed since the July‑2025 ATH,” technical analyst ChartNerd said in a recent post on X.The previous two crosses produced deeper corrections of about 50%, and the one in January came after a “relief rally into a weekly 20/50 EMA death cross,” the analyst said, adding:“A failure at the weekly 20 (just retested) or the weekly 50 ($1.80) will likely open the next leg down later in the year.”XRP/USD weekly chart. Source: X/ChartNerdThe daily RSI has dropped to 42 from 63 over the last seven days, suggesting increasing bearish momentum. As Cointelegraph reported, buyers are expected to aggressively defend the $1.27 as a close below it may sink the XRP/USDT pair to $1.11 and later to the psychological level at $1. XRP price shuns ETF demandThe five-day price correction comes even as institutional sentiment remains relatively positive, as reflected in steady inflows into US-based XRP spot ETFs.According to data from SoSoValue, XRP ETFs added $750,000 on Monday. This marked nine consecutive days of net inflows, totaling $95.5 million. This streak has pushed cumulative inflows to nearly $1.4 billion and assets under management (AUM) to $1.14 billion.Spot XRP ETF flows chart. Source: SoSoValueGlobal XRP investment products also registered weekly inflows of approximately $67.6 million during the week ending May 15, outperforming Bitcoin (BTC) and Ether (ETH), which saw $981.5 million and $250 million in outflows, respectively.Global crypto ETP flows table. Source: CoinSharesThis indicates institutional appetite for XRP products is “heating up, signalling growing confidence in regulated crypto exposure,” TronWeekly said in a post on Tuesday.As Cointelegraph reported, stronger technical validation, passage of the CLARITY Act in the US and recovering network activity could also contribute to XRP’s recovery. 

Čítaj viac

Recent Bitcoin holders sell $770M BTC at a loss amid $65K BTC price calls

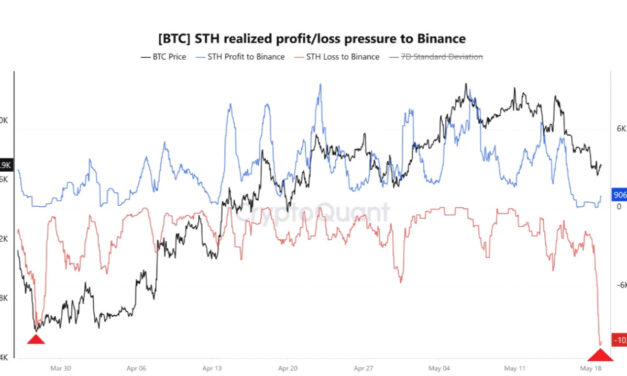
Bitcoin (BTC) price dropped to $76,500 on Monday, erasing nearly all of this month’s gains as fresh US-Iran war tensions soured the crypto market sentiment. This has led investors and traders to reevaluate their risks and stay cautious, with many recent buyers selling their BTC at a loss.Key takeaways:Bitcoin short-term holders sold over 10,000 BTC worth approximately $770 million at a loss on Monday.Analysts agree that pushing Bitcoin’s price below $76,000 could trigger a fresh downtrend toward $65,000-$70,000.Bitcoin’s “weak hands” realizing lossesBitcoin has retraced 7% from its local high of $82,800 set on May 6. The rejection from the 200-day moving averages at $82,000, the daily close below the true market mean, and the short-term holder cost basis around $78,000 have cemented a more risk-off stance among Bitcoin investors.Related: Bitcoin’s trend-defining battle starts at $74K support: AnalystOnchain data from CryptoQuant showed that more than 10,000 BTC were transferred by short-term holders — investors who have held the asset for less than 155 days — to Binance at a loss on Monday.These moves occurred with Bitcoin at roughly $76,900, about 2% below their average purchase price of $78,440, suggesting that recent buyers sent approximately $769 million in BTC to Binance at a loss.This “reflects short-term holder stress, forced selling, or capitulation from weaker hands during a correction,” CryptoQuant analyst Amr Tah said in a QuickTake post on Tuesday.Bitcoin: Transfer volume by STH in loss to Binance. Source: CryptoQuantThis activity underscores a familiar pattern of short-term speculators panic-selling during market dips, frequently realizing losses.A similar occurrence in mid-November 2025 preceded a 15% BTC price decline to $78,400 from $96,000 in less than five days.Additional data from Glassnode shows that more than “7.8M BTC are currently held at a loss,” a supply overhang that the market would need to “absorb before any sustained move higher becomes structurally credible.”BTC total supply in loss. Source: GlassnodeAlso accompanying Bitcoin’s slump are heavy outflows from US-based spot Bitcoin exchange-traded funds (ETFs), which have recorded negative flows for six out of the last eight days.These investment products saw $648.6 million in net outflows on Monday, the largest withdrawal since Jan. 29.Spot Bitcoin ETF flows table. Source: Farside Investors Global Bitcoin investment products also recorded $981.5 million in net outflows during the week ending May 15, suggesting declining institutional appetite for BTC.“Markets are getting absolutely hammered,” analyst Alek_Carter said in an X post on Tuesday, referring to the large outflows from Bitcoin investment products, adding:“Money is rotating out fast, panic is creeping in, and traders are clearly hitting the risk-off button hard.”As Cointelegraph reported, record-low retail investor activity, aggressive selling in the futures markets and weakening spot demand are pulling down Bitcoin’s price to new May lows. How low can Bitcoin price go?The Bitcoin HODL Waves indicator, which tracks the age distribution of BTC holdings, suggests Bitcoin could bottom at $65,500-$70,500 if current market weakness continues. Historically, spikes in long-term holder activity and declining short-term speculation have coincided with major market bottoms before recoveries.The chart below shows a stronger long-term holder base (the blue/purple bands are noticeably thicker), “reflecting growing institutional adoption,” CryptoQuant analyst Sunny Mom said in a Quicktake analysis on Tuesday. This suggests that the supply structure is structurally stronger in the current cycle than before, “which changes how BTC forms its bottom,” the analyst said, adding:“Our predicted price range for this cycle’s bottom is $65.9K–$70.5K. If $70.5K holds, we’ll slowly grind out a bottom in the upper range.”Bitcoin HODL wave indicator. Source: CryptoQuant From a technical perspective, Bitcoin is printing the fifth consecutive daily red candle, suggesting that the “momentum is starting to shift back to the bears,” analyst Alex Marzell said on Monday in a post on X, adding:“Bitcoin may come back to retest the breakout zone around $70K support.”Echoing this sentiment, MN Capital founder Michael van de Poppe said this “doesn’t look great” for Bitcoin, adding that the price needs to hold support at $74,500-$76,000 “in order to get back some momentum in the markets.”“If this area doesn’t hold, then we’re most likely cascading through the lows of the recent rally and test

Čítaj viac

Ethereum traders say bears ‘in control’ after ETH price drop to $2K

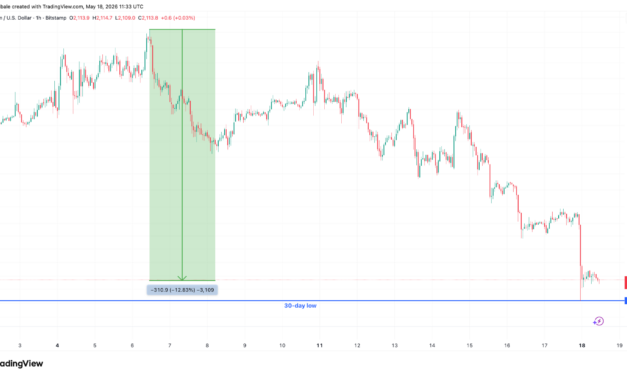
Ether (ETH) dropped sharply after rejection at $2,400 last week, dropping as low as $2,100 on Monday, indicating that bears are back “in control,” according to new analysis.Key takeaways:Ether drops 12% after rejection at $2,400 as bears regain control.Binance sell pressure and ETF outflows signal weak ETH demand.Analysts warn ETH/USD could fall toward $1,700 if support at $2,000 breaks.ETH bears selling aggressivelyData from TradingView shows ETH price trading at $2,100, down 12% below its local high of $2,420 reached on May 6. On Sunday, ETH/USD hit $2,090 on Bitstamp, its lowest level since April 17.ETH/USD one-hour chart. Source: Cointelegraph/TradingViewThe bearish sentiment could be returning to Ether’s market as a key metric from Binance, the largest crypto exchange by trading volume, shows that sellers are starting to dominate the platform’s volumes.Related: Surging oil prices have been driving Ether selling pressure: Tom LeeThe Binance taker buy volume, which measures the total dollar amount of aggressive sell orders placed by traders on Binance futures, climbed above $1.1 billion within an hour on Sunday as ETH moved toward levels below $2,100. When this metric spikes during price declines, it often points to forced de-risking or strong short-term bearish pressure from active market participants.Ether saw “large aggressive sell-volume spikes on Binance while testing important downside levels,” CryptoQuant analyst Amr Taha said in a QuickTake note on Monday, adding:“This does not necessarily confirm the start of a deeper downtrend. However, it shows that sellers were clearly in control during the move.”ETH taker sell volume on Binance. Source: CryptoQuantIncreasing outflows from ETH investment products added to the sell-side pressure.Data from SoSoValue shows US-based spot Ethereum ETFs had net outflows for five consecutive days, totalling $255 million. This suggests that “institutional momentum has hit a localized wall for Ethereum,” analyst Whale Factor said in a Sunday post, adding:“This heavy sell-side distribution is keeping a tight lid on prices for now. ”Spot ETH ETF flows chart. Source: SoSoValueGlobal Ethereum investment products also saw $249 million in outflows during the week ending May 15, the largest since Jan. 30, data from CoinShares shows.  3.5 million ETH cluster at $2,000 could abate a sell-offAccording to Ether’s cost-basis distribution data, investors hold approximately 3.85 million ETH at an average cost basis of $2,000-$2,100, creating a potential support zone. This concentration suggests many investors may add to their positions at break-even, potentially abating another ETH price breakdown.Ethereum cost basis distribution chart. Source: GlassnodeAs Cointelegraph reported, the ETH price could potentially drop toward $1,700 after validating a rising wedge pattern on the daily time frame. Traders, however, say the bearish momentum could be stalled if ETH/USD holds above $2,000.“$ETH dropped below $2,100 as it failed to hold the $2,150 support zone,” said crypto analyst Ted Pillows in an X post on Tuesday, adding:“The next key support for Ethereum is the $2,050-$2,070 level, which could provide some bounce back.”ETH/USD daily chart. Source: X/Ted PillowsTechnical analyst Donald Dean said ETH bulls need to defend the “lower volume shelf support near $2,100” to avoid a move below a rising channel on the daily chart.ETH/USD daily chart. Source: X/Donald DeanFellow analyst Cryptorphic said if the ETH/USD pair fails to “hold this area and consolidates below it, we could see a continuation toward lower support levels,” adding:“The recent breakdown below the local support area shows that buyers are getting weaker in the short term.”Meanwhile, Sharplink CEO pointed out three catalysts that the ETH price needs to surge higher, including the passage of the CLARITY Act in the US, a return of marketwide risk appetite, and growth in real-world asset tokenization on Ethereum.

Čítaj viac

Získaj BONUS 8 € v Bitcoinoch

nakup bitcoin z karty

Registrácia Binance

Burza Binance

Aktuálne kurzy