Autor Cointelegraph by Nancy Lubale

XRP drops to 16-week lows: Can price fall below $1?

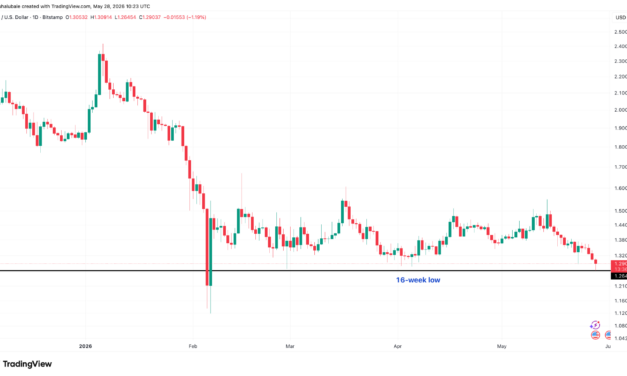
XRP (XRP) price dropped to $1.26 on Thursday, its lowest in over 16 weeks. A bearish technical setup suggested that the pressure may extend into June.XRP/USD daily chart. Source: Cointelegraph/TradingViewKey takeaways:XRP’s bear pennant pattern breakdown on the weekly chart targets $0.63.XRP social sentiment hit a three-week low, while Net Unrealized Profit/Loss data shows rising fear and investors underwater.XRP price bear pennant breakdown underwayXRP has been displaying several bottoming signals, including a falling MVRV ratio and rising XRP Ledger activity, which suggested that the price was extremely undervalued within the $1.40-$1.50 zone.The latest drop, however, has seen the XRP/USD pair drop below this zone to enter the breakdown phase of its bear pennant setup, as shown on the weekly chart below.Related: XRP adds 4,300 new wallets in 24 hours, but why is price stuck?XRP has dropped below the pennant’s lower trendline at $1.35, opening the way for a deeper move toward the measured target of the prevailing chart pattern at $0.63, a 50% drop from the current price.XRP/USD weekly chart. Source: Cointelegraph/TradingViewXRP became “structurally bearish” with the latest breakdown below $1.30, analyst Egrag Crypto said in a Thursday post on X, adding:“The bearish targets are $1.27, $1.1 and a possible capitulation wick toward $0.88.”XRP daily chart. Source: Egrag CryptoTechnical analyst ChartNerd said that after breaching the support line at $1.30, the path is now clear for a drop toward $1 “sooner rather than later.”XRP/USD daily chart. Source: X/ChartNerdAs Cointelegraph reported, XRP’s next major support level now lies at $1.27. If this level is lost, the XRP/USDT pair may plunge to $1.11 and then test $1 support.XRP sentiment turns negativeXRP’s sentiment on social media has turned sharply negative over the last few days, according to data from Santiment.Santiment’s Positive/Negative sentiment indicator, which measures the ratio of positive to negative social media mentions for a cryptoasset, shows XRP crowd FUD is at its highest level in three weeks.The ratio of positive to negative commentary has dropped to “just 1.1 bullish comments for every 1 bearish comment,” the market intelligence data provider said in a recent post on X.Santiment, however, pointed out that this kind of fear and skepticism has historically acted as a “contrarian signal for XRP’s price,” adding:“When traders across social media become overly fearful, many weak hands have already sold, reducing selling pressure and creating conditions for a rebound.” XRP’s Positive/Negative sentiment metric. source: SantimentThe chart above shows that previous dips into the “FUD zone” were followed by price stabilization or bounces shortly afterward.However, XRP’s Net Unrealized Profit/Loss (NUPL) is still oscillating between the capitulation and fear zones, suggesting that traders are still showing signs of fear.XRP’s NUPL vs. price performance chart. Source: GlassnodeWith more than 58% of XRP holders underwater at current prices, there is still room for more losses, based on past cycles. Such setups in 2018 and 2021 preceded sharp corrections, raising the possibility of similar pullbacks over the next few weeks.

Čítaj viac
Crypto liquidations hit $935M as Bitcoin price dips to $72.6K

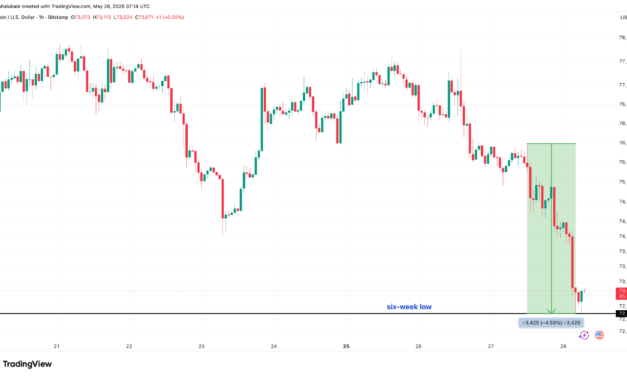
Bitcoin (BTC) sold off into the early Asian Trading session on Thursday as the drop to $72,600 produced significant liquidation of leveraged positions across the crypto market.Key takeaways:Bitcoin price deviated 4.5% from its daily high of $76,050 on Wednesday, dropping to a six-week low of $72,620.Overleveraged crypto traders were liquidated out of nearly $935 billion in the past 24 hours.Traders say Bitcoin needs to hold above $70,000 to avoid a deeper correction toward $65,000 or lower. Bitcoin price hits a 6-week lows below $73,000The BTC/USD pair fell as low as $72,620 on Thursday, reversing all gains made since April 13 after the US reportedly carried out a new wave of military strikes on Iran. BTC/USD 1-hour chart. Source: Cointelegraph/TradingViewThis was accompanied by significant drops in other top-cap cryptocurrencies, wiping out more than $80 billion from the crypto market over the last 24 hours. Related: Bitcoin falls further as BTC miners pivot to AI, pro-crypto legislation stallsThe derivatives market suffered a similar fate. More than $874 million in long positions were liquidated, with Bitcoin accounting for $348.5 million of that total. Ether (ETH) followed with $228.5 million in long liquidations.Across the board, a total of $935.6 million was wiped out of the market in short and long positions, as shown in the figure below.Crypto liquidations (screenshot). Source: CoinGlassThe single biggest liquidation occurred on Hyperliquid, where a $15.34 million BTC-USD long position was closed.Additional data from CoinGlass showed a slight drop in Bitcoin’s futures open interest (OI) over the last 24 hours across all exchanges. The decline was more pronounced on the Chicago Mercantile Exchange and BingX, whose Bitcoin OI has fallen by 9.8% and 9% over the last 24 hours, respectively. Even though futures longs (buyers) and shorts (sellers) are always matched, declining OI suggests reduced leverage and market participation, often signaling bearish sentiment. For example, a 30% decrease in OI between Jan. 14 and Feb. 6 was accompanied by a 38% drop in BTC price.Meanwhile, US-based spot exchange-traded funds (ETFs) continue to post heavy outflows, indicating waning institutional interest. These ETFs have recorded outflows for eight consecutive days, totaling $2.6 billion. The $733 million in net outflows recorded on Wednesday marked the largest withdrawal since Jan. 29.Spot Bitcoin ETF flows chart. Source: SoSoValueAs Cointelegraph reported, global Bitcoin investment products also posted outflows totaling $1.3 billion last week, adding to BTC’s headwinds.$70,000 is now Bitcoin’s last line of defenceBitcoin’s 4% drop over the last 24 hours has seen it lose the crucial $75,000 support, as the bears gained momentum. Traders are now watching key support areas on the downside, including the 100-day simple moving average (SMA) at $73,000 and the demand zone above $70,000.“Renewed US-Iran fighting overnight sent us lower with mass liquidations,” analyst Nicrypto said in a Thursday X post, adding:“We have fallen well below the previous $75K support zone & are now at the critical $73K support.”MN Capital founder Michael van de Poppe referred to Bitcoin’s latest sell-off as a “standard approach” typical of the final days of the month, “where markets correct as rebalancing takes place among asset managers.”The analyst said, “Bitcoin showing weakness isn’t a recipe for a new low,” unless it drops under the $71,400-$73,400 support area as shown in the chart below.“This is my last stance of an important support zone; otherwise, I’d expect lower $60Ks to be tested for support.”BTC/USD daily chart. Source: Michael van de PoppeA daily candlestick drop below $70,000 could trigger another sell-off episode toward the target of an inverted V-shaped pattern at $65,000, as shown on the daily chart below. This would represent an 11.4% drop from the current price.BTC/USD 1-day chart. Source: Cointelegraph/TradingViewAs Cointelegraph reported, after losing support at $74,000-$76,000, BTC may then descend to the support line near $70,500, which is likely to attract buyers.

Čítaj viac

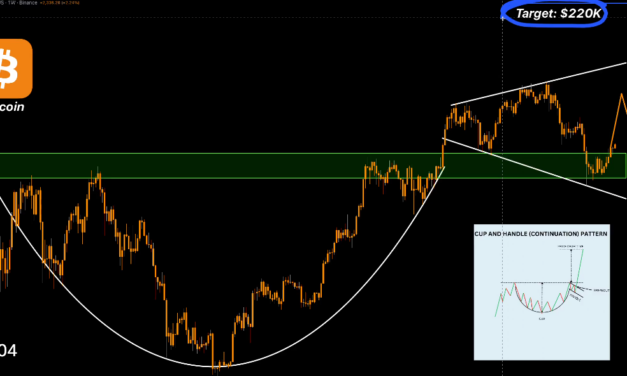
Bitcoin’s big cup-and-handle pattern targets ‘minimum’ $220K BTC price

Bitcoin (BTC) is up roughly 30% from its Feb. 6 low below $60,000 as a multi-year bullish chart pattern suggests BTC price could rise to as high as $220,000 in the coming months.Key takeaways:Bitcoin’s cup-and-handle pattern puts BTC’s minimum target at $220,000, but $74,000 must hold.Bitcoin spot volume has collapsed 81% since October 2025, a precursor to the end of every bear market.Bitcoin’s cup-and-handle pattern targets $220,000 and aboveBitcoin price has formed a cup-and-handle (C&H) pattern on the weekly chart, suggesting that a massive upward move is still in the cards for BTC.A cup-and-handle is a bullish continuation pattern where a rounded price recovery forms the “cup,” followed by a short consolidation inside a “handle” before a breakout.It is resolved after a breakout above the handle’s resistance line, typically signalling a strong upward move, with the price target equal to the cup’s depth added to the breakout level.“Bitcoin has just completed a multi-year cup-and-handle pattern,” technical analyst Crypto Tice said in a Monday post on X.The analyst explained that C&H breakouts don’t result in small price movements, adding that “they move hundreds of percent.”Bitcoin price has retested the cup’s $65,000-$74,000 neckline, which must be held to complete the breakout.“The retest just finished. The launch is next,” the analyst said, adding:“$220K is the minimum target.”BTC/USD weekly chart. Source: X/Crypto TiceData from TradingView shows the measured target of the C&H pattern is $295,000, roughly 280% above the current price.BTC/USD weekly chart. Source: Cointelegraph/TradingViewEarlier, Cointelegraph reported that Bitcoin’s Decay Channel—a logarithmic price model—suggested that BTC could rally as high as $255,000 by year-end, with its 2027 target extending to $308,000.Trader VeLLa Crypto says the BTC/USD pair “must hold” the $74,000 support area first, to boost its bullish outlook. BTC/USD daily chart. Source: X/VeLLa CryptoAs Cointelegraph reported, a break below $74,000 would suggest the bears are back in control, invalidating the medium-term bullish outlook for Bitcoin. Bitcoin spot volume collapses 81% on BinanceBitcoin’s spot volume has now fallen to levels typically seen during bear markets, data from CryptoQuant shows. The chart below shows that the trading volume on Binance has dropped to $36.4 billion, 81% below the $198.6 billion recorded in October 2025. Gate.io has also seen a massive 79.6% drop in volumes, while Bybit is down 66%.“This development primarily reflects a macro environment that has been unfavorable for risk assets, CryptoQuant analyst Darkfost said in a Tuesday QuickTake post.The decline in trading activity can also be “interpreted constructively” as it suggests that the” selling pressure behind the current retracement is gradually losing momentum.”Darkfost added:“It was precisely after spot volumes collapsed that the 2023 bear market came to an end, followed by the return of volatility and the recovery of the bullish trend.”Bitcoin spot trading volume. Source: CryptoQuantAs Cointelegraph also reported, heavy outflows from spot Bitcoin ETFs have been correlated with great buying opportunities for BTC. 

Čítaj viac

Ethereum price chart targets $1.8K as total value locked hits 13-month lows

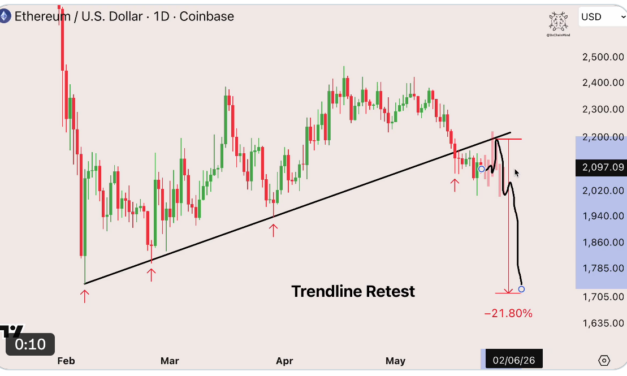
Ether’s (ETH) price printed a “bear pennant” on the daily chart, a technical chart formation associated with strong downward momentum. Could a weakening technical setup and a decline in total value locked signal the continuation of ETH’s correction to $1,800?Key takeaways:Ether is forming a bear pennant on the daily chart, with a potential breakdown to $1,800.ETH price may see further losses if Ethereum’s total value locked continues to shrink.Ether bears eye ETH price “dump” to $1,800Ether’s 13% drop from its multi-month highs above $2,400 saw it breach a key trend line that has supported the price since early February.“ETH is going to dump hard soon?” Chain Mind said in a video posted on X, suggesting where ETH/USD might move next after dropping below the ascending trend line.“This is the crucial moment for ETH,” Chain Mind said, adding that the price was required to reclaim the support level, otherwise a drop to areas below $1,800 was in the cards.  ETH daily chart. Source: X/Chain MindMeanwhile, ETH’s price has formed a bear pennant chart pattern on the daily chart, as shown below.  A bear pennant pattern is a bearish setup that forms after the price consolidates inside two converging lines following a sharp price drop.ETH/USD daily chart. Source: Cointelegraph/TradingViewThe pennant will resolve once the price breaks below the lower trend line at $2,060, opening the way for a drop equal to the previous uptrend’s height. This puts the lower target for ETH/USD at $1,800, down 14% from the current price.Crypto analyst Alex Marzell said that if Ether’s price dropped below $2,050, it would increase the chances of a move toward the next support zone at $1,800.Source: Alex MarzellAs Cointelegraph reported, Ether’s downtrend is likely to continue toward $1,750 in the short term if key support levels do not hold.Ethereum’s total value locked crashes 55%Ether’s bearish technical outlook overlaps with several other headwinds, such as recent Ethereum Foundation departures, weakening social media sentiment, and declining total value locked (TVL) across its DeFi protocols.Ethereum’s TVL has now fallen to $116 billion, levels last seen in April 2025. For comparison, the network’s TVL hit an all-time high of $258 billion on Aug. 14, 2025. The TVL has therefore more than halved, representing a 55% decline. Ethereum total value locked. Source: DefiLlamaNegative TVL growth is more pronounced in Ethereum’s layer-2 (L2) network, led by Ether.fi whose total value locked is down 32% over the last 30 days. “There is a sustained TVL decline” across Ethereum’s L2 sector, CryptoRank said in its Telegram note on Monday.The sharpest corrections are seen in Arbitrum (-63%), zkSync (-64%), and Linea (-98%), “pointing to high liquidity sensitivity to incentive programs and short-term reward mechanics,” the crypto analytics platform said, adding:“This reinforces the broader picture of capital fragmentation in Ethereum’s rollup ecosystem and undermines the ‘unified liquidity pool’ effect that early L2 development models envisioned.”Layer-2 networks: TVL decline since October 2025. Source: CryptoRankDeclining TVL signals weakening onchain demand, adding downside pressure on ETH and increasing the risk of further price declines in the near term.

Čítaj viac

XRP price in ‘value zone’ near $1.40 as whales pull $170M from exchanges

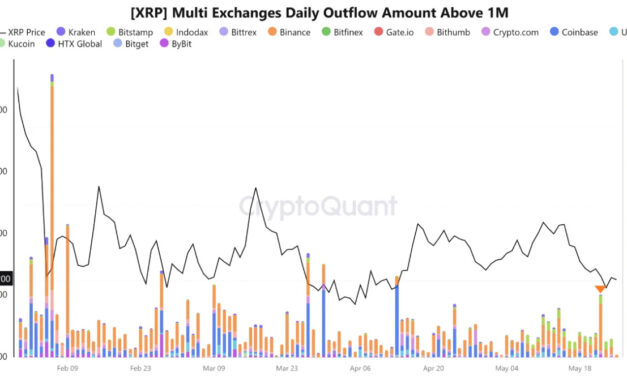
XRP (XRP) traded within a key “value zone” where whales recently accumulated $170 million, signaling a tightening liquidity supply.Key takeaways:XRP whales withdrew 122 million XRP, worth $170.8 million, from Binance, while price is near the key $1.35-$1.40 support.Exchange outflows and steady spot XRP ETF inflows point to a tightening supply and growing demand for XRP.XRP price could target $2.33 if bulls break above $1.50 resistance, with Bollinger Bands hinting at a big move ahead.122 million XRP withdrawn from Binance exchangeXRP whale withdrawals, large exits above 1 million coins per transaction, hit 122 million on Binance on May 22, worth about $170.8 million at current rates, according to data from CryptoQuant. This marked their first daily withdrawal above 1oo million XRP since the 278 million XRP seen in early February. “What makes the latest move more important is the price context,” CryptoQuant analyst Amr Taha said in a Monday QuickTake post.Note that the Feb. 9 withdrawal spike happened while XRP was trading near $1.43, while the May 22 spike came with XRP around $1.35. “This makes the $1.35–$1.40 range an important zone to watch for XRP,” the analyst said in another QuickTake post, adding: “Repeated withdrawals near the same price range may indicate that some larger players view this area as a value zone.”XRP: Whale outflows from exchanges. Source: CryptoQuantSuch outflows typically indicate accumulation by large holders, who move tokens to self-custody or increase exposure to XRP investment products, thereby reducing immediate sell-side pressure.Meanwhile, inflows for US-based spot XRP ETFs continue with these investment products recording positive flows for 16 consecutive days, totalling $116.75 million.Spot ETH ETFs flows chart. Source: SoSoValueXRP price must hold $1.30 as supportThe XRP/USD pair has been trading in a tight range between $1.30 and $1.50 since early February. XRP’s bullishness now hinges on holding $1.30 as support if it “stands another chance at retesting $1.50 resistance,” analyst ChartNerd said in a recent post on X. “$1.30 is a current guardrail,” the analyst said, adding:“If lost, a deeper drop to the lower $1 territory is likely in the coming weeks.”XRP/USD daily chart. Source: X/ChartNerdXRP trades within a multi-year range from May 2022 to November 2024. Eventually, a break above the upper limit of this range at $0.68 preceded a 400% rally to $3.40 in January 2025.If the XRP/USD pair holds within its current range, a similar upward move could be seen once a decisive move supported by strong volume above the upper limit at $1.50 is achieved.XRP/USD three-day chart. Source: Cointelegraph/TradingViewMeanwhile, the Bollinger Bands are still at their tightest level since mid-2024. Similar occurrences have previously led to gains of 58%-82% in XRP price, as shown in the chart above. As such, XRP could rise as high as $2.33 if a similar breakout scenario plays out. Analyst Crypto Patel referred to the current range as the “best accumulation zone,” adding that the muted price action resembles the calm before its major breakout in late 2024.The analyst’s upside target is $10, implying a roughly 7x potential from the lower end of the accumulation range if XRP repeats its 2022–2024 cycle-style expansion.XRP/USD two-week chart. Source: X/Crypto PatelAs Cointelegraph reported, overhead resistance at $1.40-$1.50 is likely to keep the price in check unless the bulls muster the strength to overcome it over the next few weeks. 

Čítaj viac

Získaj BONUS 8 € v Bitcoinoch

nakup bitcoin z karty

Registrácia Binance

Burza Binance

Aktuálne kurzy