
Autor Cointelegraph by Nancy Lubale

Bitcoin price rally 'in progress' but upside could be capped at $84K

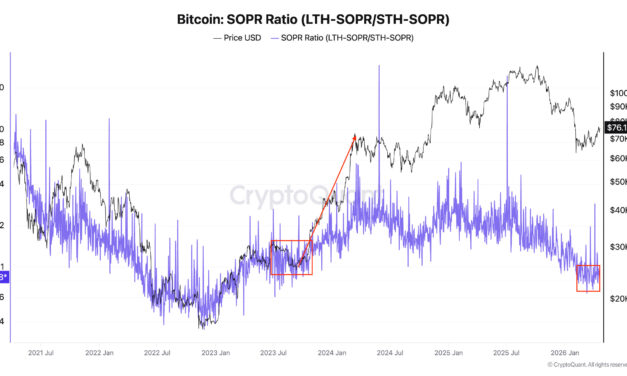
Market analysts said Bitcoin’s (BTC) latest rally to $78,000 means that the “uptrend has began,” but the upside could be capped at $84,000, based on several key metrics.Key takeaways:Bitcoin profitability suggests BTC rally “has begun” Bitcoin’s recent price recovery toward $76,000 has pushed it more than 26% above its sub-$60,000 multi-year low reached on Feb. 6.This was accompanied by an increase in the Spent Output Profit Ratio (SOPR), which hit an eight-month high of 2.87, after dropping as low as 0.62 in early February.Related: Bitcoin risks losing $70K as Strategy’s STRC slips below $100SOPR is a metric used to show whether Bitcoin investors have made a profit or loss compared to when they first held Bitcoin. This ratio has historically marked the short-term bottom for BTC when it hits its lowest point.“The $BTC SOPR Ratio shows that $BTC has already broken out of the bottom and is rising,” CryptoQuant analyst CW8900 said in a Tuesday post on X, adding:“The bottom for $BTC was formed last February. The rally is already in progress.”Bitcoin SOPR. Source: CryptoQuantSimilarly, Bitcoin’s Net Unrealized Profit/Loss (NUPL), the difference between total profits and losses currently held by investors, has flipped positive for the first time since early January.This suggests that the downtrend for Bitcoin has ended, and the “real rally of this cycle has begun,” CW8900 said in another X post.Bitcoin NUPL. Source: CryptoQuantThis structurally resembles conditions seen in early stages of previous bull markets, where the NUPL recovered from extended periods below zero as Bitcoin embarked on a sustained rally.1.1 million BTC at $84,000 could trigger sell-offAccording to Bitcoin’s cost basis distribution data, investors hold approximately 1.1 million BTC at an average cost of $84,000, creating a potential resistance zone. This concentration suggests many investors may sell at break-even, potentially stalling Bitcoin’s upward momentum.Bitcoin cost basis distribution chart. Source: GlassnodeAs Cointelegraph reported, Bitcoin’s immediate resistance is at $78,000, where the true market mean currently sits.The US spot Bitcoin ETF cost basis at $83,100 is seen as the next key hurdle. BTC: Average cost basis of US spot ETFs. Source: GlassnodeAnalyst AlphaBTC said the BTC/USD pair might rise higher to fill the CME gap at $84,000, which was created at the start of February.BTC/USD four-hour chart. Source: AlphaBTCAs Cointelegraph reported, a close above the $76,000-$78,000 resistance zone would confirm that the buyers are in control, clearing the path for a potential rally to $84,000.

Čítaj viac
Ethereum whale opens $90M long bets as ETH price chart eyes $3.2K

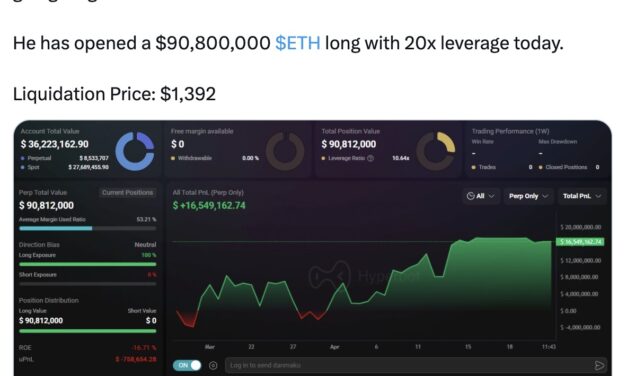
An Ethereum whale has opened a significant long position on Ether (ETH) worth $90.8 million, in what looks like a bold bet that the upside is not over for the top altcoin.Key takeaways:Ethereum whale opened a leveraged long position totaling $90.8 million.Ether price chart’s ascending triangle targets $3,230.Top traders open new ETH long positionsData from TradingView showed the ETH/USD pair trading at $2,280, or 32% higher than the $1,750 low reached on Feb. 6. Holding above $2,200, Ether offered some cause for optimism ahead of key volatility triggers.“Strong retail sales could push yields higher and delay Fed cuts, while weak data would fuel risk-on bets,” analyst AlphaBTC said in a Monday post on X, referring to the main macro drivers this week, adding:“Fed commentary and PMI data add growth signals, while geopolitical risks remain the wildcard catalyst for sudden volatility.”As market participants waited for the next catalysts, attention has shifted to a trader with an impressive track record, who has opened a long position worth about $90.8 million in ETH, with 20x leverage.Source: X/Ash CryptoAnalyst TAnotepad noted that another whale, 0x6C851, has opened a $61 million ETH long position at 20x leverage with entry around $2,303 on HyperLiquid.ETH whale position on HyperLiquid. Source: TAnotepadThese moves coincide with continued flows into spot Ethereum ETFs, which have recorded net inflows for seven consecutive days, totaling $426 million. Spot ETH flows chart. Source: SoSoValueMeanwhile, global Ethereum investment products recorded $328 million in inflows during the week ended last Friday.This reinforces the narrative that whales and institutions view the recent ETH price rebound above $2,400 as a promising move that may open the way toward $3,000.Ether’s ascending triangle targets $3,200 ETH price Ether’s price action has formed a classic ascending triangle on the daily chart, as shown below. The pattern will resolve once the ETH/USD pair breaks above the triangle’s resistance line at $2,400. If this happens, the price could rise by as much as the maximum distance between the triangle’s trend lines.That puts Ether’s breakout target at about $3,230, up by more than 41% from current price levels.ETH/USD daily chart. Source: Cointelegraph/TradingViewThe relative strength index has increased to 54, from oversold conditions at 18 on Feb. 6, suggesting increasing upward momentum.However, the breakout could be curtailed by resistance from the $2,350-$2,500 resistance zone, marked by the 50-day exponential moving average (EMA).Above that, the next major hurdle is the 200-day EMA at $2,640.Zooming out, analyst Micro2Macr0 said that a breakout from a multi-year ascending triangle could lead to a 60%-100% ETH price rally. ETH/USD weekly chart. Source: X/Micro2Macr0 As Cointelegraph reported, ETH price closing above $2,400 resistance, puts it on the path for a recovery toward $2,800, then to $3,050 over the next few days or weeks.

Čítaj viac

Ethereum whale opens $90M long bets as ETH price chart eyes $3.2K

An Ethereum whale has opened a significant long position on Ether (ETH) worth $90.8 million, in what looks like a bold bet that the upside is not over for the top altcoin.Key takeaways:Ethereum whale opened a leveraged long position totaling $90.8 million.Ether price chart’s ascending triangle targets $3,230.Top traders open new ETH long positionsData from TradingView showed the ETH/USD pair trading at $2,280, or 32% higher than the $1,750 low reached on Feb. 6. Holding above $2,200, Ether offered some cause for optimism ahead of key volatility triggers.“Strong retail sales could push yields higher and delay Fed cuts, while weak data would fuel risk-on bets,” analyst AlphaBTC said in a Monday post on X, referring to the main macro drivers this week, adding:“Fed commentary and PMI data add growth signals, while geopolitical risks remain the wildcard catalyst for sudden volatility.”As market participants waited for the next catalysts, attention has shifted to a trader with an impressive track record, who has opened a long position worth about $90.8 million in ETH, with 20x leverage.Source: X/Ash CryptoAnalyst TAnotepad noted that another whale, 0x6C851, has opened a $61 million ETH long position at 20x leverage with entry around $2,303 on HyperLiquid.ETH whale position on HyperLiquid. Source: TAnotepadThese moves coincide with continued flows into spot Ethereum ETFs, which have recorded net inflows for seven consecutive days, totaling $426 million. Spot ETH flows chart. Source: SoSoValueMeanwhile, global Ethereum investment products recorded $328 million in inflows during the week ended last Friday.This reinforces the narrative that whales and institutions view the recent ETH price rebound above $2,400 as a promising move that may open the way toward $3,000.Ether’s ascending triangle targets $3,200 ETH price Ether’s price action has formed a classic ascending triangle on the daily chart, as shown below. The pattern will resolve once the ETH/USD pair breaks above the triangle’s resistance line at $2,400. If this happens, the price could rise by as much as the maximum distance between the triangle’s trend lines.That puts Ether’s breakout target at about $3,230, up by more than 41% from current price levels.ETH/USD daily chart. Source: Cointelegraph/TradingViewThe relative strength index has increased to 54, from oversold conditions at 18 on Feb. 6, suggesting increasing upward momentum.However, the breakout could be curtailed by resistance from the $2,350-$2,500 resistance zone, marked by the 50-day exponential moving average (EMA).Above that, the next major hurdle is the 200-day EMA at $2,640.Zooming out, analyst Micro2Macr0 said that a breakout from a multi-year ascending triangle could lead to a 60%-100% ETH price rally. ETH/USD weekly chart. Source: X/Micro2Macr0 As Cointelegraph reported, ETH price closing above $2,400 resistance, puts it on the path for a recovery toward $2,800, then to $3,050 over the next few days or weeks.

Čítaj viac

Získaj BONUS 8 € v Bitcoinoch

nakup bitcoin z karty

Registrácia Binance

Burza Binance

Aktuálne kurzy

