Autor Cointelegraph by Nancy Lubale

Is Ethereum safe above $2K? Traders are watching these ETH price levels

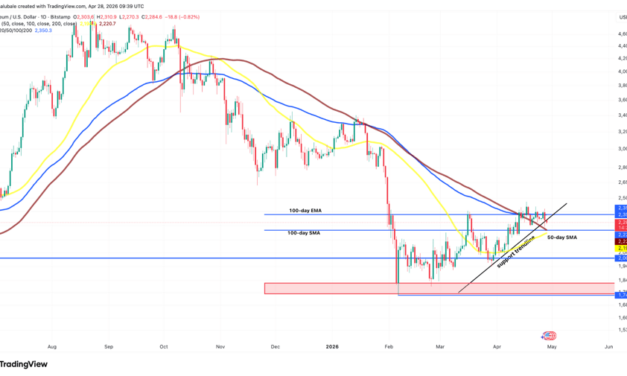
Ether (ETH) analysts have mapped out key ETH price levels to watch over the next few weeks, with a focus on the $2,000 psychological level.Key takeaways:Dropping below the 200-day simple moving average at $2,220 could confirm more downside for Ether.ETH faces stiff resistance at $2,400, a level that must be reclaimed by the bulls. Ether price stuck between two key levelsData from TradingView showed the ETH/USD pair trading below $2,300, down 5% over the last two days and erasing all gains made over the weekend. This meant that the price remained wedged between the 100-day exponential moving average at $2,350 and the 100-day simple moving average (SMA) at $2,220, as shown in the chart below.This suggested that Ether could consolidate within these trend lines for a few more days before a decisive move.Telegram trading resource Technical Crypto Analyst said that after losing the support trendline at $2,300, “we can probably expect Ethereum to drop, and it might even hit the lower support level in the next few days,” adding: “A solid breakdown with good volume would confirm this.”ETH/USD daily chart. Source: Cointelegraph/TradingViewThe analyst was referring to two immediate support zones: the $2,200 area, where the 50-day and 100-day SMAs converge, and the psychological level at $2,000.“ETH has dropped below the $2,300 level,” said fellow analyst Ted Pillows in a Tuesday post on X, adding:“The next crucial support zone is $2,200 which could be a level for a short-term bounceback.”A key buy zone to watch below that is the $1,800-$1,750 area, which aligns with the multi-year low reached on Feb. 6.In a recent post on X, trader Daan Crypto Trades said that the key levels to watch were $2,100 as support and the resistance at $2,800, which ETH price has “respected” well over the past few years.ETH/USD daily chart. Source: X/Daan Crypto TradesAs Cointelegraph reported, a daily close below the moving averages around $2,200 would bring the next line of defense at $2,000 into focus.Ethereum price must reclaim $2,400 to continue recoveryAs Cointelegraph also reported, Ether’s bullish case hinges on flipping the resistance at $2,400 into support, where the realized price currently is.“This is a very important psychological factor,” CryptoQuant analyst CW8900 said in a recent X post, adding:“Breaking through that line signifies that whales are transitioning to a profitable position.”ETH realized price. Source: CryptoQuantWith whales back in a profitable position, it would “provide grounds for their buying power to become stronger,” the analyst added.Related: Ethereum’s EEZ could pull other blockchains into its orbitMeanwhile, Ether’s liquidation map reveals that a break above $2,400 would trigger over $1.94 billion in short liquidations across all exchanges.ETH exchange liquidation map. Source: CoinGlassThis means a significant amount of bearish bets risk liquidation on a move higher, opening the way to a sharper upward cascade if the recovery resumes.This article is produced in accordance with Cointelegraph’s Editorial Policy and is intended for informational purposes only. It does not constitute investment advice or recommendations. All investments and trades carry risk; readers are encouraged to conduct independent research.

Čítaj viac
XRP price risks 40% decline versus Bitcoin despite 9-day ETF inflow streak

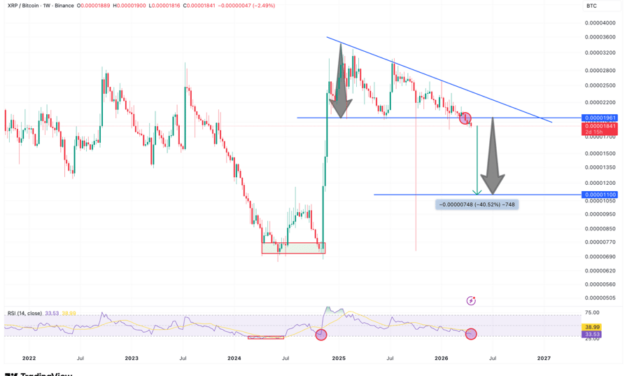
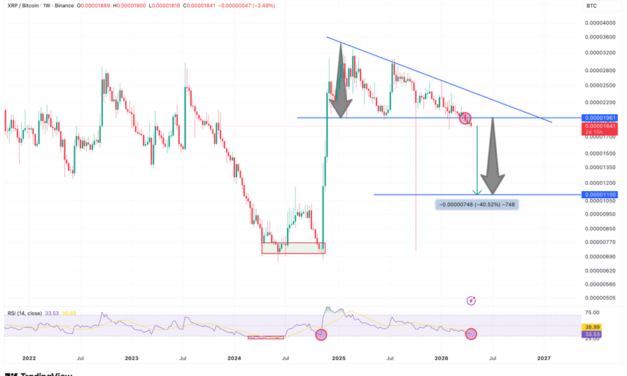
XRP (XRP) has fallen about 5% against Bitcoin (BTC) over the past week, and the confirmation of a bearish pattern now points to the risk of more losses ahead.Key takeaways:XRP/BTC’s descending triangle pattern on the weekly chart points to a possible 40% drop toward 0.000011 BTC.Persistent institutional demand through US-based spot ETFs supports the case for a recovery in XRP price. XRP’s descending triangle breakdown is underwaySince late 2024, the XRP/BTC ratio has been consolidating inside a descending triangle on the weekly time frame.In technical analysis, descending triangles are typically viewed as bearish patterns. The pattern was confirmed when the price produced a weekly candlestick close below the triangle’s lower trend line at 0.000096 BTC, as shown in the chart below.The downside target is derived by taking the height of the triangle and placing it lower from the point where the price breaks below the pattern’s lower trend line.XRP/BTC weekly chart. Source: Cointelegraph/TradingViewUsing that method, the XRP/BTC pair’s measured downside target comes in near 0.000011 BTC, about 40.5% below current levels.“$XRP/BTC looks edgy,” technical analyst ChartNerd said in a recent post on X, adding that losing support at $0.000091 would lead to further losses in the XRP/BTC ratio as well as the XRP/USD pair.XRP/BTC weekly chart. Source: Chart NerdHowever, the RSI is near oversold at 33, levels that have previously marked macro bottoms for the ratio, as seen in mid- and late 2024. This suggests that the current downtrend could soon come to an end.  As Cointelegraph reported, a similar recovery could be seen in XRP price as several technical and onchain indicators send bottoming signals.XRP ETF demand makes a comebackInstitutional demand for XRP investment products has been strengthening, according to data from SoSoValue.US-based spot XRP exchange-traded funds (ETFs) posted $3.89 million in net inflows on Thursday. This marked nine consecutive days of net inflows, totaling $73.78 million. This streak has pushed cumulative inflows to nearly $1.28 billion and AUM to $1.1 billion.US spot XRP ETF flows chart. Source: SoSoValueThis indicates an increased institutional appetite for XRP products, despite the price declining 22% in 2026 and lagging against Bitcoin.“$XRP ETF inflows continue,” analyst Don Digital Finance said in a Friday X post.It signals “steady institutional demand as accumulation continues despite sideways price action,” the analyst added.“Institutional demand is rising fast as big money continues flowing into XRP exposure,” fellow analyst Ledger Man said, adding:“This could be a major signal that confidence in XRP is growing stronger than ever.”

Čítaj viac

XRP price risks 40% decline versus Bitcoin despite 9-day ETF inflow streak

XRP (XRP) has fallen about 5% against Bitcoin (BTC) over the past week, and the confirmation of a bearish pattern now points to the risk of more losses ahead.Key takeaways:XRP/BTC’s descending triangle pattern on the weekly chart points to a possible 40% drop toward 0.000011 BTC.Persistent institutional demand through US-based spot ETFs supports the case for a recovery in XRP price. XRP’s descending triangle breakdown is underwaySince late 2024, the XRP/BTC ratio has been consolidating inside a descending triangle on the weekly time frame.In technical analysis, descending triangles are typically viewed as bearish patterns. The pattern was confirmed when the price produced a weekly candlestick close below the triangle’s lower trend line at 0.000096 BTC, as shown in the chart below.The downside target is derived by taking the height of the triangle and placing it lower from the point where the price breaks below the pattern’s lower trend line.XRP/BTC weekly chart. Source: Cointelegraph/TradingViewUsing that method, the XRP/BTC pair’s measured downside target comes in near 0.000011 BTC, about 40.5% below current levels.“$XRP/BTC looks edgy,” technical analyst ChartNerd said in a recent post on X, adding that losing support at $0.000091 would lead to further losses in the XRP/BTC ratio as well as the XRP/USD pair.XRP/BTC weekly chart. Source: Chart NerdHowever, the RSI is near oversold at 33, levels that have previously marked macro bottoms for the ratio, as seen in mid- and late 2024. This suggests that the current downtrend could soon come to an end.  As Cointelegraph reported, a similar recovery could be seen in XRP price as several technical and onchain indicators send bottoming signals.XRP ETF demand makes a comebackInstitutional demand for XRP investment products has been strengthening, according to data from SoSoValue.US-based spot XRP exchange-traded funds (ETFs) posted $3.89 million in net inflows on Thursday. This marked nine consecutive days of net inflows, totaling $73.78 million. This streak has pushed cumulative inflows to nearly $1.28 billion and AUM to $1.1 billion.US spot XRP ETF flows chart. Source: SoSoValueThis indicates an increased institutional appetite for XRP products, despite the price declining 22% in 2026 and lagging against Bitcoin.“$XRP ETF inflows continue,” analyst Don Digital Finance said in a Friday X post.It signals “steady institutional demand as accumulation continues despite sideways price action,” the analyst added.“Institutional demand is rising fast as big money continues flowing into XRP exposure,” fellow analyst Ledger Man said, adding:“This could be a major signal that confidence in XRP is growing stronger than ever.”

Čítaj viac

These 3 Ethereum metrics favor an ETH price rally to $6K

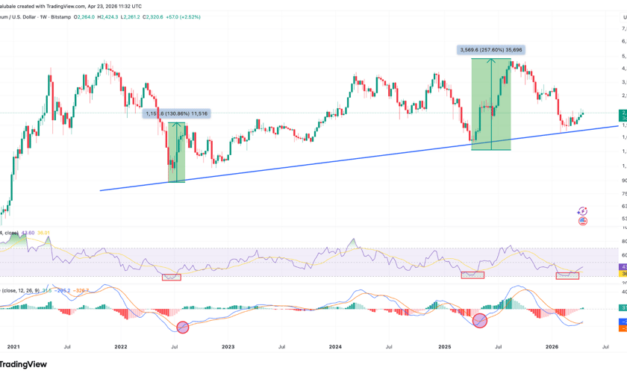
Ether’s (ETH) 33% rally from its sub-$1,800 multi-year lows appears to be cooling, but several key metrics suggest the top altcoin may be primed for a bigger rally toward $6,000 or higher.Key takeaways:Ether is currently displaying a technical setup similar to past cycles that ignited a massive rally in ETH price. Supply squeeze potential is growing as increasing accumulation and exchange outflows reduce immediate sell pressure.A rising Coinbase premium reflects the return of US institutional demand.Ether’s fractal targets a $6,000 ETH price Ether is currently bouncing off a multi-year trend line that has historically marked macro ETH price bottoms. Previous instances in April 2025 and mid-2022 resulted in 260% and 130% ETH price rallies, respectively. “$ETH is holding a long-term ascending trendline support,” analyst CryptoJack said in a recent X post, adding:“Will history repeat itself?”ETH/USD weekly chart. Source: Cointelegraph/TradingViewA bullish cross from the moving average convergence divergence (MACD) indicator also confirmed the price bottom.“$ETH weekly MACD bullish cross is now confirmed,” analyst Ash Crypto said in a recent X post, adding:“The last 2 times this happened, ETH pumped 183% and 75%.”The weekly RSI is meanwhile recovering from levels that marked previous macro lows, suggesting that Ether’s recent drop to $1,750 was the bottom.ETH/USD weekly chart. Source: The Moon ShowEther’s current price action is following a similar pattern, with the price again bouncing off the same structural support, a confirmed bullish MACD crossover, and the RSI’s recovery from oversold conditions.If history repeats itself, ETH may rally by between 75% and 260% from the bottom, placing Ether’s upside target at $3,000-$6,300.ETH supply squeeze potential risesEthereum’s on-chain metrics reveal a tightening supply dynamic, an occurrence that has previously ignited significant ETH price rallies.The Binance ERC-20: Stablecoin Whale Activity Index indicator reveals structural supply exhaustion.The chart below shows that the number of daily accumulation addresses (wallets steadily buying ETH) has increased to 2,434, surpassing the number of exchange depositing addresses (wallets preparing to sell), which has dropped to 2,300. This shift suggests that large players have moved from a “wait-and-see” phase into active accumulation, CryptoQuant analyst GugaOnChain said in a recent QuickTake analysis.“This scenario is extremely positive for the price structure, as it reveals that there are significantly fewer addresses sending ETH to the exchange with the intention to sell than players accumulating or positioned to absorb liquidity,” the analyst said, adding:“The supply shock is fully underway.”Binance ERC-20 stablecoin whale activity index. Source: CryptoQuantThis is also seen in increasing exchange outflows, as the ETH net position change among exchanges for the past 30 days fell by 1.4 million ETH on April 2, marking the largest spike in seven months, according to Glassnode data. The net position change is at -351,300 ETH (30 days) at the time of writing on Thursday.ETH: Exchange net position change. Source: GlassnodeSuch outflows typically indicate strong accumulation by large holders, who move tokens to cold storage or invest in investment products, thereby reducing immediate sell pressure.This is usually referred to as a “supply squeeze,” conditions that have, historically, preceded sharp upside moves, especially when combined with improving market sentiment.Ethereum demand recoversAs Cointelegraph reported, Ether futures on Binance have risen to a near two-month high as aggressive buyers stepped into the market over the past week. Buy-taker volume rose above $5 billion, and the current setup leans bullish.The US market is driving a significant share of this demand, as measured by the Coinbase premium index.The ETH Coinbase premium index measures the price difference between the ETH/USD pair on Coinbase and Binance.This metric flipped positive on April 4, rising to 0.055 on April 14, its highest level since October 2025. The index fell to as low as -0.21 in early February and has now recovered to 0.04.This typically signals increased demand from institutional investors, particularly in the US market.Ethereum Coinbase Premium Index. Source: CryptoQuantMeanwhile, spot Ethereum ETFs have recorded net inflows for 10 consecutive days, totaling $590 million. This marks the longest inflow streak since December 2024, accompanying a 95% ETH price rally in Q4 2024.Spot Ethereum ETF flows table. Source: SoSoValueMeanwhile, Bitmine Immersion Technologies, the world’s largest public holder of Ether, increased its holdings last week with another 101,627 ETH purchase, reflecting a return of demand for ETH among institutional investors.

Čítaj viac

‘Powerful move’ looms for Bitcoin price, says Bollinger Bands indicator

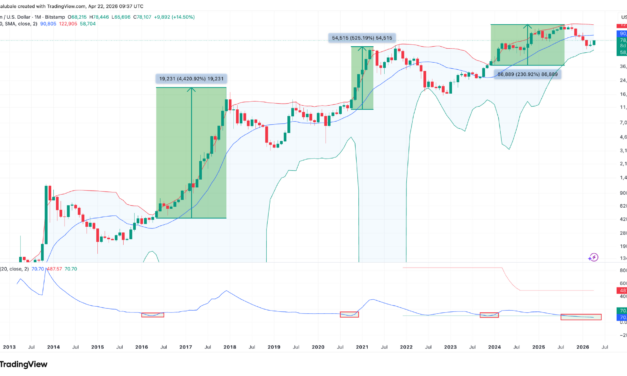
Bitcoin (BTC) could see further upside volatility as several technical indicators suggested the BTC price was due for a “powerful“ upward move.Key takeaways:Bitcoin’s Bollinger Bands indicator now sees the potential for a massive price breakout.BTC price needs to overcome resistance at $80,000 for more upside. Bollinger Bands suggest Bitcoin’s “bull run is next”Bitcoin’s Bollinger Bands have reached their tightest point ever on the monthly time frame, signaling that volatility should be expected soon.Related: Bitcoin ‘Bull Score’ hits six-month high as 2022 bear-market fears lingerBollinger Bands (BB) is a technical indicator used by traders to assess momentum and volatility within a certain range.The “tightest Bitcoin monthly Bollinger band squeeze, ever,” said analyst Cantonese Cat in an X post on Wednesday.“​​This will lead to a very powerful move when it expands,” the analyst added.The BTC/USD pair gained about 230% between December 2023 and August 2025 to its current all-time high of $126,000, after breaking above the upper boundary of the Bollinger Bands.Similar occurrences in 2020 and 2016 triggered the previous bull runs that saw BTC price rally more than 520% and 4,400%, respectively.BTC/USD monthly chart. Source: Cointelegraph/TradingViewMeanwhile, Coinvo Trading shared a chart showing that Bitcoin’s monthly RSI has dropped to its lowest level since late 2022.This coincided with the BTC/USD drop to a multi-year support trend line, an occurrence that has previously marked Bitcoin’s macro bottoms.The last time this happened was at the bottom of the 2022 bear market, preceding a 350% BTC price rally to its previous all-time high of $73,800, reached in March 2024.“The same exact trendline, the same oversold RSI, the same outcome,” Coinvo Trading said, adding:“Bull run is next in line.”BTC/USD monthly chart. Source: Coinvo TradingAs Cointelegraph reported, several Bitcoin metrics, including a bullish MACD crossover on the weekly chart, suggest that a BTC price breakout is about to begin. Bitcoin must reclaim $80,000 nextBitcoin’s 6% rally over the last three days saw the BTC/USD pair fill the $74,000-$77,000 CME gap created over the weekend.Traders are now looking at the next CME gap above $80,000, formed in early February.BTC/USD four-hour chart. Source: X/NicMC Capital founder Michael van de Poppe said resistance at $79,000 could temporarily “stall” Bitcoin’s upward momentum“Likely we’ll test it first, come back down for a little, find extra stamina, and then we’ll push through to $86K.”BTC/USD daily chart. Source: X/Michael van de PoppeMeanwhile, Bitcoin’s whale order book showed “heavy sell pressure” between $78,000-$80,000, reinforcing the significance of this resistance level.Bitcoin whale order book. Source: CoinGlassAs Cointelegraph reported, a close above the $76,000-$78,000 resistance zone would confirm that the buyers are in control, clearing the path for a potential rally to $84,000.

Čítaj viac

Získaj BONUS 8 € v Bitcoinoch

nakup bitcoin z karty

Registrácia Binance

Burza Binance

Aktuálne kurzy