Autor Cointelegraph by Nancy Lubale

Bitcoin's crash to $65K triggers $1.8B in crypto liquidations

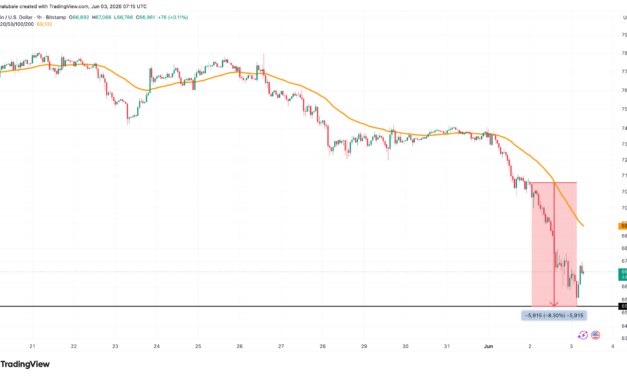
Bitcoin (BTC) has dropped 8% to a nine-week low of $65,360 from Tuesday’s high of $71,300 amid increasing geopolitical risks surrounding the US-Iran war.Key takeaways:Bitcoin slipped to $65,000 on Wednesday in a market-wide correction, liquidating $774 million in longs.Traders say Bitcoin needs to hold $60,000 as support to avoid a deeper correction in BTC price.Bitcoin wipes out longs in tumble to $65,000Data from TradingView showed new BTC price lows of $65,362 on Bitstamp, the lowest since March 29 as sellers stayed in control.BTC/USD daily chart. Source: Cointelegraph/TradingViewThis extended the deviation from the local high of $82,800 to 21% and was accompanied by massive liquidations across the derivatives market.Related: Bitcoin’s $224K ‘fair value’ may emerge if sovereign debt fears deepen: BitwiseMore than $1.58 billion in long positions were liquidated, with Bitcoin accounting for $774.2 million of that total. Ether (ETH) followed with $440 million in long liquidations.Across the board, a total of $1.83 billion was wiped out of the market in short and long positions, marking the largest liquidation since Feb. 6, when BTC price tanked to its multi-year low below $60,000.Total crypto liquidations across all exchanges. Source: CoinGlass“This marks one of the larger single-day events in recent months,” analysts at CryptoBanter said in an X post on Wednesday.Pseudonymous analyst Byzantine General shared Velo data, which tracks liquidations from four major crypto exchanges: Binance, Bybit, OKX and Deribit, saying:“Highest $BTC long liquidations event since the infamous October 10 black swan event.”Bitcoin aggregate liquidations. Source: X/Byzantine General Fellow analyst DonaX₿τ pointed out that the $1.5 billion in long liquidations recorded today were lower than the $1.6 billion posted during the Covid crash in 2020, adding:“This industry is growing.”Meanwhile, Bitcoin supply on Binance, the world’s largest crypto exchange by trading volume, has reached a three-month high of 659,000 BTC. This signifies a “potential for heightened selling pressure in the market, especially if it coincides with declining prices or increased volatility,” CryptoQuant analyst Arab Chain said in a QuickTake note on Wednesday, adding:“Rising supply on exchanges can amplify price volatility and selling pressure, especially if inflows continue in the coming period.”Bitcoin supply on Binance. Source: CryptoquantAs Cointelegraph reported, Bitcoin is now in a fresh distribution phase fueled by increased inflows to exchanges amid extreme fear.$60,000 is now Bitcoin’s last line of defenceBTC swept lows around $65,000, leaving traders questioning where Bitcoin is likely to find support.Bitcoin is in an “interesting zone” below $66,000 with bulls looking at the “area at $61K with the 200-Week MA for support,” MN Capital founder Michael van de Poppe said in a Wednesday post on X, adding:“Those are important to be looking at crucial zones of interest for support and I’m sure that I’ll be going to accumulate more positions within this region.”BTC/USD weekly chart. Source: Michael van de PoppeAnalyst Colin Talks Crypto said the $65,000-$66,000 is “a reasonable support level for a short-term bounce,” with the possibility of the BTC/USD pair later retesting the $60,000 support zone.“Re-testing $60k is still highly likely. And breaking below it later this year is definitely not ruled out.”BTC/USD six-hour chart. Source: X/𝙲𝚘𝚕𝚒𝚗 𝚃𝚊𝚕𝚔𝚜 𝙲𝚛𝚢𝚙𝚝As Cointelegraph reported, bulls are expected to defend the $60,000 level aggressively, as a break below it may plunge Bitcoin into a new downtrend. 

Čítaj viac

Bitcoin back in ‘distribution phase’ as extreme fear grips crypto market

Bitcoin (BTC) sellers took control during the European trading session on Tuesday as the BTC/USD pair slipped below the $70,000 mark for the first time since April.Analysts said that Bitcoin has entered another distribution phase due to high selling pressure and investors realizing losses.Key takeaways:Bitcoin sees renewed distribution as short-term holders sell at a loss and exchange inflows continue to rise.Crypto market sentiment fell back into “extreme fear,” while spot Bitcoin ETFs saw 11 straight days of outflows.Whale activity surged to its highest level since April, signaling possible accumulation despite broader market weakness.Bitcoin holders are capitulatingThe Short-Term Holder SOPR (STH-SOPR) metric, a measure of whether short-term holders are selling at a profit or a loss, dropped below 1 as fading US-Iran ceasefire hopes pushed Bitcoin price below $70,000.Related: Bitcoin bulls consider fresh positions after BTC price drops under $71KCurrently at 0.98, it shows renewed short-term loss realization, suggesting the primary sellers are recent investors reacting to uncertainty rather than long-term structural distribution.Bitcoin: Short-term holder SOPR. Source: CryptoQuantThe chart above shows a similar occurrence in early February after US President Donald Trump announced 15% blanket tariffs despite the Supreme Court ruling them illegal. Uncertainty intensified as the clash between Federal law and presidential authority sent BTC price to $65,000. The same behaviour is seen among the six-12 month holder group that has “activated potential selling positions,” CryptoQuant analyst Rei Researcher said in a QuickTake note on Tuesday.The volume of BTC deposited to exchanges by the six-12month holder cohort (yellow columns) has increased continuously since May, reaching levels last seen in October 2025 when Bitcoin reached its all-time high above $126,000. BTC price has been in an extended downtrend since then.Large supply pressure from this group, appearing heavily at this time, is a “huge barrier to the recovery momentum,” the analyst said, adding:“This exchange inflow volume needs to be well absorbed; otherwise, $BTC will face deeper correction waves.”Bitcoin exchange SOPR age bands. Source: CryptoQuantAdditionally, Bitcoin’s realized profit/loss ratio, a measure of the balance between realized gains and losses for coins spent onchain, has dropped to -0.87 from -0.4 last week, representing a 125% increase, according to data from Glassnode.“This reflects a period of heightened selling pressure where market participants are increasingly willing to divest their holdings at a loss,” the onchain data provider said in its latest Market Pulse report, adding:“Bitcoin is in a distribution phase with deteriorating breadth.”Bitcoin realized profit/loss ratio. Source: GlassnodeCrypto sentiment drops to “extreme fear” againThe Crypto Fear and Greed Index hit 23 on Tuesday, returning to the “extreme fear” reading that characterized the market between early February and late April. The index gauges market sentiment using volatility, momentum, trading volume, and social signals. A score below 25 signals “extreme fear” or risk aversion, while 26–49 reflects cautious positioning or “fear,” with higher readings indicating improving investor confidence or “greed.” Crypto Fear and Greed Index. Source: Alternative.meThe index’s move below 25 follows the latest sell-off in the crypto market, which has seen the global crypto market capitalization drop 7% over the last week, while Bitcoin dropped 9.3% over the same period. Spot Bitcoin exchange-traded funds (ETFs) have also recorded a string of outflows over the past 11 trading days, according to Farside Investors data. The biggest outflow over the 11 days was $733.4 million on May 27.Spot Bitcoin ETF flows chart. Source: Farside InvestorsMeanwhile, other analysts spotted other signs of optimism for the Bitcoin bulls.As Bitcoin dipped below $70,000, the “network saw most transactions valued at $100,000 or more since April 22,” onchain analytics platform Santiment said in a Tuesday X post, adding:“This is historically a strong sign of whale accumulation.”BTC $100K+ transactions. Source: Santiment

Čítaj viac

Are Ethereum OGs jumping ship? Here's what the data says

An early Ether (ETH) investor sold their ETH holdings over the past week as the price headed toward $2,000, sparking fears of further losses. However, onchain data tells a different story as traders speculate where ETH/USD might bottom.Key takeaways:An early Ethereum whale sold $136 million in ETH, adding pressure as Ether trades below the $2,000 level.Onchain data shows no evidence that older ETH investors are selling en masse.Analysts warn the ETH price could fall further toward the $1,500 support.Ethereum OG whale sells $136 million ETHAn old Ethereum whale, an early investor holding tokens since the network’s first years, sold 55,000 ETH worth about $112.25 million and 9,442 ETH worth roughly $24 million over the past week. Related: Ether bears at risk of $2B squeeze as short positions build around $2KThe early Ether investor offloaded a combined $136 million at an average price of $2,041 per ETH, according to blockchain data tracker Lookonchain. Selling by an old ETH wallet. Source: LookonchainHowever, this does not appear to be part of a wider trend, as an analysis of Ethereum’s supply, based on “HODL waves,” reveals that a significant portion of Ethereum supply remains unmoved on various time frames. In fact, the share of the supply by older holder cohorts has generally increased over the past year. More recently, the 3m-6m investor cohort saw a notable reduction in supply, which has dropped to 9% from 13.5% on May 19. The 1w-1m holder cohort has also seen its supply holdings drop to 2.6% from 4.76% over the same period. This suggests that most of the supply changing hands is being done by short-term holders. Ethereum: HODL Waves. Source: GlassnodeIn fact, supply held by the 5y-7y investor cohort has increased slightly to 9% from 8.59% on May 19. Moreover, the chart below shows that the supply last active 5-7 years ago has only seen a modest rise in recent weeks and is well below the activity seen in 2022 when ETH price bottomed below $1,000. ETH: Total supply last active 5 years to 7 years. Source: Glassnode Except for several significant players announcing that they have sold a part or their entire ETH holdings recently, there’s no real broad trend to support the argument that Ethereum OGs are selling en masse. Ether price drop to $1,500?Since Thursday, ETH/USD has been oscillating around the $2,000 psychological level as traders braced for more price downside.At the time of writing, ETH is trading at $1,980, down 2% over the last 24 hours and 6.5% on the week.“This doesn’t look good for Ethereum,” analyst Alex Marzell said in an X post on Sunday adding:“Momentum continues to favor the bears as $ETH moves closer to the next key support area.”ETH/USD daily chart. Source: X/MarzellMarzell was referring to the crucial support around $1,800, which analysts say must hold to avoid a deeper correction.  Fellow analyst Merlijn The Trader said that the ETH/USD price action is “mapping perfectly onto a Wyckoff Accumulation structure,” as shown on the three-day chart below.The analyst explained that ETH is currently in a “Phase B consolidation, post-selling climax” and was entering Phase C, where it would bottom below $1,500. ETH/USD three-day chart. Source: Merlijn The TraderAnother analysis by Echo Analysis said a bear flag breakdown projected ETH price drop toward $1,500 support.ETH/USD daily chart. Source: Echo AnalysisAs Cointelegraph reported, increasing supply on exchanges and declining ETF demand put ETH at risk of another leg down toward the $1,500-$1,700 demand zone.

Čítaj viac

Ethereum analysts say ‘downside pressure’ remains as $1.8K becomes key

Market analysts say Ether (ETH) still faces “downside pressure” that could trigger another ETH price sell-off as traders shift their focus to support at $1,800. Key takeaways:Ether faces downside pressure as elevated leverage and positive funding rates amid falling prices signal fragile market conditions.Analysts say ETH must hold the $1,800-$1,750 support zone to avoid a deeper correction.Ether price metrics suggest downside risks remainAnalysts have highlighted several reasons for Ether’s potential to drop lower, including an elevated estimated leveraged ratio and positive funding rates amid a “weakening price structure,” according to CryptoQuant analyst PelinayPA. The chart below shows that Ether’s estimated leverage ratio (yellow line) remains relatively elevated at around 0.74.Related: Ether bears at risk of $2B squeeze as short positions build around $2KThe funding rate (blue line) has remained mostly in positive territory since mid-April, meaning long positions still dominate the market. Meanwhile, the RSI (purple line) is closer to the oversold zone at 31 and has not yet “produced a convincing recovery signal,” the analyst said in a Friday QuickTake analysis.“Leverage remains elevated and long positioning is still dominant, yet price continues to struggle as the RSI reflects weakening momentum,” the analyst said, adding:“Overall this combination suggests that short term downside pressure in the ETH market still remains the dominant structure.”ETH: Funding rates and leveraged ratioUnder normal market conditions, rising leverage and increasing funding rates are usually supported by strong price expansion. However, in this case, leverage remains high while price continues to record lower lows.“But the key signal is that this leverage build-up came alongside heavy sell-side pressure,” fellow analyst Amr Taha said in another QuickTake note. The chart below shows that the Binance cumulative net taker volume fell to around -$744 million, its deepest negative reading since April 6, 2026.Amr Taha added:“This means new leverage entered the market while aggressive sellers were still in control, making the setup more fragile than a clean bullish open-interest expansion.”ETH: Cumulative net taker volume on Binance. Source: CryptoQuantThis suggests that the market structure is driven by derivative positioning instead of spot demand, which creates a weaker overall setup.Waning demand is also seen in US-based spot Ethereum exchange-traded funds (ETFs), which continue to post heavy outflows, indicating declining institutional interest. These ETFs have recorded outflows for thirteen consecutive days, totaling $695 million. The $121 million in net outflows recorded on Thursday marked the largest withdrawal in two weeks.Spot Bitcoin Ether flows chart. Source: SoSoValueAs Cointelegraph reported, a break below the crucial $2,000 support and increased selling by whales indicate additional downside risk for ETH price in the near term. Ether price must hold above $1,800Ether’s 7% drop over the last three days has seen it lose the crucial $2,000 support, as the bears gained momentum.Traders are now watching key levels on the downside, including the $1,800 demand zone.“A good spot buy would be around $1,700-$1,800 key area,” analyst Suraj Jha said in a Friday post on X, adding:“A confirmed breakdown below this level could shift the structure bearish and open up continuation to the downside.”Fellow analyst Crypto Patel said Ether’s technical structure remains “bearish until we reclaim $3050.”The ETH/USD pair “needs to hold $1,750 to keep the long-term bullish case alive,” the analyst said, adding:“If $1,750 breaks, accumulation zone 2 sits at $,1500-$,1400, a massive discount for long-term holders.”ETH/USD two-day chart. Source: X/CryptoPatelA daily candlestick drop below $1,750 could trigger another sell-off episode, first toward the April 2026 low at $1,550 and later to the 2022 macro low around $1,000, as shown on the daily chart below. This would bring the total losses to 47% from the current price.ETH/USD weekly chart. Source: Cointelegraph/TradingViewAs Cointelegraph reported, after losing the psychological support at $2,000, the ETH/USD pair may then descend toward the $1,900-$1,750 zone, which buyers are expected to defend aggressively. 

Čítaj viac

Bitcoin falls out of the global top 10 assets as market cap dips below $1.5T

Bitcoin’s (BTC) latest drawdown to $72,000 has coincided with a sharp drop in its market capitalization, pushing it out of the global top 10 assets by market cap.Key takeaways:Bitcoin fell to 13th place among global assets after its market cap dropped below $1.5 trillion.Gold, silver and AI stocks outperformed Bitcoin after investors rotated.Bitcoin’s pending realized price death cross could signal further downside risk for BTC price.Bitcoin’s market cap drops below $1.5 trillionBitcoin’s price has dropped sharply from around $83,000 in early May to as low as $72,400 on Thursday. This was accompanied by a fall in its market capitalization to $1.45 trillion from $1.66 trillion.Bitcoin market cap, USD. Source: Cointelegraph/TradingViewAs a result, the leading cryptocurrency has slipped out of the world’s top 10 assets by market cap, ranking thirteenth globally. Related: Bitcoin’s major holders halt buys as demand slows: CryptoQuantBitcoin is now below Saudi Aramco, Tesla and Meta Platforms, reflecting a broader rotation of capital away from crypto amid strong performance in AI-driven stocks and precious metals.Top global assets by market cap. Source: Companiesmarketcap.comThe recent BTC price decline comes amid fresh geopolitical tensions and growing macroeconomic uncertainties, coinciding with a rally in precious metals to historical highs, showing increasing demand for traditional safe-haven assets.Gold surged to an all-time high of $5,600 per ounce in January before easing back to around $4,486, while silver climbed as high as $120 per ounce and now trades near $76. These rallies in metals pushed gold and silver to become the world’s largest and fifth-largest assets by market cap, respectively, as shown in the table above.Artificial intelligence and semiconductor stocks have also significantly outperformed Bitcoin in 2026, with companies such as Taiwan Semiconductor Manufacturing Company (TSMC) and Broadcom (AVGO) overtaking BTC in market cap. Meanwhile, Micron Technology recently crossed the $1 trillion valuation mark amid the ongoing AI and semiconductor-driven rally.“Things are starting to look scary,” 0xMarioNawfal said in a Thursday X post, referring to Bitcoin’s current position in global rankings.Fellow analyst Manly had a contrary view, saying that the drop doesn’t change Bitcoin’s scarcity as a long-term bullish factor, while  Fexir said, “This must be a bottom signal.”Bitcoin’s “death cross” warns of more pain aheadBitcoin’s realized price, average cost basis of all coins in circulation, is about to print a “death cross,”  indicating waning momentum, according to analyst Axel Adler Jr.The chart below shows that Bitcoin is showing signs of exhaustion with a pending dead cross between its realized price and the 365-day moving average. The last time the indicator produced this bearish crossover was in the middle of the 2022 bear market, preceding a 52% decline to $15,500 from $69,000. The losses were also 52% during the 2018 macro drawdown.Bitcoin realized price with a pending “death cross.” Source: AxelAdlerJrNote that in both instances, the crossover followed a sharp drop in BTC price toward the realized price. Bitcoin is currently trading 35% above its realized price at $54,200. This means a 52% drop from around this level could take BTC price to the low $30,000s, an occurrence that many analysts argue is unlikely.

Čítaj viac

Získaj BONUS 8 € v Bitcoinoch

nakup bitcoin z karty

Registrácia Binance

Burza Binance

Aktuálne kurzy