
Autor Cointelegraph By Marcel Pechman

Bulls aim to turn the tide in Friday’s $580M options expiry after BTC tops $43K

Bitcoin (BTC) investors seem uncomfortable with adding positions after the most recent 40% correction from the $69,000 all-time high made on Nov. 10. In addition to the prolonged downtrend, remarks from the United States Federal Reserve on Dec. 15 about rising interest rates are also weighing on risk-on assets.The Fed signaled that it could raise its benchmark rate three times this year and there are plans to increase the pace of its asset purchasing taper. Consequently, traders are worried that these plans will negatively impact traditional and crypto markets because liquidity will no longer be “easily” available.Bitcoin price at Coinbase, USD (right) vs. China stock market MSCI index (left)Cryptoasset regulation in the U.S. has been in the spotlight and recently a member of the Securities and Exchange Commission’s Investor Advisory Committee called for the agency to open public comments regarding digital asset regulation. On Jan. 18, associate law professor J.W. Verret addressed the petition to SEC Secretary Vanessa Countryman and according to Verret, the current path the SEC is taking seems not to recognize that digital assets do not fit within the regulatory framework designed for equity investments. The professor also questioned the requirements the SEC would consider in approving a Bitcoin spot exchange-traded fund.$590 million in options expire on Jan. 21Even though Bitcoin is said to be correlated to traditional markets, BTC derivatives traders were not expecting sub-$44,000 prices, according to the Jan. 21 options expiry. Friday’s $590 million open interest will allow bears to score up to $82 million if BTC trades below $41,000 during the expiry.Bitcoin options aggregate open interest for Jan. 21. Source: Coinglass.comAt first sight, the $380 million call (buy) options vastly surpass the $210 million put (sell) instruments, but the 1.81 call-to-put ratio is deceptive because the recent price drop will likely wipe out most of the bullish bets.There is no value in the right to buy Bitcoin at $44,000 if it is trading below that price. Therefore, if Bitcoin remains below $44,000 at 8:00 am UTC on Jan. 21, only $64 million of those call (buy) options will be available at the expiry. Bears are comfortable with Bitcoin price below $42,000Here are the four most likely scenarios for Jan. 21’s $590 million options expiry. The imbalance favoring each side represents the theoretical profit. In other words, depending on the expiry price, the active quantity of call (buy) and put (sell) contracts varies:Between $40,000 and $41,000: 30 calls vs. 3,320 puts. The net result is $132 million favoring the put (bear) options.Between $41,000 and $42,000: 170 calls vs. 2,180 puts. The net result is $82 million favoring the put (bear) instruments.Between $42,000 and $44,000: 1,480 calls vs. 1,130 puts. The net result is balanced between call and put options.Between $44,000 and $45,000: 2,980 calls vs. 630 puts. The net result favors call (bull) instruments by $103 million.This crude estimate considers put options being used in bearish bets and call options exclusively in neutral-to-bullish trades. However, this oversimplification disregards more complex investment strategies.Bulls need $44,000 to bag a $103 million profitRegulatory uncertainty and Federal Reserve monetary policies might be reasons for the recent market weakness, but a mere 5% price pump from the current $42,000 level is enough for Bitcoin bulls to profit $103 million on Jan. 21’s expiry.However, if the current short-term negative sentiment prevails, bears could easily pressure the price below $41,000 and pocket $132 million gains.Currently, options markets data slightly favor the put (sell) options, but the outcome is yet to be seen.The views and opinions expressed here are solely those of the author and do not necessarily reflect the views of Cointelegraph. Every investment and trading move involves risk. You should conduct your own research when making a decision.

Čítaj viac
2 key Bitcoin trading indicators suggest BTC is ready for a 62% upside move

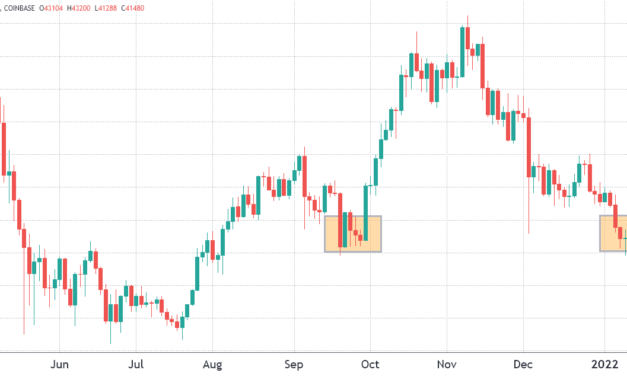
Bitcoin (BTC) has been below $45,000 for 14 days and is currently 40% below the $69,000 all-time high. This movement holds similarities to late-September 2021, when Bitcoin price flat-lined for 11 days and was 36% below the previous $64,900 all-time high on April 14.Bitcoin price at Coinbase, USD. Source: TradingViewTo understand whether the current price momentum mimics late September, traders should start by analyzing the Bitcoin futures contracts premium, which is also known as “basis.” Unlike a perpetual contract, these fixed-calendar futures do not have a funding rate, so their price will differ vastly from regular spot exchanges.By measuring the expense gap between futures and the regular spot market, a trader can gauge the level of bullishness in the market. Excessive optimism from buyers tends to make the three-month futures contract to trade at a 15% or higher annualized premium (basis).Bitcoin 3-month futures premium in Sept. 2021. Source: laevitas.chFor example, earlier in September, the basis rate ranged from 9% to 13%, indicating confidence, but on Sept. 29, right before Bitcoin broke out above $45,000, the 3-month futures premium was at 6.5%. Generally, readings below 5% are typically deemed bearish, so a 6.5% reading in late September meant investors were displaying low confidence.Bitcoin 3-month futures premium. Source: laevitas.chRegarding the current market conditions, there are a lot of similarities to September 2021, right before Bitcoin broke $45,000 and initiated a 62% rally. First, the current Bitcoin 3-month futures premium stands at 6.5% and the indicator recently ranged from 9% to 11%, reflecting mild optimism.Unexpected positive market moves happen when investors least expect it and this is precisely the scenario happening right now. To confirm whether this move was specific to the instrument, one should also analyze options markets. The 25% delta skew compares equivalent call (buy) and put (sell) options. The indicator will turn positive when “fear” is prevalent because the protective put options premium is higher than the call options.Related: What bear market? Current BTC price dip still matches previous Bitcoin cycles, says analystThe opposite holds when market makers are bullish, causing the 25% delta skew to shift to the negative area. Readings between negative 8% and positive 8% are usually deemed neutral.Deribit Bitcoin options 25% delta skew in Sept. 2021. Source: laevitas.chThe 25% delta skew ranged near 10% by late Sept. 2021, indicating distress from options traders. Market makers and arbitrage desks were overcharging for protective put (bearish) positions.Deribit Bitcoin options 25% delta skew. Source: laevitas.chAccording to the current 25% delta skew indicator, options traders are neutral. However, on Jan. 10 the metric touched the 8% positive threshold, signaling a mild bearishness.Derivatives metrics show that the current market conditions resemble late-September when Bitcoin reversed a 24-day downtrend and initiated a 62% rally in the following three weeks. Will this phenomenon repeat itself? Bitcoin bulls certainly hope so.The views and opinions expressed here are solely those of the author and do not necessarily reflect the views of Cointelegraph. Every investment and trading move involves risk. You should conduct your own research when making a decision.

Čítaj viac
Here’s why Binance Coin is 33% down from its all-time high

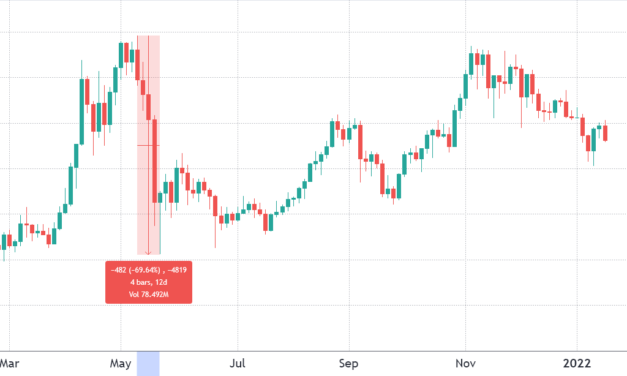
Binance Coin (BNB) holders enjoyed a 1,760% rally from $37 to $692 between January and May 2021, but as is customary in crypto, this surge was followed by a 69% correction two weeks later. From there, it’s been a bit of a rough patch to regain investors’ confidence and BNB failed to produce another all-time high in November even though the aggregate cryptocurrency market capitalization peaked at $3 trillion.Binance Coin / USDT at Binance. Source: TradingViewIn addition to being 33% down from its all-time high, BNB investors have other reasons to question whether the current $465 price is sustainable. Especially since traders were recently paying up to 3% per week to keep futures’ short positions open, betting on the downside.Traders flipped bearish on January 10Unlike regular monthly contracts, perpetual futures prices are very similar to those at regular spot exchanges. This makes the process for retail traders a lot easier because they no longer need to calculate the futures premium or manually roll over positions near expiry.The funding rate allows this magic to occur, and it is charged from longs (buyers) when they demand more leverage. However, when the situation is reversed and shorts (sellers) are over-leveraged, the funding rate goes negative and they become the ones paying the fee.BNB 8-hour USDT/USD margin futures funding rate. Source: Coinglass.comNotice how the funding rate on BNB futures was mostly flat between Dec. 15 and Jan. 10, but then quickly shifted to negative 0.13%. This rate is equivalent to 2.8% per week, a relatively high cost for shorts (sellers) to keep their positions. The movement happened while BNB tested the $410 support, its lowest price in 90 days.Excessive premium versus competing blockchainsThe reason behind the Binance short could be the excessive premium versus competing smart-contract chains. For example, BNB’s $78.2 billion market capitalization is 80% higher than Solana’s (SOL) $43.3 billion. Moreover, the premium versus Terra’s (LUNA) $28.2 billion is 178%, and 275% compared to Avalanche’s (AVAX) $20.8 billion. Other factors are in play could also be Binance Smart Chain’s total value locked (TVL) stagnated at $15 billion.Binance Chain TVL in USD. Source: DefiLlama.comFor comparison, Terra’s TVL increased from $9 billion to $19 billion in three months, while Avalanche grew from $6.5 billion to $11.6 billion in the same period. The competition has vastly surpassed Binance Chain’s applications, except for the number of active users on PancakeSwap decentralized exchange.To correctly assess whether Binance Smart Chain use has topped, one must analyze the network’s activity. Some decentralized applications (dApps) like games, social, and NFT marketplaces require little total value locked (TVL) deposited on smart contracts.Binace Smart Chain daily transactions per day. Source: bscscan.comData shows that daily transactions on BSC peaked above 15 million on Nov. 25 and are recently averaging 6.5 million per day. One should also note that Binance Chain’s main competitor Ethereum has been struggling with $40 or higher average transaction fees, which creates the perfect scenario for competing chains. Despite this opportunity to seize market share, Binance Smart Chain seems to have flatlined in terms of daily transactions and TVL, both of which are signs of growth and adoption.Binance’s lead derivatives position could be challengedThe competition for Binance’s leading position might be challenged as Coinbase, America’s largest crypto exchange, plans to begin offering derivatives trading after the acquisition of FairX. Moreover, FTX exchange raised $1.32 billion from private investors and FTX US finalized its acquisition of crypto options exchange LedgerX on Oct. 25. This solidifies its plans to offer derivatives contracts for U.S. investors.There’s a good chance that Binance will keep its leadership versus Coinbase and FTX derivatives considering that it has the first-mover advantage. Furthermore, Binance launched a $1 billion development fund on Oct. 12 to expand the capabilities of the Binance Smart Chain ecosystem.Overvalued or not, solid fundamentals are backing the third-largest cryptocurrency and while the short-term price performance is not promising, there are still plenty of future catalysts for growth. The views and opinions expressed here are solely those of the author and do not necessarily reflect the views of Cointelegraph. Every investment and trading move involves risk. You should conduct your own research when making a decision.

Čítaj viac
Bitcoin price can’t find its footing, but BTC fundamentals inspire confidence in traders

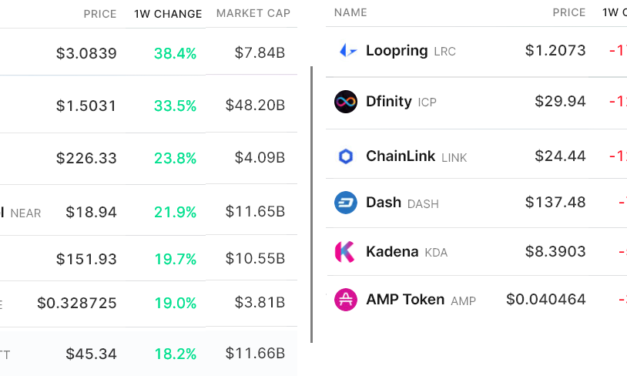
Bitcoin’s (BTC) sudden crash on Jan. 10 caused the price to trade below $40,000 for the first time in 110 days and this was a wake-up call to leveraged traders. $1.9 billion worth of long (buy) futures contracts were liquidated that week, causing the morale among traders to plunge.The crypto “Fear & Greed” index, which ranges from 0 “extreme fear” to 100 “greed” reached 10 on Jan. 10, the lowest level it has been since the Mar. 2020 crash. The indicator measures traders’ sentiment using historical volatility, market momentum, volume, Bitcoin dominance and social media.As usual, the panic turned out to be a buying opportunity because the total crypto market capitalization rose by 13.5%, going from a $1.85 trillion bottom to $2.1 trillion in less than three days. Currently, investors seem to be digesting this week’s economic data that shows United States December 2021 retail sales going down by 1.9% compared to the previous month.Investors have reason to worry about stagflation, a scenario where inflation accelerates despite the lack of economic growth. However, even if this eventually proves that Bitcoin’s digital scarcity is a positive characteristic, markets will still take shelter with whatever asset is deemed safe. Thus, the first wave will potentially be damaging for cryptocurrencies.Top weekly winners and losers on Jan. 17. Source: NomicsBitcoin price was flat over the past seven days, effectively underperforming the altcoin market’s 7% gain. Part of this unusual movement can be explained by layer-1 decentralized applications platforms showing a positive performance that was driven by Fantom (FTM), Cardano (ADA), Near Protocol (NEAR) and Harmony (ONE).Loopring (LRC), a zkRollup open protocol for decentralized exchanges on Ethereum, presented the worst performance of the week. The DEX volume using the protocol peaked at $30 million per day in early December 2021, but is now near $6 million. Meanwhile, Dfinity (ICP) and Chainlink (LINK) are adjusting after a 40% or higher rally in the first 10 days of 2022.Tether’s premium and the futures premium held up wellThe OKEx Tether (USDT) premium or discount measures the difference between China-based peer-to-peer (P2P) trades and the official U.S. dollar. Figures above 100% indicate excessive demand for cryptocurrency investing. On the other hand, a 5% discount usually indicates heavy selling activity.OKEx USDT peer-to-peer premium vs. USD. Source: OKExThe Tether indicator bottomed at a 3% discount on Dec. 31, which is slightly bearish but not alarming. However, this metric has held a decent 2% discount over the past week, signaling no panic selling from China-based traders.To further prove that the crypto market structure has held, traders should analyze the CME’s Bitcoin futures contracts premium. That metric analyzes the difference between longer-term futures contracts to the current spot price in regular markets.Whenever this indicator fades or turns negative, it is an alarming red flag. This situation is also known as backwardation and indicates that bearish sentiment is present.BTC CME 2-month forward contract premium vs. Bitcoin/USD. Source: TradingViewThese fixed-month contracts usually trade at a slight premium, indicating that sellers request more money to withhold settlements for longer. As a result, futures should trade at a 0.5% to 2% premium in healthy markets, a situation known as contango.Notice how the indicator flipped negative on Dec. 9 as Bitcoin traded below $49,000 but it still managed to sustain a slightly positive number. This shows that institutional traders display a lack of confidence, although it is not yet a bearish structure.Considering that the aggregate cryptocurrency market capitalization is down 9.5% to date, the market structure held rather nicely. The CME futures premium would have gone negative if there had been excessive demand for short-sellers. Unless these fundamentals change significantly, there is not yet sufficient information available that would support calls for a sub-$40,000 Bitcoin price.The views and opinions expressed here are solely those of the author and do not necessarily reflect the views of Cointelegraph. Every investment and trading move involves risk. You should conduct your own research when making a decision.

Čítaj viac

Ethereum options data shows pro traders expect strong resistance at $3,600

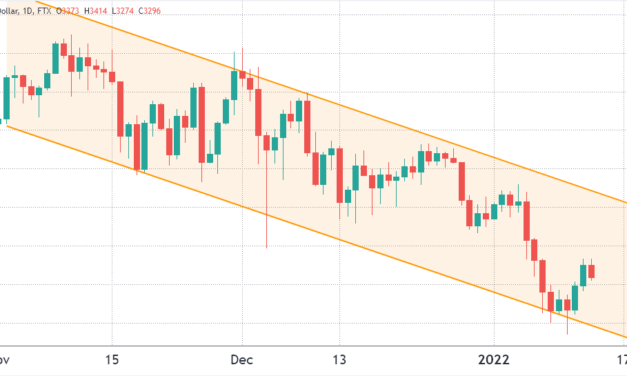
Ether (ETH) price has bounced 13% from its Jan. 9 low at $2,950, but it seems premature to call the move a cycle bottom. Instead, the larger bearish movement has prevailed and although it looks primarily correlated to Bitcoin (BTC) price, regulatory concerns and a tighter United States Federal Reserve policy have also been blamed for the movement.BTC and Ether have been under pressure since regulators focused their attention on stablecoins. On Nov. 1, the U.S. Treasury Department urged Congress to ensure that stablecoin issuers are regulated similarly to U.S. banks. ETH/USD price at FTX. Source: TradingViewCurrently, the descending channel formation initiated in mid-November shows resistance at $3,850 resistance. The average network transaction fees have also risen back above $50 and the longer that the Ethereum 2.0 upgrade takes to occur, the better the situation will be for competing chains.Regardless of the rationale behind Ether’s 28% price drop over the past six weeks, bulls missed the opportunity to secure a $300 million profit in the Jan. 14 weekly options expiry. Unfortunately for them, this $4,500 and higher scenario seems unfeasible at the moment.Ether options aggregate open interest for Jan. 14. Source: Coinglass.comThe call-to-put ratio shows an 89% advantage for bulls because the $380 million call (buy) instruments have a larger open interest versus the $200 million put (sell) options. The current 1.89 measure is deceptive because the recent Ether price drop caused most of the bullish bets to become worthless.For example, if Ether’s price remains below $3,300 at 8:00 am UTC on Jan. 14, only $24 million worth of these call (buy) options will be available, but there is no value in having the right to buy Ether at $3,300 if it is trading below that price.Related: Cointelegraph Consulting – A look at Terra’s ecosystemBears need ETH price below $3,300 to secure a $65 million profitBelow are the three most likely scenarios based on the current price action. The number of option contracts available on Jan. 14 for bulls (call) and bear (put) instruments vary depending on the expiry ETH price. The imbalance favoring each side constitutes the theoretical profit:Between $3,100 and $3,300: 7,400 calls vs. 27,800 puts. The net result favors bears by $65 million.Between $3,300 and $3,500: 22,200 calls vs. 19,300 puts. The net result is balanced between bulls and bears.Above $3,500: 32,500 calls vs. 15,600 puts. The net result is $60 million favoring the call (bull) instruments.This crude estimate considers call options being used in bullish bets and put options exclusively in neutral-to-bearish trades. Even so, this oversimplification disregards more complex investment strategies.For instance, a trader could have sold a put option, effectively gaining a positive exposure to Ether above a specific price. But, unfortunately, there’s no easy way to estimate this effect.Bulls don’t stand a chanceEther bulls would have had a decent $300 million advantage if the price held above $4,500. However, the current scenario requires a 6% positive move from $3,300 to $3,500 to generate a $60 million advantage. Considering there are less than 12 hours until Friday’s options expiry, bulls will likely concentrate their efforts on keeping the price above $3,300 to balance out the scales. The views and opinions expressed here are solely those of the author and do not necessarily reflect the views of Cointelegraph. Every investment and trading move involves risk. You should conduct your own research when making a decision.

Čítaj viac

Získaj BONUS 8 € v Bitcoinoch

nakup bitcoin z karty

Registrácia Binance

Burza Binance

Aktuálne kurzy