
Autor Cointelegraph By Marcel Pechman

Ethereum price holds above $3K but network data suggests bulls may get trapped

When analyzing Ether’s (ETH) price chart, one could conclude that the 3-month long bearish trend has been broken for a few reasons. The current $3,100 price range represents a 43% recovery in 15 days and, more importantly, the descending channel resistance was ruptured on Feb. 7. Should Ether bulls start celebrating and calling for $4,000 and higher? That largely depends on how retail traders are positioned, along with the Ethereum network’s on-chain metrics. For instance, is the $30-plus transaction fee impacting the use of decentralized applications (dApps), or are there any other factors that will prohibit Ether’s price growth?Ether (ETH) price at FTX, in USD. Source: TradingViewSince the 55.6% correction from the $4,870 all-time high to the cycle bottom at $2,160 on Jan. 24, Bitcoin (BTC) has failed to break the $45,500 resistance and traders concluded that a 12% correction was the most likely scenario.On a brighter note, on Feb. 7, Big Four auditor KPMG’s Canadian wing announced the addition of Bitcoin and Ether to its corporate treasury. The decision reflects KPMG Canada’s belief that cryptocurrencies are a “maturing asset class,” according to Benjie Thomas, a managing partner for the firm.Derivatives data tells a different storyTo understand how confident traders are about Ether’s price recovery, one should analyze the perpetual contracts futures data. This instrument is the retail traders’ preferred market because its price tends to track the regular spot markets.In any futures contract trade, longs (buyers) and shorts (sellers) are matched at all times, but their use of leverage varies. Consequently, exchanges will charge a funding rate to whichever side demands more leverage, and this fee is paid to the opposing side.Ether perpetual futures 8-hour funding rate. Source: CoinglassThis indicator will tell us whether retail traders are getting excited, which would cause it to move above 0.05%, equivalent to 1% per week. Notice how the past couple of months showed a slightly negative funding rate, reflecting the bearish sentiment. Currently, there is no sign that retail traders are confident enough to reopen leveraged long positions.One should analyze the Ethereum network’s on-chain data to understand if the lack of confidence is specific to leverage trading. For example, even though there is no set relation between Ether’s price and network use, low transaction volume and a decline in active users could be a concern if decoupled from a price hike.On-chain metrics raise concernMeasuring the monetary value of the ETH transacted on the network provides a reliable indicator of effective use. Of course, this metric could be masqueraded by increasing adoption in layer-2 solutions but it remains a starting point.Sum of native token units transferred per day. Source: CoinMetricsThe current $6.2 billion daily transaction average is a 55% drop from December’s peak and not really far from the 1-year low at $5.6 billion. Thus, it is safe to conclude that Ether token use is not showing signs of growth, at least on the primary layer.Analysts should also check decentralized applications usage metrics. One must remember that the Total Value Locked (TVL) is heavily concentrated on lending platforms and decentralized exchanges (DEX). Consequently, gauging the number of active addresses provides a broader view.Ethereum network 30-day dApps activity. Source: DappRadarApart from the non-fungible token (NFT) marketplace Opensea, Ethereum dApps saw a monthly 28% decrease in the number of active addresses. In a nutshell, that is disappointing usage data because the smart contract network was specifically designed to host decentralized applications.Unless there’s an uptick in Ether transactions and dApps usage metrics, investors will interpret any Ether price move above $3,000 as a potential bull trap. As for retail traders’ neutral funding rate, it might as well be a bullish sign that the investor class typically enters long leverage positions after a strong rally.The views and opinions expressed here are solely those of the author and do not necessarily reflect the views of Cointelegraph. Every investment and trading move involves risk. You should conduct your own research when making a decision.

Čítaj viac
Crypto derivatives data signals improving investor sentiment and a possible trend reversal

This week the total crypto market capitalization rallied 10% to $1.68 trillion, which is a 25% recovery from the Jan. 24 bottom. It’s too early to suggest that the market has found a bottom but two key indicators — The Tether/CNY premium and CME futures basis — have recently flipped bullish, signaling that positive investor sentiment is backing the current price recovery.Total crypto market cap excluding stablecoins, in USD billion. Source: TradingViewTraders should not assume that the bear trend has ended by merely looking at price charts. For example, between Dec. 13 and Dec. 27, the sector’s total market capitalization bounced from a $1.9 trillion low to $2.33 trillion. Yet, the 22.9% recovery was completely erased within nine days as crypto markets tanked on Jan. 5.Bearish data suggests the Fed has less room for rate hikesEven with the current trend change, bears have reason to believe that the 3-month long descending channel formation has not been broken. For example, the Feb.4 rally could have reflected the recent negative macroeconomic data, including EuroZone retail sales 2% yearly growth in December, which was well below the 5.1% market expectation.Independent market analyst Lyn Alden recently suggested that the United States Federal Reserve could postpone interest rate hikes after disappointing U.S. employment data was released on Feb. 2. The ADP Research Institute also showed a contraction of 301,000 private-sector jobs in December, which is the worst figure since March 2020.Regardless of the reason for Bitcoin (BTC) and Ether (ETH) gaining 10% on Friday, the Tether (USDT) premium at OKX reached its highest level in four months. The indicator compares China-based peer-to-peer (P2P) trades and the official U.S. dollar currency. Peer-to-peer CNY/USDT vs. CNY/USD. Source: OKXExcessive cryptocurrency demand tends to pressure the indicator above fair value, or 100%. On the other hand, bearish markets tend to flood Tether’s market, causing a 4% or higher discount. Therefore, Friday’s pump had a significant impact on China-driven crypto markets.CME futures traders are no longer bearishTo further prove that the crypto market structure has improved, traders should analyze the CME’s Bitcoin futures contracts premium. The metric compares longer-term futures contracts and the traditional spot market price.It is an alarming red flag whenever that indicator fades or turns negative (backwardation) because it indicates that bearish sentiment is present.These fixed-calendar contracts usually trade at a slight premium, indicating that sellers are requesting more money to withhold settlement for longer. As a result, the 1-month futures should trade at a 0.5% to 1% annualized premium in healthy markets, a situation known as contango.BTC CME 1-month forward contract premium vs. Coinbase/USD. Source: TradingViewThe chart above shows how the indicator entered backwardation levels on Jan. 4 as Bitcoin moved below $46,000 and Friday’s move marks the first sentiment trend reversal in a month. Data shows that institutional traders remain below the “neutral” threshold as measured by the futures’ basis, but at least reject the bearish market structure formation. While the CNY/Tether premium might have shown a trend shift, the CME premium reminds us that there’s a lot of distrust in Bitcoin’s capacity to function as an inflationary hedge. Still, the lack of CME traders’ excitement could be exactly what BTC needs to further fuel the rally if the $42,000 resistance is broken over the weekend.The views and opinions expressed here are solely those of the author and do not necessarily reflect the views of Cointelegraph. Every investment and trading move involves risk. You should conduct your own research when making a decision.

Čítaj viac
This bullish Ethereum options trade targets $3.1K ETH price with zero liquidation risk

Ether price (ETH) spent the last two months stuck in a rut and even the most bullish trader will admit that the possibility of trading above $4,400 in the next couple of months is dim. Of course, cryptocurrency traders are notoriously optimistic and it is not unusual for them to expect another $4,870 all-time high, but this seems like an unrealistic outcome.Despite the current bearish trend, there are still reasons to be moderately bullish for the next couple of months and using a “long condor with call options” strategy might yield a positive outcome.Options strategies allows the investor to set upside limitsOptions markets provide more flexibility to develop custom strategies and there are two instruments available. The call option gives the buyer upside price protection, and the protective put option does the opposite. Traders can also sell the derivatives to create unlimited negative exposure, similar to a futures contract.Ether options strategy returns. Source: Deribit Position BuilderThis long condor strategy has been set for the March 25 expiry and uses a slightly bullish range. The same structure can also be applied for bearish expectations, but this scenario assumes that most traders are looking for upside.Ether was trading at $2,677 when the pricing took place, but a similar result can be achieved starting from any price level.The first trade requires buying 5.14 ETH worth of $3,000 call options to create a positive exposure above this price level. Then, to limit gains above $3,500 the trader needs to sell 4.4 ETH contracts of the $3,500 call.To complete the strategy, the trader needs to sell 6.65 ETH contracts of the $4,000 call, limiting the gains above such a price level. Lastly, a $4,500 upside protection call for 5.91 ETH is needed to limit the losses if Ether unexpectedly skyrockets.The strategy aims for a healthy 3.2 to 1 profit to loss ratioThe strategy might sound complicated to execute, but the margin required is only 0.175 ETH, which is also the max loss. The potential net profit happens if Ether trades between $3,100 (up 15%) and $4,370 (up 63%).Traders should remember that it is also possible to close the position ahead of the March 25 expiry. In this strategy, the maximum gain occurs between $3,500 and $4,000 at 0.56 Ether, which is more than three times higher than the potential loss.Unlike futures trading, this strategy gives the holder peace of mind because there is no liquidation risk. It is also worth noting that most derivatives exchanges accept orders as low as 0.10 ETH contracts, meaning a trader could build the same strategy using a smaller amount.The views and opinions expressed here are solely those of the author and do not necessarily reflect the views of Cointelegraph. Every investment and trading move involves risk. You should conduct your own research when making a decision.

Čítaj viac

Bitcoin bulls may ignore Friday’s $730M options expiry by saving their energy for $40K

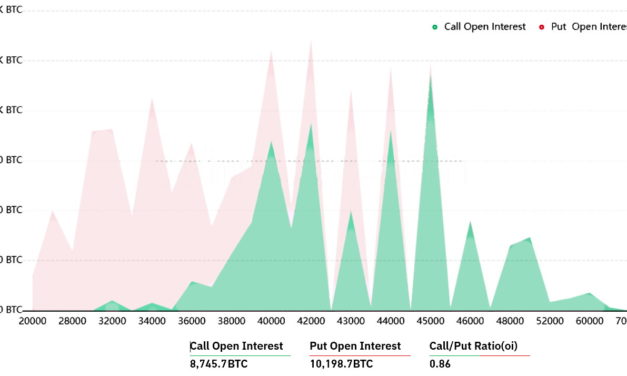
The past few months have been less than pleasant for Bitcoin (BTC) bulls, but they are not alone. Persistent comments from the United States Federal Reserve hint at plans to raise interest rates in 2022 and thi is causing investors to seek protection in inflation-protected bonds.The monetary authority signaled its intention to substantially raise the benchmark interest rate and they will also gradually reduce the monthly purchase of debt assets.Even though some crypto investors deem Bitcoin digital scarcity as inflationary protection, that does not change its volatility. In turn, it causes the asset price to move in tandem with risk markets.Bitcoin price at Coinbase, USD (right) vs. Russell 2000 index (left)The above chart shows Bitcoin price in blue stacked against the smaller U.S. listed companies, as measured by the Russell 2000 equity markets index. Unlike the S&P 500 or Dow Jones Industrial Index, this benchmark excludes those tech giants. Thus, the smaller companies are usually considered riskier and are more impacted when investors fear an economic downturn.However, the negative performance did not scare investors as the Canada-based Purpose Bitcoin ETF attracted over $38 million worth of Bitcoin this Tuesday, its third-largest daily inflow to date. The fund now holds 31,032 BTC, equivalent to $1.2 billion.Regardless of investors’ sentiment, Bitcoin bulls could face a $120 million loss if BTC price moves below $36,000 on Friday’s options expiry.$730 million in options expire on Feb. 4According to Friday’s options expiry open interest, Bitcoin bulls placed heavy bets between $40,000 and $44,000. These levels might seem optimistic right now, but Bitcoin was trading above $42,000 two weeks ago.Bitcoin options aggregate open interest for Feb. 4. Source: Coinglass.comAt first sight, the $430 million call (buy) options dominate the $300 million put (sell) instruments, but the 1.43 call-to-put ratio does not really tell the whole story. For example, the 14% price drop over the past two weeks wiped out most bullish bets.A call option gives the buyer a right to buy BTC at a fixed price at 8:00 am UTC on Feb. 4. However, if the market is trading below that price, there is no value in holding that derivative contract, so its value goes to zero.Therefore, if Bitcoin remains below $37,000 at 8:00 am UTC on Feb. 4, only $34 million of those call (buy) options will be available at the expiry.Bears will fight to keep Bitcoin below $37,000Here are the three most likely scenarios for Friday’s options expiry. The imbalance favoring each side represents the theoretical profit. In other words, depending on the expiry price, the active quantity of call (buy) and put (sell) contracts varies:Between $35,000 and $37,000: 950 calls vs. 4,210 puts. The net result is $120 million favoring the put (bear) instruments.Between $37,000 and $38,000: 1,650 calls vs. 3,300 puts. The net result favors bear instruments by $60 million.Between $38,000 and $39,000: 4,230 calls vs. 1,710 puts. The net result is balanced between call and put options.This crude estimate considers call options used in bullish bets and put options exclusively in neutral-to-bearish trades. However, this oversimplification disregards more complex investment strategies.Bulls need $38,000 to balance the scalesA mere 3% price pump from the current $36,900 level is enough for Bitcoin bulls to avoid a $120 million loss on the Feb. 4 options expiry. Still, the same rationale applies to Bitcoin bears because pinning BTC below $37,000 can easily cause them to secure a $120 million profit.Considering the short-term negative sentiment caused by tighter macroeconomic conditions, Bitcoin bulls should pace their energy for a sustainable recovery to $40,000 and higher instead of wasting efforts right now. Therefore, options markets data slightly favor the put (sell) options.The views and opinions expressed here are solely those of the author and do not necessarily reflect the views of Cointelegraph. Every investment and trading move involves risk. You should conduct your own research when making a decision.

Čítaj viac

Bitcoin price closes in on $40K, but pro traders are still skeptical

The Bitcoin (BTC) daily price chart seems to be making a steady recovery pattern, but some concerning indicators are coming from derivatives markets. At the moment, the futures and options markets are showing a lack of confidence from Bitcoin pro traders, but there’s a positive spin to the data.Bitcoin price at Coinbase, USD. Source: TradingViewThe road to $40,000 seems uncomfortably predictable, and cryptocurrency traders usually call it “manipulation” when such price movements happen.If you #bitcoin around that region, just be careful.A picture speaks a thousands words and I think mine says it all.Make it or break it time around the corner for #btc. This weekend is weekly close & monthly close as well so expect volatility and manipulation.#Crypto pic.twitter.com/kPhDKAjupQ— @Maze (Will never DM 1st or Follow) (@_CryptoMaze_) January 28, 2022Regardless of the rationale behind Bitcoin’s price recovery, investors should analyze derivatives markets to understand how whales, market makers and arbitrage desks are positioned. While retail traders’ favorite instrument is the perpetual contract (inverse swaps), pro traders often opt for fixed-calendar futures and options. Although they are more complicated to trade, these derivatives offer more complex strategies.Liquidations are behind us, but so is the route to $69,000Data shows that there hasn’t been a relevant futures contract liquidation since Jan. 23. When leverage long (buyers) have their positions terminated, it accelerates the price correction, because derivatives exchanges need to sell those futures at market prices. Total crypto futures liquidations, USD. Source: CoinglassNotice how the last “big” forced position termination on longs was $290 million on Jan. 23. This partially explains why Bitcoin’s recovery was relatively tranquil over the past week. Still, the market is nowhere near being out of the water, considering that BTC is currently trading 44% below the $69,000 all-time high.Bitcoin 3-month futures annualized premium. Source: Laevitas.chThe Bitcoin futures annualized premium should run between 5% to 12% to compensate traders for “locking in” the money for two to three months until the contract expiry. Levels below 5% are extremely bearish, while the numbers above 12% indicate bullishness. The above chart shows that this metric dipped below 5% on Jan. 21 and hasn’t yet shown signs of confidence from pro traders. So the big question is: Is the glass half full? For example, if Bitcoin breaks the $42,000 resistance, some traders will likely be caught off guard, so there’s additional buying activity because no one wants to be left behind. Bitcoin futures markets are neutral, but options traders are skepticalCurrently, it’s a bit difficult to discern a direction in the market, but the 25% delta skew is a telling sign whenever arbitrage desks and market makers overcharge for upside or downside protection. If traders fear a Bitcoin price crash, the skew indicator will move above 10%. On the other hand, generalized excitement reflects a negative 10% skew. Bitcoin 30-day options 25% delta skew: Source: Laevitas.chAs displayed above, we’ve been near 10% for almost a week despite the 18% BTC price recovery since the $33,000 bottom. The options skew data shows that pro traders are still pricing higher odds for a market crash. Despite the not-so-positive indicator from Bitcoin options, these arbitrage desks and market makers will be forced to reverse bearish positions once the price breaks $42,000. However, considering that the futures premium did not show signs of desperation even as the market crashed 52% from the all-time high, the data provides a constructive view.The views and opinions expressed here are solely those of the author and do not necessarily reflect the views of Cointelegraph. Every investment and trading move involves risk. You should conduct your own research when making a decision.

Čítaj viac

Získaj BONUS 8 € v Bitcoinoch

nakup bitcoin z karty

Registrácia Binance

Burza Binance

Aktuálne kurzy