
Autor Cointelegraph By Marcel Pechman

Ethereum futures premium hits a 7-month low as ETH tests the $2,400 support

Ether (ETH) reached a $3,280 local high on Feb. 10, marking a 51.5% recovery from the $2,160 cycle low on Jan. 24. That price was the lowest in six months, and it partially explains why derivatives traders’ main sentiment gauge plummeted to bearish levels.Ether’s futures contract annualized premium, or basis, reached 2.5% on Feb. 25, reflecting bearishness despite the 11% rally to $2,700. The worsening conditions depict investors’ doubts regarding the Ethereum network’s shift to a proof-of-stake (PoS) mechanism.As reported by Cointelegraph, the much-anticipated sharding upgrade that will significantly boost processing capacity should come into effect in late 2022 or early 2023. Analyzing Ether’s performance from a longer-term perspective provides a more appealing sentiment, as the cryptocurrency is currently 45% below its $4,870 all-time high.Furthermore, the Ethereum network’s adjusted total value locked (TVL) has held a reasonable 42.8 million ETH despite the price correction.Ethereum network total value locked, in ETH. Source: DefiLlamaAs shown above, the network’s TVL increased by 16.5% in three months, reflecting growth from decentralized finance (DeFi) and nonfungible token (NFT) marketplaces.However, due to network upgrade delays and worsening global macro conditions, professional traders are becoming frustrated and anxious, a sentiment that is depicted in multiple derivatives metrics.Ether futures hit their most bearish level in seven monthsRetail traders usually avoid quarterly futures due to their fixed settlement date and price difference from spot markets. However, the contracts’ biggest advantage is the lack of a fluctuating funding rate, hence the prevalence of arbitrage desks and professional traders.These fixed-month contracts usually trade at a slight premium to spot markets because sellers are requesting more money to withhold settlement longer. This situation is known technically as “contango” and is not exclusive to crypto markets.Ether futures 3-month annualized premium. Source: LaevitasFutures should trade at a 5%–15% annualized premium in healthy markets. Yet, as displayed above, Ether’s annualized premium has decreased from 20% on Oct. 21 to a meager 2.5%.Although the basis indicator remains positive, it has reached the lowest level in seven months. The crash to $2,300 on Feb. 24 caused bearish sentiment to prevail, and not even Feb. 25’s 10% recovery was enough to flip the tables.Currently, data shows few signs that bulls are ready to regain control. If this were the case, the Ether futures premium would have turned positive after such a rally.The views and opinions expressed here are solely those of the author and do not necessarily reflect the views of Cointelegraph. Every investment and trading move involves risk. You should conduct your own research when making a decision.

Čítaj viac
Bitcoin traders say $34K was the bottom, but data says it’s too early to tell

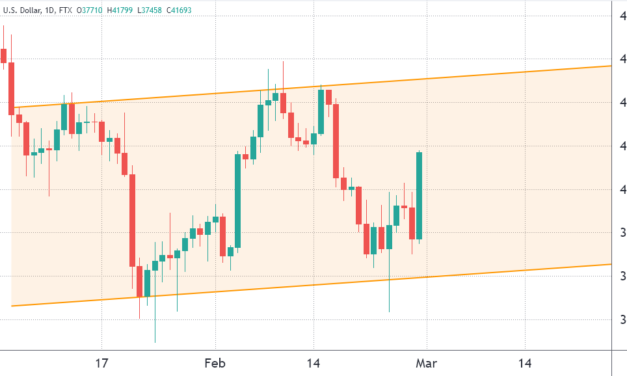
Bitcoin (BTC) price traded down 23% in the eight days following its failure to break the $45,000 resistance on Feb. 16. The $34,300 bottom on Feb. 24 happened right after the Russian-Ukraine conflict escalated, triggering a sharp sell-off in risk assets.While Bitcoin reached its lowest level in 30 days, Asian stocks were also adjusting to the worsening conditions, a fact evidenced by Hong Kong’s Hang Seng index dropping 3.5% and the Nikkei also reached a 15-month low.Bitcoin/USD at FTX. Source: TradingViewThe first question one needs to answer is whether cryptocurrencies are overreacting compared to other risk assets. Sure enough, Bitcoin’s volatility is much higher than traditional markets, running at 62% per year.As a comparison, the United States small and mid-cap stock market index Russell 2000 holds a 30% annualized volatility. Meanwhile, as measured by the MSCI China index, Chinese equities stand at 32%.Bitcoin/USD (purple, left scale) vs. Hang Seng Index (blue) & Russell 2000 (orange)There is a high correlation between Bitcoin, the Hang Seng stock market and the U.S. Russell 2000 Index. A possible explanation is the U.S. Federal Reserve’s tightening objectives. By reducing bond buybacks and threatening to increase the interest rates, the monetary authority has caused a “flight to safety” movement.Despite the non-existent returns adjusted by the 7.5% inflation, investors often seek protection on cash U.S. dollar positions and Treasury ills. This is especially true during periods of extreme uncertainty.Bitcoin futures traders are moderately bearishTo understand how professional traders are positioned, one should monitor Bitcoin derivatives. The Bitcoin futures’ annualized premium should run between 5% to 12% to compensate traders for “locking in” the money for two to three months until the contract expiry. Bitcoin 3-month futures premium. Source: LaevitasLevels below 5% are extremely bearish, while an annualized premium above 12% indicates bullishness. As shown above, the futures premium dropped below 5% on Feb. 9, displaying a lack of confidence from professional traders. Although the current 2.5% represents the lowest level since July 20, this date marked a reversal from a 74-day price correction. In fact, a 71% rally followed that event, confirming the thesis that the futures premium is a backward-looking indicator.Bitcoin/USD (blue) and 30-day correlation vs. Russell 2000 (purple). Source: TradingViewNotice how Bitcoin’s correlation versus the Russell 2000 Index was relatively high on July 20. However, that situation quickly reversed as BTC initiated its rally, independent from traditional markets.The bottom could be in, but uncertainty could lead to further downsideSimilar to the futures premium, the correlation metric uses historical data, so it should not be used to predict trend reversals. Investors, particularly professional fund managers, tend to avoid high volatile assets during turbulent markets.Understanding market psychology is essential for avoiding unexpected price swings. Therefore, as long as Bitcoin remains considered a risky asset by market participants, these short-term corrections should be the norm rather than the exception.Therefore, it makes sense to wait for further decoupling signs before predicting a Bitcoin bottom. The views and opinions expressed here are solely those of the author and do not necessarily reflect the views of Cointelegraph. Every investment and trading move involves risk. You should conduct your own research when making a decision.

Čítaj viac
2 key indicators cast doubt on the strength of the current crypto market recovery

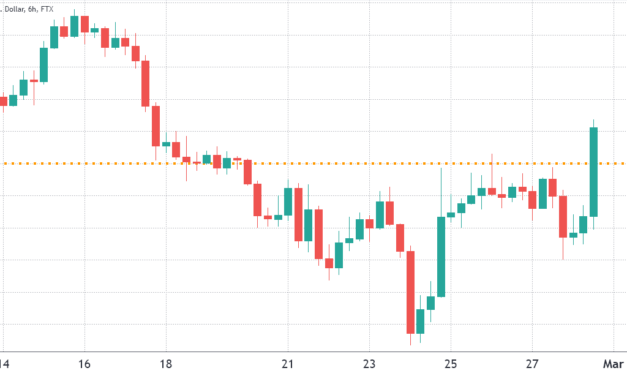
Analyzing the aggregate cryptocurrency market performance over the past 7 days could give investors the impression that the total market capitalization grew by a mere 4% to $2.03 trillion, but this data is heavily impacted by the top 5 coins, which happen to include two stablecoins.Excluding Bitcoin (BTC), Ether (ETH), Binance Coin (BNB) and stablecoins reflects a 9.3% market capitalization increase to $418 billion from $382 billion on Feb 4. This explains why so many of the top-80 altcoins hiked 25% or more while very few presented a negative performance.Winners and losers among the top-80 coins. Source: NomicsGala Games (GALA) announced on Feb. 9 a partnership with world renowned hip-hop star Snoop Dogg to launch his new album and exclusive non-fungible token (NFT) campaign. Gala Games also has plans to support additional content like access to films, comics, and more in the future.Theta Network (THETA), a decentralized video sharing platform, was fueled by a Theta Labs funding grant to Replay, a Web3 content payment and tracking protocol for content owners. According to the release, Replay’s end-to-end solution will allow Theta users to be fairly rewarded for their contributions. XRP also rallied after Ripple got permission for a ‘fair notice defense’ to the U.S. Securities and Exchange Commission (SEC). The decision refers to the ongoing court case in which the SEC claimed that Ripple sold XRP as illegal securities.On the other hand, the worst performers included decentralized storage protocols Arweave (AR) and Dfinity (ICP). Meanwhile, Cosmos (ATOM) saw the total value locked in the CosmosHub smart contract drop by 82% to $1.2 million. Lastly, Solana (SOL) continued to reflect the negative sentiment directly connected to the Wormhole token bridge smart contract that was exploited on Feb. 2. The $321 million wrapped Ethereum hack was the largest loss so far in 2022.Tether premium reflects low retail demandThe OKEx Tether (USDT) premium measures the difference between China-based peer-to-peer (P2P) trades and the official U.S. dollar currency. Excessive cryptocurrency retail demand tends to pressure the indicator above fair value, or 100%. On the other hand, bearish markets likely flood Tether’s market offer, causing a 4% or higher discount.Tether (USDT) peer-to-peer vs. USD/CNY. Source: OKXCurrently, the metric has a 99.5% reading, which is neutral, but the gap has been closing over the past 6 weeks. This signals that retail demand is picking up and is a positive reading considering that the total cryptocurrency capitalization remains 35% below the $3 trillion all-time high.Futures markets confirm the lack of “euphoria”Perpetual contracts, also known as inverse swaps, have an embedded rate usually charged every eight hours. Those measures are established to avoid exchange risk imbalances. A positive funding rate indicates that longs (buyers) demand more leverage. However, the opposite situation occurs when shorts (sellers) require additional leverage, and this causes the funding rate to turn negative.Perpetual futures 8-hour funding rate on Feb. 11. Source: CoinglassAs depicted above, the eight-hour fee is either zero or slightly negative in most cases. This data indicates a balanced leverage demand from longs (buyers) and shorts (sellers). Had there been a relevant risk appetite from either side, the rate would be above 0.05%, equivalent to 1% per week.Perpetual futures are retail traders’ preferred derivatives because its price tends to track the regular spot markets. The Tether premium and the funding rate are neutral-to-bearish despite the 4% weekly gain, but one should factor in that cryptocurrencies have recently faced a 50% drawdown, meaning these indicators are somewhat skewed.The views and opinions expressed here are solely those of the author and do not necessarily reflect the views of Cointelegraph. Every investment and trading move involves risk. You should conduct your own research when making a decision.

Čítaj viac
Here’s why Bitcoin traders shouldn’t overanalyze US inflation data

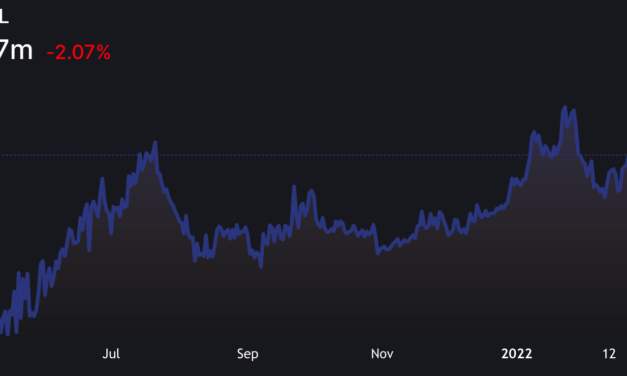
Analysts and pundits will scramble to find some angle to explain intra-day price action whenever important economic numbers are published and this practice is commonplace in the crypto sector. When the United States Bureau of Labor Statistics reported a 7.5% increase in the Consumer Price Index (CPI) on Feb. 10, traders rushed to find some connection to the crypto price action. However, historical correlation data shows investors should actually closely scrutinize whether there is even a relation between Bitcoin (BTC) and major economic indicators. General investment advice would suggest that traders ignore the intraday movements, especially considering that most assets do not trade on a 24-hours basis. More importantly, Bitcoin’s order book depth pales in comparison to gold, WTI and the S&P 500 futures. Even if one aggregates stablecoin trading, Bitcoin’s 7-day average volume is $7 billion, whereas the three largest S&P 500 exchange-traded funds handle $54 billion.In short, a large order flow from a single entity could easily distort the cryptocurrency market in the short term, but the impact on WTI oil, the S&P 500 and gold tends to be smaller.Does Bitcoin price anticipate inflation data?Bitcoin price dipped to $43,200 after the 7.5% increase in the U.S. consumer price index was released on Feb. 10, leading reporters at CNBC to correlate the two events.Bitcoin dips slightly as 10-year Treasury yield tops 2% on hotter-than-expected inflation report https://t.co/bI8NzMQRPD— CNBC (@CNBC) February 10, 2022That statement correctly assessed the market conditions at that time, but one should use a longer time frame when analyzing economic data. Furthermore, there’s the possibility that Bitcoin holds no relevant price correlation, a hypothesis that also needs testing.A comparative long-term chart between Bitcoin price and U.S. inflation gives a false impression of correlation and causation, especially when using logarithmic charts.U.S. CPI (orange, left) vs. Bitcoin/USD (blue, right). Source: TradingViewIf anything, Bitcoin has anticipated the economic data by roughly three months. In September 2020, it rallied above $11,000 while the inflation data stagnated below 1.5% and more recently in May 2021. Afterward, the Bitcoin price “cooled off,” failing to break the $60,000 support while the sharp increase in CPI paused two months later in July at 5.4%.For those relying on mathematical formulas, the correlation coefficient between Bitcoin price and U.S. inflation oscillated between positive 0.95 and negative 0.94 over the past 12 months. Therefore, associating one to another makes very little sense from a statistical approach.Related: Analysts say Bitcoin’s range-bound trading at a key support level reflects a trend reversalDo traditional markets really show correlation with Bitcoin?Another common mistake is attributing the correlation of other assets to Bitcoin’s performance. Sure enough, there might be a couple of consecutive months of 0.65 (positive or negative) correlation over a year-long period, but data suggests otherwise.Bitcoin, S&P500, WTI Oil, and TIP ETF 30-day correlation charts. Source: TradingViewFor instance, between August and September 2021, the S&P 500 correlation to BTC averaged 0.65. However, that is cherry-picking data because a more extended timeframe reveals no such evidence.No price relation was found between Bitcoin and other major assets such as the WTI oil price and the iShares TIPS Bond ETF, which tracks an index composed of inflation-protected U.S. Treasury bonds.Various data points suggest that investors should ignore the intraday price action after economic data is released, because at times, the data provides a false impression between correlation and causation.Although inflation or other data influence short-term pricing, it does not necessarily impact the prevailing trend. The correlation chart versus traditional markets leaves little doubt that Bitcoin is a class of its own.The views and opinions expressed here are solely those of the author and do not necessarily reflect the views of Cointelegraph. Every investment and trading move involves risk. You should conduct your own research when making a decision.

Čítaj viac

Strong Bitcoin and stocks rally position bulls for victory in Friday’s $860M options expiry

Bitcoin (BTC) bulls have good reason to celebrate the 22% gain in the past week. The price is pushing toward $46,000 and to the surprise of many, the $43,000 level held steady despite the volatility caused by the United States inflation data released on Feb.10.There have been mixed feelings on the macroeconomic side. For example, retail sales in the Eurozone disappointed on Feb. 4 when the figure showed a 2.0% year-on-year growth versus the 5.1% expectation. while the United States nonfarm payroll abruptly showed a 467,000 jobs increase.Investors are clearly increasingly concerned about corporate earnings despite the stronger than expected China and U.S. economic growth. In the past few weeks some big names took a hit, including Meta (FB), Delivery Hero (DHER-DE), and Paypal (PYPL).Today’s 7.5% yearly U.S. consumer price index growth will likely reinforce the Federal Reserve’s expectations of at least two interest rate hikes throughout 2022 and not many investors can seek protection in treasuries because the 5-year Treasury yield currently stands at 1.9%.Bitcoin is still a risky asset, but its price is discountedConsidering that the S&P 500 is only 5% shy of its all-time high, Bitcoin’s recent strength should not come as a surprise. Curiously, put (sell) option instruments dominate the Feb. 11 options expiry, but bears were caught by surprise after Bitcoin price stabilized above $43,000 this week.Bitcoin options aggregate open interest for Feb. 11. Source: CoinGlassA broader view using the call-to-put ratio shows a 14% advantage to Bitcoin bears because the $400 million call (buy) instruments have a smaller open interest versus the $460 million put (sell) options. However, the 0.86 call-to-put indicator is deceptive because most bearish bets will become worthless.For example, if Bitcoin’s price remains above $44,000 at 8:00 am UTC on Feb. 11, only $55 million worth of those put (sell) options will be available. That effect happens because there is no value in the right to sell Bitcoin at $40,000 if it’s trading above that level.Bulls are aiming for a $300 million profitBelow are the three most likely scenarios based on the current price action. The number of options contracts available on Feb. 11 for bulls (call) and bear (put) instruments varies depending on the expiry price. The imbalance favoring each side constitutes the theoretical profit:Between $42,000 and $44,000: 4,550 calls vs. 1,750 puts. The net result is $120 million favoring the call (bull) instruments.Between $44,000 and $46,000: 6,380 calls vs. 860 puts. The net result favors bulls by $250 million.Between $46,000 and $48,000: 7,860 calls vs. 50 puts. The net result favors the call (bull) instruments by $350 million.This crude estimate considers the call options used in bullish bets and the put options exclusively in neutral-to-bearish trades. Even so, this oversimplification disregards more complex investment strategies.For instance, a trader could have sold a call option, effectively gaining a negative exposure to Bitcoin above a specific price. But unfortunately, there’s no easy way to estimate this effect.Related: Exchange stablecoin reserve hits $27B as Bitcoin rises toward $50K ‘fair value’Bears best case scenario remains unkindBitcoin bulls need a small pump above $46,000 to score a $350 million profit on Feb. 11. On the other hand, bears’ best case scenario requires a 4% price drop from the current $45,600 to reduce their loss to $120 million.Bitcoin bears currently have no reason to add short positions, considering the recent weak corporate data numbers. Therefore, bulls should continue to display strength by pushing the price to $46,000 or higher during Friday’s options expiry. A $350 million profit might be just what’s needed for bulls to regain confidence and re-open long leverage futures, causing further upward pressure.The views and opinions expressed here are solely those of the author and do not necessarily reflect the views of Cointelegraph. Every investment and trading move involves risk. You should conduct your own research when making a decision.

Čítaj viac

Získaj BONUS 8 € v Bitcoinoch

nakup bitcoin z karty

Registrácia Binance

Burza Binance

Aktuálne kurzy