
Autor Cointelegraph By Marcel Pechman

Bitcoin bulls aim to capture $45K leading into Friday’s $890M BTC options expiry

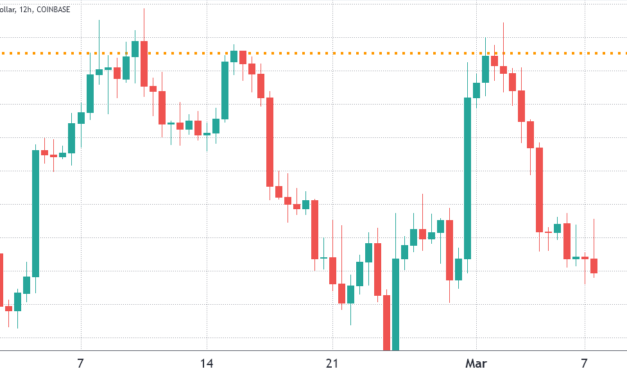
Bitcoin (BTC) bulls flipped the table on March 4’s options expiry after a 14% rally on Feb. 28. Holding the price above $43,000 confirms a decoupling from traditional markets. For instance, the MSCI Emerging Markets Equities Index is down by 3.5% in five days, while the United States Russell 2000 Small-Capitalization Index gained 0.9%. Investors are increasingly concerned about the ramifications of the U.S. Federal Reserve rate hikes expected throughout 2022. As a result, in the past 30 days, some big names took a hit. For instance, Paypal PYPL traded down 38%, META corrected 34% and Shopify SHOP lost 31.5%.The 40-year high U.S. Consumer Price Index 7.5% inflation data caused investors to take profits on riskier assets and the U.S. Dollar Index (DXY) to reach its highest level in 20 months at 97.6. The DXY measures the dollar’s strength against a basket of top foreign currencies and increases when traders seek shelter in the North-American money.Bitcoin is high risk, but its price looks discountedBitcoin’s recent strength surprised most investors as its correlation versus the Nasdaq Composite index reached 73% on Feb. 20, nearing the 74% five-year high in 2020.Call (buy) and put (sell) option instruments are evenly matched for the March 4 options expiry but bears were caught by surprise after the Bitcoin price stabilized above $43,000 this week.Bitcoin options aggregate open interest for March 4. Source: CoinGlassA broader view using the call-to-put ratio shows a balance between the $450 million call (buy) open interest versus the $440 million put (sell) options. However, the 1.02 call-to-put indicator is deceptive because most bearish bets will become worthless.For example, if Bitcoin’s price remains above $43,000 at 8:00 am UTC on Feb. 11, only $155 million worth of those put (sell) options will be available. This difference happens because there is no use in a right to sell Bitcoin at $40,000 if it trades above that level on expiry.Bulls might pocket a $320 million profitBelow are the three most likely scenarios based on the current price action. The number of options contracts available on March 4 for bulls (call) and bear (put) instruments varies depending on the expiry price. The imbalance favoring each side constitutes the theoretical profit:Between $42,000 and $44,000: 560 calls vs. 150 puts. The net result is $175 million favoring the call (bull) instruments.Between $44,000 and $46,000: 760 calls vs. 40 puts. The net result favors bulls by $320 million.Between $46,000 and $47,000: 840 calls vs. 5 puts. Bulls boost their gains to $380 million.This crude estimate considers the put options used in bearish bets and the call options exclusively in neutral-to-bullish trades. Even so, this oversimplification disregards more complex investment strategies.For instance, a trader could have sold a put option, effectively gaining a positive exposure to Bitcoin above a specific price. But, unfortunately, there’s no easy way to estimate this effect.Related: Bitcoin a ‘good bet’ if Fed continues easing to avoid a recession — AnalystBears are likely to throw in the towelBitcoin bulls need a 1% pump above $44,000 to score a $250 million profit on March 3. On the other hand, bears’ best case scenario requires a 4.5% price drop from the current $44,800 to cut their loss down to $110 million.Bitcoin bears recently had $300 million leverage short positions liquidated, so it’s unlikely that they will have the backing required to pressure BTC price in the short term. With this said, bulls will probably continue to display strength by pushing the price to $45,000 or higher during March 4 options expiry.The views and opinions expressed here are solely those of the author and do not necessarily reflect the views of Cointelegraph. Every investment and trading move involves risk. You should conduct your own research when making a decision.

Čítaj viac

$45,000 Bitcoin looks cheap when compared to gold’s marketcap

Bitcoin (BTC) pulled off an impressive double-digit rally this year, but the digital asset has been struggling to break the $45,000 resistance lately. This level does not hold any historical importance because it has been easily breached multiple times. The same can be said for Bitcoin’s $850 billion capitalization, which isn’t anywhere close to silver’s $1.4 trillion, or the Amazon and Google’s $1.7 trillion market value.Bitcoin’s market cap is often compared to gold, which has a $12.3 trillion total value and is currently the leading global store of value solution. Therefore, the answer to the $45,000 resistance might lay in institutional investors’ comparison of BTC versus gold. By looking at institutional investor funds assets under management and daily trading volume, it is possible to infer that Bitcoin’s 93% market capitalization discount is justified.The “digital gold” thesis is being proven rightGold has always been viewed as a proxy for Bitcoin and Cointelegraph previously covered Bitcoin’s multiple use cases, but the narrative that it is a digital store of value has always been its flagship feature. Governments around the globe have implemented tighter financial controls for many reasons, which could reinforce the self-sovereign and decentralized advantages of cryptocurrency. For example, China’s social credit system places offenders on a social credit blocklist, which will stop them from securing loans or even using the transportation system.Most recently, Canada’s short-lived Emergencies Act gave financial institutions the discretionary power to freeze protesters’ bank accounts with no civil liabilities on Feb. 15. Another example is this week Russians have been sanctioned from payment services like Apple Pay and Google Pay.These events could make an analysis of the gold to Bitcoin market capitalization even more relevant.Most valuable tradable global assets. Source: 8marketcap.comAccording to the above data, BTC’s current $837 million market capitalization translates to roughly 7% of gold. To assess how those markets are valued, one should compare their daily traded volume and institutional holdings.Cryptocurrencies are known for inflated exchange-traded numbers, but some providers, including Nomics, have their own adjusted volume calculations.Accumulated 30-day volume on March 2, USD. Source: NomicsThe above data shows a $404 billion 30-day exchange volume for Bitcoin, which is equivalent to $13.5 billion per day. Exchange-traded products such as the Grayscale Bitcoin Fund (GBTC) added another $0.4 billion daily liquidity, according to CryptoCompare’s February 2022 report. Therefore, Bitcoin currently presents an aggregate $13.9 billion average daily volume.Average daily trading volumes, USD billion. Source: gold.orgMeanwhile, according to GoldHub, there is $170 billion in daily liquidity for gold, including registered over-the-counter transactions. This is in addition to regulated futures markets and gold exchange-traded products. Thus, Bitcoin volume currently presents roughly 8% of gold’s.The gold ETF versus Bitcoin exchange-traded productsBitcoin’s multiple exchange-traded products such as Grayscale GBTC and exchange-traded notes have grown considerably. As a result, there are $37.8 billion in assets under management locked in Bitcoin exchange-traded products. That is equivalent to 4.5% of the cryptocurrency market’s current $840 million market capitalization.Total Bitcoin listed investment vehicles, USD. Source: Funds, Bloomberg, ETF.comGold-backed ETF products total $221.2 billion, according to GoldHub data on Feb. 25. Excluding the aggregate 61% non-financial gold use (jewelry, industrial, others), the remaining market capitalization stands at $6.0 trillion. Therefore, the fund’s exchange-traded investment vehicles correspond to 3.7% of the adjusted gold’s market value.At $45,000, Bitcoin’s average volume traded and institutional investors’ holdings roughly match gold’s markets. While the $850 million market cap level might be a short-term concern for investors, the cryptocurrency has other emerging use cases, such as El Salvador’s micropayment channels that use Lightning Network technology.As “digital gold” becomes only a part of Bitcoin’s valuation model, traders are likely to price in higher upside, and consequently, the $45,000 level should become a distant memory.The views and opinions expressed here are solely those of the author and do not necessarily reflect the views of Cointelegraph. Every investment and trading move involves risk. You should conduct your own research when making a decision.

Čítaj viac

Here’s a clever options strategy for cautiously optimistic Bitcoin traders

Bitcoin (BTC) entered an upward channel in early January and despite the sideways trading near $40,000, order book analysts cited “significant buying pressure” and noted that the overall negative sentiment might be heading towards exhaustion.Bitcoin/USD price at FTX. Source: TradingViewIndependent analyst Johal Miles noted that BTC’s price formed a bullish hammer candlestick on its daily chart on Jan. 24 and Feb. 24, hinting that the longer-term downtrend is close to an end.However, the rally above $41,000 on Feb. 28 was unable to create strong demand from Asia-based traders, as depicted by the lack of a China-based peer-to-peer Tether (USDT) premium versus the the official U.S. dollar currency.Currently, there is positive news coming from the potential adoption of crypto by global e-commerce marketplace eBay. On Feb. 27, CEO Jamie Iannone revealed that the tech giant is looking to transition to new payment modes for part of its $85 billion in direct annual volume that is transacted on the platform.Bitcoin bulls also have a strong case to leave room for upside price surprises if the European Commission plans to isolate Russia from the international SWIFT cross-border payment network system.In addition to cutting off Russia from SWIFT, the European Commission will “paralyze the assets of Russia’s central bank.” Whether or not intended, this showcases Bitcoin’s decentralization benefits as an uncensorable means of exchange and a store of value.The risk reversal strategy fits the current scenarioAlbeit the popular belief that futures and options are widely used for gambling and excessive leverage, the instruments were actually designed for hedge (protection).Options trading presents opportunities for investors to profit from increased volatility or obtain protection from sharp price drops and these complex investment strategies involving more than one instrument are known as options structures.Traders can use the “risk reversal” options strategy to hedge losses from unexpected price swings. The investor benefits from being long on the call options, but pays for those by selling the put. Basically, this setup eliminates the risk of the stock trading sideways but does come with substantial risk if the asset trades down.Profit and loss estimate. Source: Deribit Position BuilderThe above trade focuses exclusively on Mar. 31 options, but investors will find similar patterns using different maturities. Bitcoin was trading at $41,767 when the pricing took place.First, the trader needs to buy protection from a downside move by buying 2 BTC puts (sell) $34,000 options contracts. Then, the trader will sell 1.8 BTC put (sell) $38,000 options contracts to net the returns above this level. Finally, buying 3 call (buy) $52,000 options contracts for positive price exposure.Investors are protected from a price drop to $38,000That options structure results in neither a gain or a loss between $38,000 (down 9%) and $52,000 (up 24.5%). Thus, the investor is betting that Bitcoin’s price on Mar. 31 at 8:00 am UTC will be above that range while gaining exposure to unlimited profits and a maximum 0.214 BTC loss.If Bitcoin price rallies toward $56,000 (up 34%), this investment would result in a 0.214 BTC gain. Even though there is no cost associated with this options structure, the exchange will require a margin deposit to cover potential losses.The views and opinions expressed here are solely those of the author and do not necessarily reflect the views of Cointelegraph. Every investment and trading move involves risk. You should conduct your own research when making a decision.

Čítaj viac

Ethereum price moves toward $3K, but pro traders choose not to add leverage

Even though Ether (ETH) price bounced over 20% from the $2,300 low on Feb. 22, derivatives data shows that investors are still cautious. To date, Ether’s price is down 24% for the year, and key overhead resistances lay ahead.Ethereum’s most pressing issue has been high network transaction fees and investors are increasingly worried that this will remain an issue even after the network integrates its long-awaited upgrades.For example, the 7-day network average transaction fee is still above $18, while the network value locked in smart contracts (TVL) decreased 25% to $111 billion between Jan. 1 and Feb. 27. This negative indicator could partially explain why Ether has been down-trending since early February.Ether/USD price at FTX. Source: TradingViewThe above channel currently shows resistance at $3,100, while the daily closing price support stands at $2,500. Therefore, a 14% rally from the current $2,750 level needs to happen for the prevailing downward trend to be canceled.Derivatives markets show fear as the prevailing sentimentThe 25% delta skew compares equivalent call (buy) and put (sell) options. The indicator will turn positive when “fear” is prevalent because the protective put options premium is higher than the call options.The opposite holds when market makers are bullish, causing the 25% delta skew to shift to the negative area. Readings between negative 8% and positive 8% are usually deemed neutral.Deribit Ether 30-day options 25% delta skew. Source: laevitas.chThe above chart shows that Ether option traders have been signaling bearishness since Feb. 11, just as Ether failed to break the $3,200 resistance. Furthermore, the current 8.5% reading shows no confidence from market markers and whales despite the 7.5% price increase on Feb. 28.Exchange-provided data highlights traders’ long-to-short net positioning. By analyzing every client’s position on the spot, perpetual and futures contracts, one can better understand whether professional traders are leaning bullish or bearish.There are occasional methodological discrepancies between different exchanges, so viewers should monitor changes instead of absolute figures.Exchanges’ top traders Ether long-to-short ratio. Source: CoinglassEven with Ether’s 21.5% rally since Feb. 24, top traders on Binance, Huobi and OKX have decreased their leverage longs. More precisely, Huobi was the only exchange facing a modest reduction in the top traders’ long-to-short ratio as the indicator moved from 1.04 to 1.07. However, this impact was more than compensated by OKX traders increasing their bullish bets from 2.15 to 1.58 from Feb. 24 to Feb. 28. On average, top traders decreased their longs by 8% over the past four days.Top traders could be caught by surpriseFrom the perspective of the metrics discussed above, there is hardly a sense of bullishness present in the Ether market. Moreover, data suggests that pro traders are unwilling to add long positions as expressed by both futures and options markets.Of course, even professional traders get it wrong, and a short cover should happen if Ether breaks the current downtrend channel $3,100 resistance. Still, it’s also important to at least recognize that there’s little interest in buying using derivatives at the current level.The views and opinions expressed here are solely those of the author and do not necessarily reflect the views of Cointelegraph. Every investment and trading move involves risk. You should conduct your own research when making a decision.

Čítaj viac

2 key derivatives metrics signal that Bitcoin traders expect BTC to hold $40K

Whenever Bitcoin (BTC) fails to break through important resistance levels, traders gain confidence and add to their altcoin positions. The logic is that, unless BTC drops significantly, these movements historically provide decent rewards for those shifting their portfolios toward higher risk.Bitcoin/USD at FTX. Source: TradingViewIn the past seven days, the aggregate market capitalization performance of the cryptocurrency market showed a modest 3% increase to $1.78 trillion. This number is roughly in line with the performance seen from Bitcoin, Ether (ETH) and BNB.However, comparing the winners and losers among the top-80 coins provides skewed results. For instance, while the gainers captured a positive 24.9% move on average, the worst performers dropped by 5.9%.Weekly winners and losers among the top-80 coins. Source: NomicsTerra (LUNA) rallied 52% on the week after the nonprofit organization supporting the Terra blockchain ecosystem sold $1 billion worth of tokens on Feb. 22. Luna Foundation raised money from Three Arrows Capital and Jump Crypto, a trading group that earlier assisted Solana’s Wormhole cross-bridge platform by replenishing their stolen $300 million in Ether.On Feb. 21, WAVES gained 50.7% after announcing a partnership with Allbridge that makes the protocol cross-chain interoperable and supportive of the Ethereum Virtual Machine (EVM) and non-EVM chains like NEAR Protocol, Solana (SOL) and Terra (LUNA).Arweave (AR) rallied 28.5% in seven days after Bundlr Network released a high-volume Twitter archiver tool on Feb. 21. The system allows users to store tweets and linked media directly onto Arweave’s permanent storage.Lastly, QuickSwap, the Uniswap (UNI) implementation on the Polygon network, became the largest decentralized exchange DEX protocol by volume, reaching a $40 million daily average in February. Uniswap (UNI) token gained 14.4% over the past seven days, while Polygon (MATIC) rallied 8.5%.The Tether premium reflects low retail demandThe OKX Tether (USDT) premium is a good gauge of China-based retail trader crypto demand. It measures the difference between China-based peer-to-peer trades and the official U.S. dollar currency. Excessive buying demand tends to pressure the indicator above fair value at 100%, and during bearish markets, Tether’s market offer is flooded, causing a 4% or higher discount.Tether (USDT) peer-to-peer vs. USD/CNY. Source: OKXCurrently, the Tether premium stands at 100.3%, which is neutral. Still, there has been a consistent improvement in 2022. This data signals that retail demand is picking up, which is positive considering that the total cryptocurrency capitalization dropped 19% between Jan. 1 and Feb. 28.Futures markets confirm a lack of “euphoria”Perpetual contracts, also known as inverse swaps, have an embedded rate usually charged every eight hours. Exchanges use this fee to avoid exchange risk imbalances.A positive funding rate indicates that longs (buyers) demand more leverage. However, the opposite situation occurs when shorts (sellers) require additional leverage, causing the funding rate to turn negative.Accumulated perpetual futures funding rate on Feb. 28. Source: CoinglassAs depicted above, the accumulated 7-day funding rate is slightly negative in most cases. This data indicates slightly higher demand from shorts (sellers), but it is insignificant. For example, Luna’s negative 0.65% weekly rate equals 2.8% per month, a figure th is not too concerning for futures traders.Had there been a relevant risk appetite from shorts, the rate would be above 1% per week or equivalent to 4.6% per month.Perpetual futures are retail traders’ preferred derivatives because their price tends to track regular spot markets perfectly. Therefore, despite the negative 19% crypto performance in 2022, the neutral Tether premium and the funding rate should be interpreted as positive.The views and opinions expressed here are solely those of the author and do not necessarily reflect the views of Cointelegraph. Every investment and trading move involves risk. You should conduct your own research when making a decision.

Čítaj viac

Získaj BONUS 8 € v Bitcoinoch

nakup bitcoin z karty

Registrácia Binance

Burza Binance

Aktuálne kurzy