
Autor Cointelegraph By Marcel Pechman

Softer-than-expected crypto regulation and stocks’ rebound position Bitcoin for a $42K close

Bitcoin (BTC) bulls jumped in to defend the $40,000 level after a devastating retest of the $38,000 support on March 7. The confidence and momentum that was building up earlier in the month was suddenly shattered after BTC failed to break $44,500 for the third time this month on March 2.The Bitcoin price rally on March 9 has been partially attributed to this week’s expected United States inflation data report. Analysts expect another 40-year record high as the consumer price index (CPI) reaches 7.9% yearly gains.Furthermore, a statement from the U.S. Treasury Secretary Janet Yellen regarding President Biden’s executive order on digital assets was somewhat milder than expected. Although deleted from the U.S. Department of the Treasury website as it was seemingly released early by error, the order will apparently call for “a coordinated and comprehensive approach to digital asset policy.”The commodities rally was a presage for Bitcoin’s hikeConsidering that Bloomberg Commodities Index (BCOM) reached an all-time high of 134 on March 8, Bitcoin’s recent strength should not come as a surprise. Despite correcting to 129, the BCOM gains accumulated in 30 days remain at 18.5%, according to MarketWatch.According to the open interest on Friday’s options expiry, Bitcoin bulls placed heavy bets between $44,000 and $48,000. These levels might seem optimistic right now, but Bitcoin tested this level eight days ago.Bitcoin options aggregate open interest for March 11. Source: CoinGlassA broader view uses the call-to-put ratio and shows a 40% advantage to Bitcoin bulls, as the $460 million call (buy) instruments have a larger open interest versus the $330 million put (sell) options. However, the 1.40 call-to-put indicator is deceptive because most bullish bets will become worthless.For example, if Bitcoin’s price remains below $43,000 at 8:00 am UTC on March 11, only $190 million worth of those call (buy) options will be available. This effect happens because there is no value in the right to buy Bitcoin at $44,000 if it’s trading below that level.Bulls could pocket $140 million at $42,000Below are the three most likely scenarios based on the current price action. The number of options contracts available on March 11 for bulls (call) and bear (put) instruments varies depending on the expiry price. The imbalance favoring each side constitutes the theoretical profit:Between $40,000 and $42,000: 2,600 calls vs. 2,100 puts. The net result is balanced between call (bull) and put (bear) options.Between $42,000 and $43,000: 4,500 calls vs. 1,150 puts. The net result favors bulls by $140 million.Between $43,000 and $44,000: 5,100 calls vs. 700 puts. The net result favors the call (bull) instruments by $190 million.This crude estimate considers the call options used in bullish bets and the put options exclusively in neutral-to-bearish trades. Even so, this oversimplification disregards more complex investment strategies.For instance, a trader could have sold a call option, effectively gaining a negative exposure to Bitcoin above a specific price. Unfortunately, there’s no easy way to estimate this effect.Bears need BTC price below $42,000 to balance the scalesBitcoin bulls need to hold $42,000 to score a $140 million profit on March 11. Furthermore, a mere 2% price hike from the current $42,200 level is enough for Bitcoin bulls to secure a $190-million gain on Friday’s options expiry.Bears will face difficulty suppressing the price given the short-term positive sentiment of inflation expectations and lessened pressure from regulators. Currently, options markets data favor the call (buy) options.The views and opinions expressed here are solely those of the author and do not necessarily reflect the views of Cointelegraph. Every investment and trading move involves risk. You should conduct your own research when making a decision.

Čítaj viac
Bitcoin’s sub-$40K range trading and mixed data reflect traders’ uncertainty

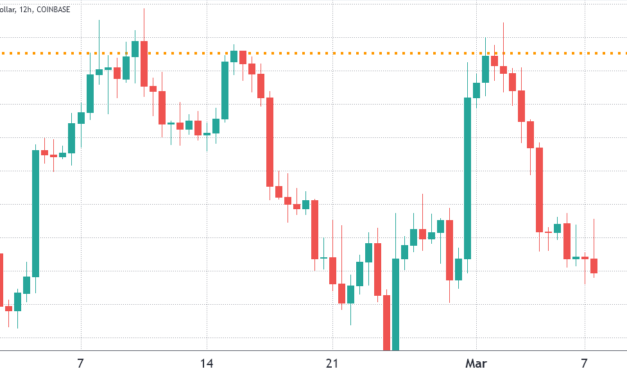
The phrase “hindsight is 20/20” is a perfect expression for financial markets because every price chart pattern and analysis is obvious after the movement has occurred.For example, traders playing the Feb. 28 pump that took Bitcoin (BTC) above $43,000 should have known that the price would face some resistance. Considering that the market had previously rejected at $44,500 on multiple instances, calling for a retest below $40,000 made perfect sense right?Bitcoin/USD at Coinbase. Source: TradingViewThis is a common fallacy, known as “post hoc,” in which one event is said to be the cause of a later event merely because it had occurred earlier. The truth is, one will always find analysts and pundits calling for continuation and rejection after a significant price move.Usually after strong #Bitcoin rallies like the one we just saw today, we tend to get follow through. As I said earlier, the sheer disbelief during this rally has me optimistic in the short-term. Still no guarantees of new highs immediately, but at least maybe a local uptrend.— Benjamin Cowen (@intocryptoverse) March 1, 2022Meanwhile, on March 2, Cointelegraph reported that Bitcoin “could force a $34K retest.” The analysis cited “ailing momentum” because Russia had just announced its invasion of Ukraine.In the past seven days, the aggregate market capitalization performance of the cryptocurrency market showed an 11.5% retrace to $1.76 trillion and this move erased the gains from the previous week. Large cap assets like Bitcoin, Ether (ETH) and Terra (LUNA) were equally impacted, reflecting nearly 12% losses in the period.Weekly winners and losers among the top-80 coins. Source: NomicsOnly two tokens were able to present positive performances over the past 7 days. WAVES rallied for the second consecutive week as the network upgrade to become Ethereum Virtual Machine (EVM) compatible advanced. The transition is scheduled to start in the spring and the new consensus mechanism will provide a “smoother transition to Waves 2.0.”THORChain (RUNE) jumped after completing its Terra (LUNA) ecosystem integration, enabling the blockchain to support all Cosmos-based projects. ThorChain users now have more trading and staking options available, including TerraUSD (UST) stablecoin.Funding rates flipped positive Perpetual contracts, also known as inverse swaps, have an embedded rate usually charged every eight hours. Perpetual futures are retail traders’ preferred derivatives because their price tends to track regular spot markets perfectly. Exchanges use this fee to avoid exchange risk imbalances. A positive funding rate indicates that longs (buyers) demand more leverage. However, the opposite situation occurs when shorts (sellers) require additional leverage, causing the funding rate to turn negative.Accumulated perpetual futures funding rate on March 7. Source: CoinglassNotice how the accumulated 7-day funding rate flipped positive in all of the top 4 coins. This data indicates slightly higher demand from longs (buyers) but is not yet significant. For example, Bitcoin’s positive 0.10% weekly rate equals 0.4% per month, which is not eventful for traders building futures’ positions.Typically, when there’s an imbalance caused by excessive optimism the rate can easily surpass 4.6% per month. Options data is pricing in a potential price crashCurrently, there is not any clear direction in the market, but the 25% delta options skew is a telling sign whenever market makers overcharge for upside or downside protection.If professional traders fear a Bitcoin price crash, the skew indicator will move above 10%. On the other hand, generalized excitement reflects a negative 10% skew.Bitcoin 30-day options 25% delta skew: Source: Laevitas.chAs displayed above, the skew indicator held 10% until March 4, but slightly reduced to 7% or 8% during the week. Despite this, the indicator shows that pro traders are pricing higher odds for a market crash.There are mixed feelings coming from retail traders’ futures data, which shows a shift moving away from a slightly negative sentiment versus options market makers pricing in a higher risk of a further crash.Some might say that the third failure to break the $44,500 resistance was the nail in the coffin because Bitcoin failed to display strength during a period of global macroeconomic uncertainty and strong commodities demand. On the other hand, the crypto sector’s current $1.76 trillion market capitalization can hardly be deemed unsuccessful, so there’s still hope for buyers.The views and opinions expressed here are solely those of the author and do not necessarily reflect the views of Cointelegraph. Every investment and trading move involves risk. You should conduct your own research when making a decision.

Čítaj viac

Ethereum traders reduce their bullish bets as ETH struggles reclaim $3K

Ether (ETH) is still in troubled waters after failing to break a five-week-long descending channel top for the third time in a row. The March 2 test of the $3,000 resistance was followed by a 17.5% correction in five days, which signals that buyers are somewhat reluctant to defend the price.To date, Ether suffers from high network transaction fees, even though it dropped from $19 in mid-February to the current $13 per transaction. While this is less than peaks seen previously, $13 per transaction is still incompatible with most games, nonfungible token and even decentralized finance transactions.Ether/USD price at FTX. Source: TradingViewEven more worrisome than Ether’s performance has been the total value locked (TVL) in Ethereum declining by 55% on March 8. Data shows the percentage of assets locked in its smart contracts reached an all-time low versus competitors.This indicator could partially explain why Ether has been in a down-trend since early February. But, more importantly, one needs to analyze how professional traders are positioning themselves and there’s no better gauge than derivatives markets.The futures premium has flatlinedTo understand whether the current bearish trend reflects top traders’ sentiment, one should analyze Ether’s futures contracts premium, which is also known as a “basis.” Unlike a perpetual contract, these fixed-calendar futures do not have a funding rate, so their price will differ vastly from regular spot exchanges.By measuring the expense gap between futures and the regular spot market, a trader can gauge the level of bullishness in the market. Conversely, bearish sentiment tends to cause the three-month futures contract to trade at a 5% or lower annualized premium (basis).On the other hand, a neutral market should present a 5% to 15% basis, reflecting market participants’ unwillingness to lock in Ether for cheap until the trade settles.Ether 3-month futures premium. Source: laevitas.chThe above chart shows that Ether‘s futures premium has bottomed on Feb. 28 near 1.5%, a level typically associated with moderate pessimism. Despite the slight improvement to the current 3% basis, futures market participants are reluctant to open leverage long (buy) positions.Long-to-short data confirms the lack of excitementThe top traders’ long-to-short net ratio excludes externalities that might have impacted the longer-term futures instruments. By analyzing these top clients’ positions on the spot, perpetual and futures contracts, one can better understand whether professional traders are leaning bullish or bearish.There are occasional methodological discrepancies between different exchanges, so viewers should monitor changes instead of absolute figures.Exchanges’ top traders Ether long-to-short ratio. Source: CoinglassCuriously, when Ether’s futures premium bottomed at 1.5% on Feb. 28, ETH’s price was remarkably close to the current $2,600. Thus, it makes sense to compare the top traders’ long-to-short ratio over this period.Binance shows the same level of top traders Ether positions at 0.92 on Feb. 8 and March 8. However, these whales and market markers at Huobi and OKX effectively reduced their longs. For instance, the long-to-short ratio at Huobi declined from 1.07 to the current 1.00. Furthermore, OKX traders’ current 1.47 ratio is smaller than 1.58 from eight days ago.All the data points to further downsideFrom the perspective of the metrics discussed above, there is hardly any sense that Ether price will flip bullish in the short-term. The data suggests that pro traders are unwilling to add long positions, as expressed by the basis rate and long-to-short ratio.Moreover, the TVL data does not back a strong usage indicator of Ethereum smart contracts. Losing ground to competitors, while constantly delaying the migration to a proof-of-stake solution is likely pulling investors’ attention away and making long investors feel uncomfortable.The views and opinions expressed here are solely those of the author and do not necessarily reflect the views of Cointelegraph. Every investment and trading move involves risk. You should conduct your own research when making a decision.

Čítaj viac

Solana TVL and price drop 50%+ from ATH, but gaming DApps could turn the tables

2022 has not been a good start for cryptocurrencies and to date, the total market capitalization has dropped by 21% to $1.77 trillion. Solana’s (SOL) correction has been even more brutal, presenting a 48.5% correction year-to-date.Solana (blue) vs. Ether (orange), AVAX (purple), BNB (yellow). Source: TradingViewSolana leads the staking charts with $35 billion in value locked, which is equivalent to 74% of the SOL tokens in circulation. Multiple reasons can be identified for the underperformance, including four network outages in late 2021 and early 2022.The latest incident on Jan. 7 was attributed to a distributed denial-of-service (DDoS) attack, causing Solana Lab developers to update the code and consequently reject these types of requests.However, investors are more concerned about the centralization caused by the costs of being a Solana validator. To achieve 400 millisecond block times, the recommended hardware includes a 12 core 2.8GHz CPU, 256 GB memory, high-speed 1 TB SSD drives and a low-latency internet connection.solana is cool for a centralized corporate state-sync machine… I just prefer real crypto and blockchain— UltraXBT.eth (@UltraXBT) January 29, 2022dApp use is on the declineSolana’s primary decentralized application metric started to display weakness earlier in November after the network’s total value locked (TVL) began to linger at $15 billion.Solana network Total Value Locked, USD. Source: DefiLlamaThe chart above shows how Solana’s decentralized application (DApp) deposits saw a 50% decrease in three months as the indicator reached its lowest level since Sept. 8. As a comparison, Fantom’s TVL currently stands at $9.5 billion after doubling in three months. Another DApp scaling solution competitor, Terra (LUNA), saw an 87% TVL hike to $23.2 billion.On the bright side, on Feb. 21, FTX.US, the American arm of the global crypto derivative and spot exchange FTX, announced a new blockchain gaming unit. It is also worth noting that Solana Ventures partnered with FTX and Lightspeed Venture on Nov. 5 to launch a $100 million fund dedicated to the sector.To confirm whether this drop in TVL should be concerning, one should analyze DApp usage metrics. Some DApps are not financially intensive, so the value deposited is irrelevant.Solana dApps 30-day on-chain data. Source: DappRadarAs shown by DappRadar data, on Jan. 28 the number of Solana network addresses interacting with decentralized applications dropped by 18% on average. The only positive change was Solend, an algorithmic lending protocol.The decreased interest in Solana DApps was also reflected in its futures open interest, which peaked at $2 billion on Nov. 6 and was recently hit with a steep correction.The gaming sector could be a surprise factorEven though Solana has been hit the hardest compared to similar smart contract platforms, there is solid network use on non-fungible tokens (NFT) marketplaces, as measured by Magic Eden’s 178,820 active addresses in the last 30 days.Moreover, Solana Ventures’ bet on the gaming sector could further showcase the network’s processing capacity. For instance, games represent half of the top 10 DApps across every blockchain covered by DappRadar. That includes Splinterlands, which has 578,280 active addresses and Alien Worlds which has 544,900. The above data suggests that Solana is losing ground versus competing chains, but holders are not concerned because 74% of the coins are still locked in staking. As long as Solana Labs’ partnerships and investments continue to show potential, there is little reason to be bearish on SOL.The views and opinions expressed here are solely those of the author and do not necessarily reflect the views of Cointelegraph. Every investment and trading move involves risk. You should conduct your own research when making a decision.

Čítaj viac

Ethereum price finally topped $3K, but data suggests a reversal is nowhere in sight

There is an old saying in traditional markets which is actually more like a trading rule. It goes, “when the trend is negative, one can only be neutral or short,” meaning bet on the price decrease. The problem is that a relief bounce tricks traders into believing that the negative prevailing sentiment has shifted into a buyers’ market.For example, after analyzing Ether’s (ETH) price chart, one might conclude that after a 41% crash, a bull run should be ignited sooner rather than later. Unfortunately, this is a bit of a fallacy because markets can exist in periods of non-definition (trendwise).Ether price at FTX, in USD. Source: TradingViewThus, you could say that the above chart presents a long period of range trading near $2,800, for example. Considering Ether’s 88% annualized volatility, moves between $2,400 and $3,200 should be regarded as normal.Using technical analysis, a trader might point to lower highs forming the above downtrend channel, but should Ether bears celebrate and call for $2,500 and lower? That largely depends on how retail traders are positioned, along with the Ethereum network’s on-chain metrics. A few things to consider are whether the 63% drop in network transaction fees to the current $17 reflects a decrease in the use of decentralized applications (DApps), or are users benefiting from engaging with other layer-2 scaling solutions?Ether’s futures premium is absentTo understand how confident traders are about Ether’s price recovery, one should analyze the perpetual contracts futures data. This is the retail traders’ preferred derivative because exchanges offer up to 50x leverage, and its price tends to track the regular spot markets perfectly.In any futures contract trade, longs (buyers) and shorts (sellers) are matched at all times, but their leverage use can vary. Consequently, exchanges will charge a funding rate to whichever side deposited less margin, and this fee is paid to the opposing side.Ether perpetual futures 8-hour funding rate. Source: CoinglassThis data tells us whether retail traders are getting excited, causing the funding rate to move above 0.05%, equivalent to 1% per week. Notice how the past couple of months showed a slightly negative funding rate, reflecting a neutral-to-bearish sentiment. Currently, there is no sign that retail traders are confident enough to buy Ether using leverage.To exclude externalities that might have influenced derivatives data, one should analyze the Ethereum network’s on-chain data. For example, monitoring the network use tells us whether actual use cases support the demand for Ether tokens.On-chain metrics raise concernMeasuring the monetary value of the Ether transacted on the network provides a quick and reliable indicator of effective use. Of course, this metric could be masqueraded by increasing adoption in layer-2 solutions, but it works as a starting point.7-day average of native ETH token transfers per day, USD. Source: CoinMetricsThe current $6.7 billion daily transaction average is a 6% increase from 30 days before, but it’s nowhere near the $9 billion seen late-2021. Data shows that Ether token transactions are not showing signs of growth, at least on the primary layer.One should proceed to decentralized applications usage metrics, but avoid exclusive focus on the Total Value Locked (TVL) because that metric is heavily concentrated on lending platforms and decentralized exchanges (DEX), so gauging the number of active addresses provides a broader view.Ethereum network 30-day DApps activity. Source: DappRadarOn average, Ethereum DApps saw a monthly 10% decrease on active addresses. In a nutshell, the data is disappointing because the smart contract network was specifically designed to host decentralized applications such as non-fungible token (NFT) marketplaces and decentralized finance, DeFi.Unless there is a decent growth in Ether transactions and DApps usage, bears are likely to have the upper hand. As for retail traders’ neutral funding rate, it should not be considered a bearish sign as those investors typically enter long leveraged positions after a strong price rally.The views and opinions expressed here are solely those of the author and do not necessarily reflect the views of Cointelegraph. Every investment and trading move involves risk. You should conduct your own research when making a decision.

Čítaj viac

Získaj BONUS 8 € v Bitcoinoch

nakup bitcoin z karty

Registrácia Binance

Burza Binance

Aktuálne kurzy