
Autor Cointelegraph By Marcel Pechman

Afraid to buy the dip? Bitcoin options provide a safer way to ‘go long’ from $38K

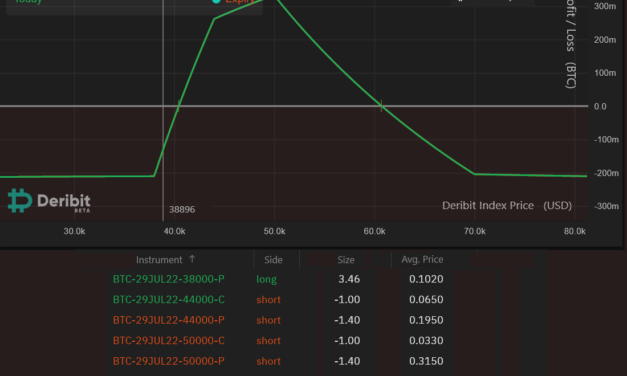
The last time Bitcoin (BTC) traded above $50,000 was Dec. 27, 2021. Since then, four months have passed, but traders seem somewhat optimistic that inflation has hit the necessary threshold to trigger cryptocurrency adoption.In theory, the 8.5% inflation in the United States means that every five years, the prices increase by 50%. This essentially turns $100 into $66 by slashing 33% of the dollar’s purchasing power.The U.S. Federal Reserve FOMC meeting is expected to rule on the interest rates on May 4, but more importantly, the FED is expected to announce a program to offload part of its $9 trillion balance sheet. Thus, instead of supporting debt and mortgage markets, the U.S. Central Bank will likely sell $95 billion worth of these assets every month. The consequences could be severe and risk markets have priced in such a scenario. For instance, the Rusell 2000 mid-capitalization stock market index is down 16.5% year-to-date in 2022. Similarly, as measured by the MSCI China index, the Chinese stock market is currently facing a 20% correction year-to-date.There is no way to know what will trigger a Bitcoin bull run, but a report by Glassnode on April 18 has detected “a large amount of coin supply” accumulating between $38,000 and $45,000. For traders who believe BTC will reach $50,000 by July, there is a low-risk options strategy that can be used to cast a long bullish bet. The skewed ‘iron condor’ has a limited downsideFollowing the whales and large investors usually pays off, but most traders are looking for ways to maximize gains while also limiting losses. For example, the skewed “iron condor” maximizes profits near $50,000 by July by limiting losses below $38,000.Bitcoin options Iron condor skewed strategy returns. Source: Deribit Position BuilderThe call option gives the buyer the right to acquire an asset at a fixed price in the future and the buyer pays an upfront fee known as a premium for this privilege. On the other hand, the put option provides its buyer the privilege to sell an asset at a fixed price in the future — a downside protection strategy. Meanwhile, selling this instrument offers exposure to the price upside.The iron condor consists in selling both the call and put options at the same expiry price and date. The above example has been set using the BTC July 29 options.The profit area lies between $40,500 and $60,500To initiate the trade, the investor needs to short 1 contract of the $44,000 call option and another 1.4 contracts of the $44,000 put option. Then, the buyer needs to repeat the procedure for the $50,000 options, using the same expiry month.To protect from an eventual downside, one should buy 3.46 contracts of the $38,000 put option. Lastly, one should buy 1.3 contracts of the $70,000 call option to limit losses above the level.This strategy yields a net gain if Bitcoin trades between $40,500, 4% above the current $38,900 price, and $60,500 on July 29. Net profits peak at 0.33 BTC at $50,000, but remain above 0.21 BTC between $43,200 and $53,400.Meanwhile, the maximum loss is 0.21 BTC in either extreme if, on July 29, Bitcoin price trades below $38,000 or above $70,000, both of which seem rather unlikely.The views and opinions expressed here are solely those of the author and do not necessarily reflect the views of Cointelegraph. Every investment and trading move involves risk. You should conduct your own research when making a decision.

Čítaj viac
2 key metrics point toward further downside for the entire crypto market

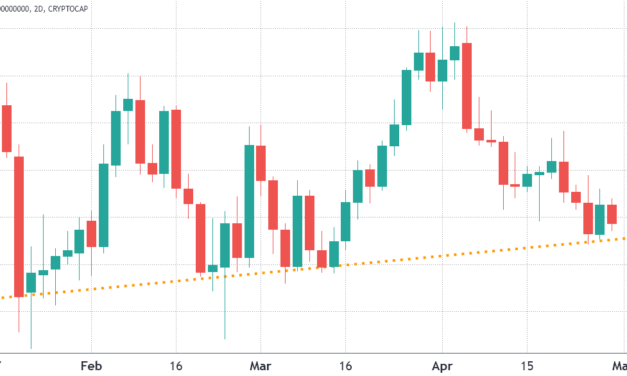
The total crypto market capitalization has been holding a slightly ascending trend for the past 3 months and the $1.75 trillion support was most recently tested on April 27 as Bitcoin (BTC) bounced at $38,000 and Ether (ETH) at $2,800 on April 27.Total crypto market cap, USD billion. Source: TradingViewThe crypto market’s aggregate capitalization showed a 3.5% decrease in the last 7 days and notable losers were a 18.8% loss from XRP, a 10.2% loss from Cardano (ADA), and 9.7% drop in Polkadot (DOT) price.Analyzing a broader range of altcoins provides a more balanced picture, that includes 25% gains from some gaming and Metaverse projects in the same time period.Weekly winners and losers among the top 80 coins. Source: NomicsApecoin (APE) rallied 44% due to the upcoming Otherside metaverse land auction scheduled for April 30. The Otherside is being developed by Yuga Labs, Animoca Brands and the Bored Ape Yacht Club NFT team and NFT investors have high expectations for the project. The native tokens of move-to-earn lifestyle app STEPN (GMT) rallied 28% after the U.S.-based crypto exchange Coinbase announced plans to list the token.Nexo gained 15% after crypto and derivatives exchange Binance announced its listing on April 29 and Nexo also revealed plans to issue a credit card that accepts crypto as collateral rather than selling the holders’ assets.Zilliqa (ZIL) price has been adjusting after the token pumped 380% in late March and this follows the project’s March 25 announcement of a metaverse service that will utilize Nvidia technology.Meanwhile, data from DappRadar shows that play-to-earn unicorn, Axie Infinity (AXS) plunged to its lowest level in 9 months after the number of users and transactions declined by 15% over the last 30.The Tether premium shows lack of demand from buyersThe OKX Tether (USDT) premium gauges China-based retail demand and it measures the difference between the China-based peer-to-peer trades and the United States dollar.Excessive buying demand puts the indicator above fair value at 100%. On the other hand, Tether’s market offer is flooded during bearish markets, causing a 4% or higher discount.Tether (USDT) peer-to-peer vs. USD/CNY. Source: OKXThe OKX Tether premium peaked at 2% on April 28, its highest level in 2022. The movement coincided with Bitcoin breaking above $40,000, but its price reverted later that day. Currently, the Tether premium stands at 0%, signaling a neutral sentiment from retail traders.Futures markets show mixed sentimentPerpetual contracts, also known as inverse swaps, have an embedded rate that is usually charged every eight hours. Exchanges use this fee to avoid exchange risk imbalances.A positive funding rate indicates that longs (buyers) demand more leverage. However, the opposite situation occurs when shorts (sellers) require additional leverage, causing the funding rate to turn negative.Accumulated 7-day perpetual futures funding rate on April 29. Source: CoinglassAs shown above, the accumulated seven-day funding rate is slightly positive for Bitcoin and Ether. Data indicates slightly higher demand from longs (buyers), but nothing that would force traders to close their positions. For instance, Luna’s positive 0.15% weekly rate equals 0.6% per month, which should not concern most futures traders.The absence of the Tether premium in Asia and the flattish perpetual contract premiums signal a lack of demand from retail traders right as the total crypto market capitalization struggles to sustain the $1.75 trillion support.The views and opinions expressed here are solely those of the author and do not necessarily reflect the views of Cointelegraph. Every investment and trading move involves risk. You should conduct your own research when making a decision.

Čítaj viac
Avalanche (AVAX) loses 30%+ in April, but its DeFi footprint leaves room to be bullish

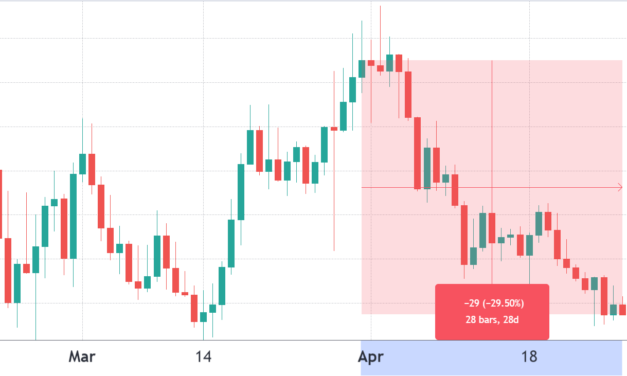
Avalanche (AVAX) price is down more than 30% in April, but despite the negative price move, the smart contract platform remains a top contender for decentralized applications due to its scalability, low-cost transactions and its large footprint in the decentralized finance (DeFi) landscape.AVAX token/USD at FTX. Source: TradingViewThe network is compatible with the Ethereum Virtual Machine (EVM) and unique in that it does not face the same operational bottlenecks of high transaction fees and network congestion.Avalanche was able to amass over $9 billion in total value locked (TVL) by offering a proof-of-stake (PoS) layer-1 scaling solution. This indicator is extremely relevant because it measures the deposits on the network’s smart contracts. For instance, the BNB Chain, running since Sept. 2020, holds $10.4 billion in TVL.Positive news could create a price supportEven though the AVAX token price has suffered and even the TVL stands behind some of its competitors, investors remain bullish based on fundamentally positive developments that occurred in the month of April.According to an April 14 report by Bloomberg, Ava Labs, the lead developer of the Avalanche blockchain, raised $350 million from investors. This deal valued the company at $5.25 billion and according to data from DappRadar, Avalanche holds nearly 100 active applications ranging from decentralized finance to nonfungible token (NFT) marketplaces, and gaming.Earlier in April, the organizations behind the Terra USD algorithmic stablecoin purchased a combined $200 million in AVAX for their strategic Terra USD reserves. Terra co-founder Do Kwon cited Avalanche’s solid ecosystem growth and large user base.Even with the positive news, AVAX’s price remains 53% below its $147 all-time high, resulting in an $18.4 billion market capitalization. In comparison, the market cap of Terra (LUNA) stands at $31.0 billion, and Solana (SOL) has a $33.3 billion total value.Total value locked drops 10.5%, but follows the market-wide downtrendAvalanche’s primary DApp metric strengthened in the last 30 days as the network‘s TVL rebounded to 121 million AVAX.Avalanche Total Value Locked, AVAX. Source: DefiLlamaThe chart above shows how Avalanche’s DApp deposits peaked at 132.9 million AVAX on March 14, but drastically declined earlier in April to the lowest level since Jan. 3. As a result, the current $8.5 billion TVL is down 10.5% over the last 30 days.As a comparison, Solana’s (SOL) TVL decreased by 9.5% in the same period, reaching $4.8 billion. Similarly, Ethereum smart contract deposits decreased from $88.3 billion to $80.1 billion in the same period, which is a 9% decline.To confirm whether the TVL drop in Avalanche is troublesome, one should analyze DApp usage metrics. Some DApps such as games and collectibles do not require large deposits, so the TVL metric is irrelevant in those cases.Avalanche DApps 30-day data. Source: DappRadarAs shown by DappRadar, on April 28, the number of Avalanche network addresses interacting with decentralized applications declined by 14% versus the previous month. In comparison, the Solana network faced a 60% user increase, while Ethereum remained flat.Avalanche’s strong DeFi use-case is still a bullish factor Even though Avalanche’s TVL has been hit the hardest compared to similar smart contract platforms, there is solid network use in the DeFi segment. For instance, Trader Joe’s 180,830 active addresses are higher than Ethereum’s leading DeFi application, MetaMask Swap, which holds 116,210 active users.The above data suggest that Avalanche is holding ground versus competing chains. Given that AVAX price plunged 29.5% in 28 days, investors should not panic because the decentralized application network posted solid TVL and DApp usage data.The views and opinions expressed here are solely those of the author and do not necessarily reflect the views of Cointelegraph. Every investment and trading move involves risk. You should conduct your own research when making a decision.

Čítaj viac
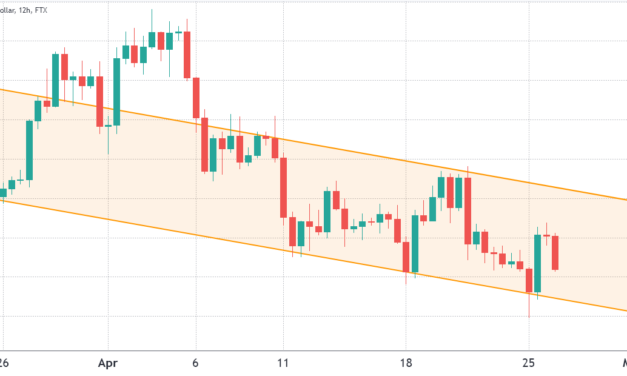
Here's why Bitcoin bears aim to pin BTC under $39K ahead of Friday's $1.9B options expiry

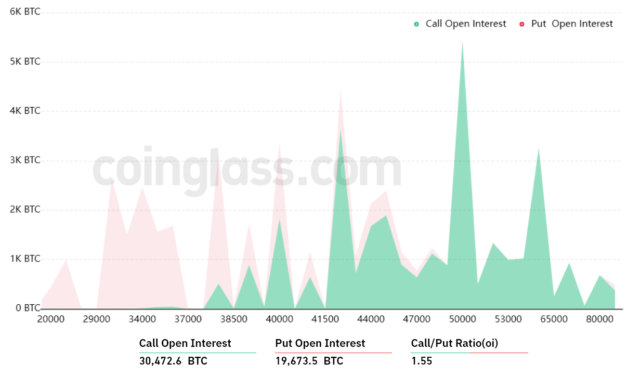
Up until April 25, Bitcoin (BTC) bulls had been defending the $38,000 level, but bulls were caught off-guard by the recent drop. As Bitcoin plunged from $46,700 to $37,700 between April 5 and 26, most of the bullish bets for the upcoming $1.96 billion monthly options expiry became worthless.Regulatory concerns continue to pose a threat to Bitcoin and on April 26, the New York State Assembly passed a bill banning new proof-of-work (PoW) cryptocurrency carbon-based mining facilities in the state. Fortunately for Bitcoin, mining equipment is portable so there’s no real risk to the Bitcoin network’s security but the steady threat of anti-crypto legislation can have an impact on price.Geopolitical tension in Europe also led investors to avoid riskier assets and many are seeking protection in U.S. dollar-denominated assets. CNBC reported that the impact of Russian state energy firm Gazprom’s decision to halt natural gas supplies to Poland and Bulgaria created concerns about a deeper economic slowdown in the Eurozone region.Investors are also obsessed with the potential U.S. Federal Reserve 250 basis point rate hike planned throughout 2022. The maneuver aims to contain inflationary pressure but it could spin global economies into a recession and this is another reason why investors are avoiding highly-volatile assets like cryptocurrencies.Bulls did not expect prices below $40,000The open interest for the April 29 options expiry in Bitcoin is $2 billion, but the actual figure will be much lower since bulls were not expecting the BTC price to drop below $40,000.These traders might have been fooled as Bitcoin held above $45,000 between March 27 and April 6, placing enormous bets for the monthly options expiry above $50,000.Bitcoin options aggregate open interest for April 29. Source: CoinGlassThe 1.55 call-to-put ratio shows more sizable bullish bets as the call (buy) open interest stands at $1.19 billion against the $770 million puts (sell) options. Nevertheless, as Bitcoin stands near $39,000, most bullish bets will likely become worthless.For instance, if Bitcoin’s price stays below $40,000 at 8:00 am UTC on April 29, only $60 million worth of these calls (buy) options will be available. This difference happens because there is no use in the right to buy Bitcoin at $40,000 if it trades below that level on expiry.Bulls need $41,000 to balance the scalesBelow are the three most likely scenarios based on the current price action. The number of options contracts available on April 29 for call (buy) and put (sell) instruments varies, depending on the expiry price. The imbalance favoring each side constitutes the theoretical profit:Between $37,000 and $39,000: 600 calls vs. 9,800 puts. The net result favors the put (bear) instruments by $350 million.Between $39,000 and $40,000: 1,500 calls vs. 8,300 puts. The net result favors bears by $260 million.Between $40,000 and $41,000: 3,400 calls vs. 5,600 puts. Bears remain better positioned by $90 million.Between $41,000 and $42,000: 4,100 calls vs. 4,700 puts. Favors the put (bear) instruments by $30 million.This crude estimate considers the put options used in bearish bets and the call options exclusively in neutral-to-bullish trades. Even so, this oversimplification disregards more complex investment strategies.For example, a trader could have sold a put option, effectively gaining positive exposure to Bitcoin above a specific price but unfortunately, there’s no easy way to estimate this effect.Bears are aiming for a $350 million profitBitcoin bears need to pressure the price below $39,000 on April 29 to secure a $350 million profit. On the other hand, the bulls’ best case scenario requires a 6% price push above $41,000 to cut their losses to $30 million.Bitcoin bulls had $330 million leverage long positions liquidated in the past seven days, so they might have less margin required to drive Bitcoin price higher. With that in mind, bears will likely try to suppress BTC below $39,000 until the April 29 options expiry.The views and opinions expressed here are solely those of the author and do not necessarily reflect the views of Cointelegraph. Every investment and trading move involves risk. You should conduct your own research when making a decision.

Čítaj viac

Ethereum on-chain data hints at further downside for ETH price

Analyzing Ether’s (ETH) current price chart paints a bearish picture, which is largely justified by the 11% drop over the past month, but other traditional finance assets faced more extreme price corrections in the same period. The Invesco China Technology ETF (CQQ) is down 31% and the Russell 2000 declined by 8%.Ether price at FTX, in USD. Source: TradingViewCurrently, traders fear that losing the descending channel support at $2,850 could lead to a stronger price downturn, but this largely depends on how derivatives traders are positioned along with the Ethereum network’s on-chain metrics.According to Defi Llama, the Ethereum network’s total value locked (TVL) flattened in the last 30 days at 27 million Ether. TVL measures the number of coins deposited on smart contracts, including decentralized finance (DeFi), nonfungible token (NFT) marketplaces, gaming and high-risk applications.The Ethereum network’s average transaction fee increased to $13 after bottoming at $11.50 on April 20 but one should analyze whether this reflects decreased use of decentralized applications (DApps) or merely if it is users benefiting from layer-2 scaling solutions.Ether’s futures premium tilts toward bears Traders use Ether futures market data to understand how professional traders are positioned, but unlike the standard perpetual futures, the quarterly contracts are whales and market makers’ preferred instruments because they can avoid the fluctuating funding rate.The basis indicator measures the difference between longer-term futures contracts and the current spot market levels. In neutral markets, the Ether futures annualized premium should run between 5% to 12% to compensate traders for “locking in” the money until the contract expiry.Ether 3-month futures annualized premium. Source: Laevitas.chThe current 2% Ether futures basis clearly shows the lack of demand for leverage buyers. Although not precisely a backwardation (negative premium), an annualized futures premium below 5% is usually deemed bearish.This data tells us that pro traders have been neutral-to-bearish in the past couple of months but to exclude externalities that might have influenced derivatives data, one should analyze the Ethereum network on-chain data. For example, monitoring the network use tells us whether actual use cases support the demand for Ether.On-chain metrics are sluggishMeasuring the number of active addresses on the network provides a quick and reliable indicator of effective use. Of course, this metric could be misguided by the increasing adoption of layer-2 solutions, but it works as a starting point.7-day average of active addresses on Ethereum. Source: CoinMetricsThe current 584,477 daily active addresses average is a 4% decrease from 30 days ago and nowhere near the 675,117 seen in November 2021. Thus, data shows that Ether token transactions are not showing signs of growth, at least on the primary layer.Traders should rely on DApp usage indicators, but avoid exclusive focus on the TVL because that metric is heavily concentrated on DeFi applications. Gauging the number of active addresses provides a broader view.Ethereum network 30-day DApps activity. Source: DappRadarEthereum DApps active addresses have flatlined over the past 30 days. Overall, the data is slightly disappointing, considering competing chains such as Solana (SOL) saw a 34% active addresses increase.Unless there’s decent growth in Ether transactions and DApp usage, the $2,850 descending support channel resistance might not hold, triggering a deeper short-term price correction.The views and opinions expressed here are solely those of the author and do not necessarily reflect the views of Cointelegraph. Every investment and trading move involves risk. You should conduct your own research when making a decision.

Čítaj viac

Získaj BONUS 8 € v Bitcoinoch

nakup bitcoin z karty

Registrácia Binance

Burza Binance

Aktuálne kurzy