
Autor Cointelegraph By Marcel Pechman

Any dip buyers left? Bulls are largely absent as the total crypto market cap drops to $1.65T

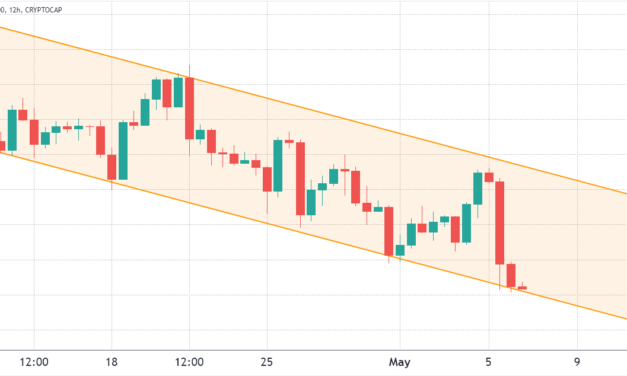
The total crypto market capitalization has been trading within a descending channel for 24 days and the $1.65 trillion support was retested on May 6. The drop to $1.65 trillion was followed by Bitcoin (BTC) reaching $35,550, its lowest price in 70 days.Total crypto market cap, USD billion. Source: TradingViewIn terms of performance, the aggregate market capitalization of all cryptocurrencies dropped 6% over the past seven days, but this modest correction in the overall market does not represent some mid-capitalization altcoins which managed to lose 19% or more in the same time frame.As expected, altcoins suffered the mostIn the last seven days, Bitcoin price dropped 6% and Ether (ETH) declined by 3.5%. Meanwhile, altcoins experienced what can only be described as a bloodbath. Below are the top gainers and losers among the 80 largest cryptocurrencies by market capitalization.Weekly winners and losers among the top 80 coins. Source: NomicsTron (TRX) rallied 26.9% after TRON DAO rolled out a USDD, a decentralized stablecoin, on May 5. The algorithmic stablecoin is connected to the Ethereum and BNB Chain through the BTTC cross-chain protocol.1inch (1INCH) gained 5.6% after the decentralized exchange governance application became Polygon’s network leader by completing 6 million swaps on the network.STEPN (GMT), the native token of the popular move-to-earn lifestyle app, declined 35.7%, adjusting after a 70% rally between April 18 and April 28. A similar movement happened to Apecoin (APE) after the token pumped 94% between April 22 and April 28.The Tether premium flipped negative on May 6The OKX Tether (USDT) premium gauges China-based retail demand and it measures the difference between the China-based peer-to-peer trades and the United States dollar.Excessive buying demand puts the indicator above fair value at 100%. On the other hand, Tether’s market offer is flooded during bearish markets, causing a 4% or higher discount.Tether (USDT) peer-to-peer vs. USD/CNY. Source: OKXThe OKX Tether premium peaked at 1.7% on April 30, indicating some excess demand from retail. However, the metric reverted to a 0% premium over the next 5 days.More recently, in the early hours of May 6, the OKX Tether premium flipped to -1% negative. Data shows retail sentiment worsened as Bitcoin moved below $37,000.Futures markets show mixed sentimentPerpetual contracts, also known as inverse swaps, have an embedded rate that is usually charged every eight hours. Exchanges use this fee to avoid exchange risk imbalances.A positive funding rate indicates that longs (buyers) demand more leverage. However, the opposite situation occurs when shorts (sellers) require additional leverage, causing the funding rate to turn negative.Accumulated 7-day perpetual futures funding rate. Source: CoinglassAs shown above, the accumulated seven-day funding rate is slightly positive for Bitcoin and Ether. Data indicates slightly higher demand from longs (buyers), but nothing that would force traders to close their positions. For instance, a positive 0.15% weekly rate equals 0.6% per month, thus unlikely to cause harm.On the other hand, altcoins’ 7-day perpetual futures funding rate was -0.30%. This rate is equivalent to 1.2% per month and indicates higher demand from shorts (sellers).Signs of weak retail demand as indicated by OKX Tether data and the negative funding rate on altcoins are a signal that traders are unwilling to buy at the critical $1.65 trillion crypto market capitalization. Buyers seem to be waiting for further dips before stepping in, so further price corrections will likely follow.The views and opinions expressed here are solely those of the author and do not necessarily reflect the views of Cointelegraph. Every investment and trading move involves risk. You should conduct your own research when making a decision.

Čítaj viac
Descending channel pattern and weak futures data continue to constrain Ethereum price

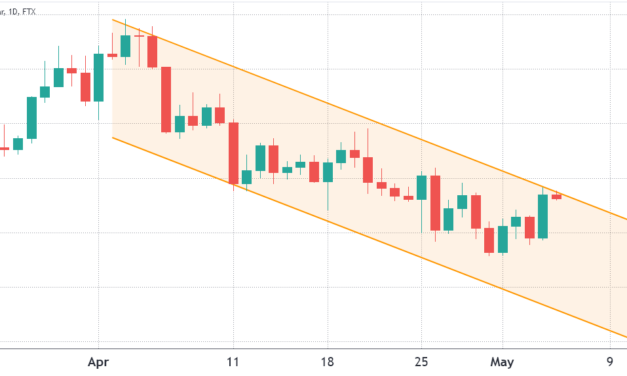
Despite bouncing from a 45-day low on April 30, Ether (ETH) price is still stuck in a descending channel and the subsequent 9% gain over the past four days was just enough to get the altcoin to test the pattern’s $2,870 resistance.Ether/USD price at FTX. Source: TradingViewFederal Reserve monetary policy continues to be a major influence on crypto prices and this week’s volatility is most likely connected to comments from the FOMC. On May 4, the United States Federal Reserve raised its benchmark overnight interest rate by half a percentage point, which is the biggest hike in 22 years. Although it was a widely expected and unanimous decision, the monetary authority said it would reduce its $9 trillion asset base starting in June.Chairman Jeremy Powell explained that the Federal Reserve is determined to restore price stability even if that means hurting the economy with lower business investment and household spending. Powell also dismissed the importance of the gross domestic product decline over the first three months of 2022.Even though Ether’s price has corrected by 14% over the course of a month, the network’s value locked in smart contracts (TVL) increased by 7% in 30 days to 25.2 million Ether, according to data from DefiLlama. For this reason, it is worth exploring if the price drop below $3,000 impacted derivatives traders’ sentiment.ETH futures show traders are still bearishTo understand whether the market has flipped bearish, traders must analyze the Ether futures contracts’ premium, also known as the basis rate. Unlike a perpetual contract, these fixed-calendar futures do not have a funding rate, so their price will differ vastly from regular spot exchanges.One can gauge the market sentiment by measuring the expense gap between futures and the regular spot market.Ether 3-month futures premium. Source: Laevitas.chTo compensate for traders’ deposits until the trade settles, futures should trade at a 5% to 12% annualized premium in healthy markets. Yet, as displayed above, Ether’s annualized premium has been below such a threshold since April 5.Despite a slight improvement over the past 24 hours, the current 3.5% basis rate is usually deemed bearish as it signals a lack of demand for leverage buyers.Related: Fed hikes interest rates by 50 basis points in effort to combat inflationSentiment in options markets worsenedTo exclude externalities specific to the futures instrument, traders should also analyze the options markets. For instance, the 25% delta skew compares similar call (buy) and put (sell) options. This metric will turn positive when fear is prevalent because the protective put options premium is higher than similar risk call options. The opposite holds when greed is prevalent, causing the 25% delta skew indicator to shift to the negative area.Ether 30-day options 25% delta skew. Source: Laevitas.chA 25% skew indicator range between negative 8% and positive 8% is usually considered a neutral area. However, the metric has been above such a threshold since April 16 and is currently at 14%.With option traders paying higher premiums for downside protection, it is safe to conclude that the sentiment has worsened in the past 30 days. Presently, there is a growing sense of bearish sentiment in the market.Of course, none of this data can predict if Ether will continue to respect the descending channel, which currently holds a $2,950 resistance. Still, considering the current derivatives data, there is reason to believe that an eventual pump above $3,000 will likely be short-lived.The views and opinions expressed here are solely those of the author and do not necessarily reflect the views of Cointelegraph. Every investment and trading move involves risk. You should conduct your own research when making a decision.

Čítaj viac
3 key metrics signal Terra (LUNA) price is preparing for a recovery

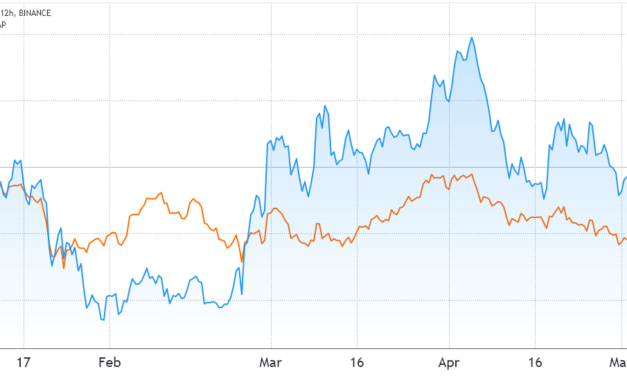
Terra (LUNA) price lost 31% over the past four weeks, erasing all of the gains accrued year-to-date and even though the token continues to outperform the broader cryptocurrency market by 20%, Terra is struggling to hold above the $85 support.Previously, a few bullish catalysts were Terra’s USD (UST) stablecoin flipping Binance USD (BUSD) to become the third-largest stablecoin on April 18 and the April 26 announcement that Fireblocks, a digital asset custody platform had seen institutional clients invest over $250 million into the Terra decentralized finance (DeFi) ecosystem. This positive newsflow was not enough to instill confidence in Terra investors and there were also a few changes that might have partially subdued the continuous inflow of deposits on the network. Luna/USD at Binance (blue) vs. Total crypto capitalization (orange). Source: TradingViewFor instance, on May 1, Anchor Protocol, Terra’s largest DeFi application by deposits, introduced a semi-dynamic adjustment to its previously fixed 20% annualized percentage yield (APY). The Anchor earn rate was cut to 18% and going forward it will be reviewed monthly.TVL grew, but Dapp transactions declinedTerra’s main decentralized application metric increased by 41% over the past month as the network’s total value locked (TVL) hit an all-time high at 254 million LUNA.Terra network Total Value Locked, LUNA. Source: DefiLlamaNotice how Terra’s DApp deposits saw a 77% jump in 2022, reaching the equivalent of $21.2 billion. As a comparison, Binance Chain’s TVL currently stands at $9.8 billion, a 9% increase in BNB terms year-to-date. Avalanche, another DApp scaling solution competitor, saw a 28% TVL increase in AVAX terms to a $7.9 billion value.To confirm whether DApp use has effectively increased, investors should also analyze the transaction count within the ecosystem.Anchor transaction count. Source: Terrasco.peAnchor holds a $16.6 billion TVL, equivalent to 78% of Terra’s decentralized application deposits. The protocol averaged 70,150 transactions per day last week, which is 15% below the levels seen in early April.Astroport transaction count. Source: Terrasco.peAstroport, an automated market-making project, holds the number two position in TVL terms within Terra’s ecosystem, with $1.6 billion worth of deposits. Notably, last week, an average of 50,650 transactions per day took place, a 30% decline from the previous month.Terrraswap transaction count. Source: Terrasco.peAccording to Terrascope data, the Terraswap decentralized asset liquidity application had 31,400 average daily transactions over the past week. The number is similar to the levels seen in early April.Derivatives data show no sign of distressSolana futures aggregate open interest. Source: CoinglassThe reduced use of Terra DApps does not seem to have impacted derivatives traders’ appetite. The above chart shows LUNA futures contracts open interest holding steady at $706 million. This data is critical because a smaller number of futures contracts could limit arbitrage desks and institutional investors’ activity.Furthermore, Terra has the third-largest open interest behind Bitcoin (BTC) and Ether (ETH). As a comparison, Solana (SOL) and XRP futures contracts hold a $660 million open interest.LUNA Fundamentals are still solidEven though it seems impossible to pinpoint the cause of LUNA’s price drop, the decrease in the network’s decentralized apps use can partially explain the movement. However, the increase in its smart contract deposits, as shown by the TVL increase and sound interest from derivatives traders point to a price recovery in the near-term.The data suggests that Terra holders are not concerned about the 31% price correction and are more focused on the ecosystem’s growth versus its competitors. As long as these metrics remain healthy, investors are not likely to sell at a loss.The views and opinions expressed here are solely those of the author and do not necessarily reflect the views of Cointelegraph. Every investment and trading move involves risk. You should conduct your own research when making a decision.

Čítaj viac
Bitcoin pushes to $40K, but are bulls strong enough to win Friday’s $735M options expiry?

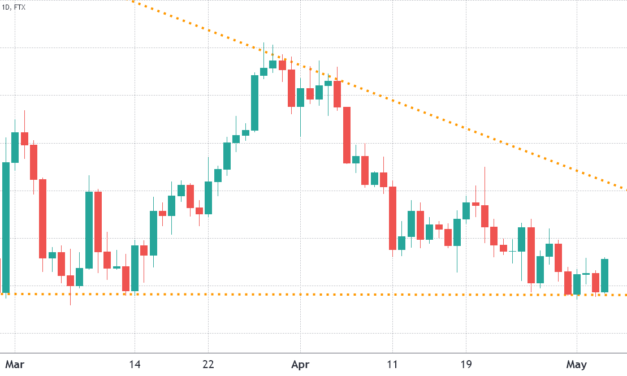
Bitcoin (BTC) price has been stuck in a falling wedge pattern for the past two months and during this time it has tested the $37,600 support on multiple instances. Adding to this “bearish” price action, BTC is down 16% year-to-date, which is in line with the Russell 2000s performance. Bitcoin/USD 1-day chart at FTX. Source: TradingViewThe real driver of Bitcoin’s current price action is investors’ concerns about worsening macroeconomic conditions. Professional investors are worried about the impact of the U.S. Federal Reserve’s tightening economic policies and on May 3, billionaire hedge fund manager Paul Tudor Jones said that the environment for investors is worse than ever because the monetary authority is raising interest rates when financial conditions are already worsening.On May 4, CNBC reported that the European Union implemented new sanctions to phase out Russian crude oil imports within six months and European Commission President Ursula von der Leyen said, “This will be a complete import ban on all Russian oil, seaborne and pipeline, crude and refined.”For these reasons, traders are increasingly concerned about the potential impact of a global macroeconomic crisis on cryptocurrency markets. If global economies enter a recession, investors will seek protection by moving away from risk-on asset classes like Bitcoin.Bulls did not expect prices below $40,000The open interest for the May 6 options expiry in Bitcoin is $735 million, but the actual figure will be lower since bulls were caught by surprise as BTC moved below $40,000. Bitcoin options aggregate open interest for May 6. Source: CoinGlassThe 1.22 call-to-put ratio reflects the $405 million call (buy) open interest against the $330 million put (sell) options. Nevertheless, as Bitcoin stands near $39,000, 89% of the bullish bets will likely become worthless. Meanwhile, if Bitcoin’s price remains below $39,000 on May 6, bears will have $100 million worth of these put (sell) options available. This difference happens because there is no use in a right to sell Bitcoin at $36,000 if it trades above that level on expiry.Related: BTC price gains 4% pre-Fed as MicroStrategy vows to protect Bitcoin from $21K crashBears can secure a $145 million profit on FridayBelow are the four most likely scenarios based on the current price action. The number of options contracts available on May 6 for call (buy) and put (sell) instruments varies, depending on the expiry price. The imbalance favoring each side constitutes the theoretical profit:Between $37,000 and $39,000: 500 calls (buy) vs. 4,300 puts (sell). The net result favors bears by $145 million.Between $39,000 and $40,000: 1,200 calls (buy) vs. 2,500 puts (sell). Bears have a $50 million advantage.Between $40,000 and $41,000: 3,800 calls (buy) vs. 1,100 puts (sell). The net result favors bulls by $105 million.Between $41,000 and $42,000: 5,300 calls (buy) vs. 700 puts (sell). Bulls boost their gains to $190 million.This crude estimate considers the call options used in bullish bets and the put options exclusively in neutral-to-bearish trades. Even so, this oversimplification disregards more complex investment strategies.For example, a trader could have sold a call option, effectively gaining negative exposure to Bitcoin above a specific price, but unfortunately, there’s no easy way to estimate this effect.Bitcoin bears need to sustain the price below $39,000 on May 6 to secure a $145 million profit. On the other hand, bulls can avoid a loss by pushing BTC above $40,000, enough to net them $100 million in gains. Considering the bearish macroeconomic conditions, bears seem better positioned for May 6’s expiry.The views and opinions expressed here are solely those of the author and do not necessarily reflect the views of Cointelegraph. Every investment and trading move involves risk. You should conduct your own research when making a decision.

Čítaj viac

3 reasons why Bitcoin price is clinging to $38,000

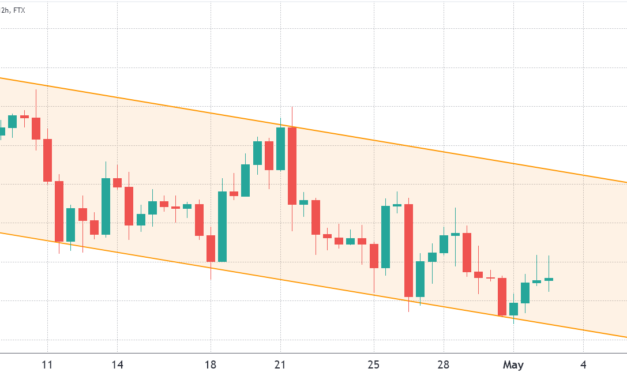
Bitcoin (BTC) has been unable to break from the 26-day-long descending channel. Investors are uncomfortable holding volatile assets after the United States Federal Reserve pledged to reduce its $9 trillion balance sheet.While inflation has been surging worldwide, the first signs of an economic downturn showed as the United Kingdom’s retail sales fell 1.4% in March. Moreover, Japan’s industrial production dropped 1.7% in March. Lastly, the U.S. gross domestic product fell 1.4% in the first quarter of 2022.Bitcoin/USD price at FTX. Source: TradingViewThis bearish macroeconomic scenario can partially explain why Bitcoin has been on a downtrend since early April. Still, one needs to analyze how professional traders position themselves, and derivatives markets tprovide some excellent indicators.The Bitcoin futures premium is mutedTo understand whether the current bearish trend reflects top traders’ sentiment, one should analyze Bitcoin’s futures contracts premium, which is also known as a “basis.” Unlike a perpetual contract, these fixed-calendar futures do not have a funding rate, so their price will differ vastly from regular spot exchanges. A bearish market sentiment causes the three-month futures contract to trade at a 5% or lower annualized premium (basis).On the other hand, a neutral market should present a 5% to 12% basis, reflecting market participants’ unwillingness to lock in Bitcoin for cheap until the trade settles.Bitcoin 3-month futures premium. Source: laevitas.chThe above chart shows that Bitcoin’s futures premium has been below 5% since April 6, indicating that futures market participants are reluctant to open leverage long (buy) positions.Options traders remain in the “fear” zoneTo exclude externalities specific to the futures instrument, traders should also analyze the options markets. The 25% delta skew compares equivalent call (buy) and put (sell) options. The indicator will turn positive when “fear” is prevalent because the protective put options premium is higher than the call options.The opposite holds when market makers are bullish, causing the 25% delta skew to shift to the negative area. Readings between negative 8% and positive 8% are usually deemed neutral.Deribit Bitcoin 30-day options 25% delta skew. Source: laevitas.chThe above chart shows that Bitcoin option traders have been signaling “fear” since April 8, just as BTC broke below $42,500 following a 10% drop in four days. Of course, such a metric could be reflecting the 16% negative BTC price performance over the past month, so not exactly a surprise.Margin markets sustain its optimismMargin trading allows investors to borrow cryptocurrency and leverage their trading position, thus potentially increasing returns. For example, a trader can buy cryptocurrencies by borrowing Tether (USDT) to increase their exposure.On the other hand, Bitcoin borrowers can only short the cryptocurrency as they bet on its price decline. Unlike futures contracts, the balance between margin longs and shorts isn’t always matched.OKEx USDT/BTC margin lending ratio. Source: OKExThe above chart shows that traders have been borrowing more Bitcoin recently, as the ratio decreased from 20 on April 30 to the current 12.5. The higher the indicator, the more confident professional traders are with Bitcoin’s price.Despite some additional Bitcoin borrowing activity aimed at betting on the price downturn, margin traders remain mostly optimistic, according to the USDT/BTC lending ratio.Bitcoin traders fear further correction as macroeconomic indicators deteriorate because investors expect a potential crisis impact on riskier markets. However, there are no signs of leverage short (negative) bets using margin or futures, meaning sellers lack conviction at $38,000.The views and opinions expressed here are solely those of the author and do not necessarily reflect the views of Cointelegraph. Every investment and trading move involves risk. You should conduct your own research when making a decision.

Čítaj viac

Získaj BONUS 8 € v Bitcoinoch

nakup bitcoin z karty

Registrácia Binance

Burza Binance

Aktuálne kurzy