Autor Cointelegraph By Marcel Pechman

Data challenges the DXY correlation to Bitcoin rallies and corrections ‘thesis’

Presently, there seems to be a general assumption that when the U.S. dollar value increases against other global major currencies, as measured by the DXY index, the impact on Bitcoin (BTC) is negative.Traders and influencers have been issuing alerts about this inverse correlation, and how the eventual reversal of the movement would likely push Bitcoin price higher.Analyst @CryptoBullGems recently reviewed how the DXY index looks overbought after its relative strength index (RSI) passed 78 and could be the start of a retrace for the dollar index.This is literally the only thing you need to look at:The $DXY is crazy overbought right now and due a correction. $BTC is the most oversold it ever has been on the monthly timeframe. BITCOIN AND THE DOLLAR SHARE AN INVERSE CORRELATION. $BTC will rise and fiat will fall. pic.twitter.com/MpZniivpj0— The London Crypto (@SerLondonCrypto) September 6, 2022Moreover, technical analyst @1coin2sydes presents a bearish double top formation on the DXY chart, while simultaneously Bitcoin forms a double bottom, a bullish indicator.Very beautiful Inverse Correlation between the Dollar Index DXY and Bitcoin BTC!As #DXY forms a Double top (which maybe a reversal of its Trend) – Heading Down!#BTC forms a Double Bottom (which may serve also as a trend reversal) – Heading UP!#2sydes pic.twitter.com/A4eZSfJG82— 2sydes.eth (,) (@1coin2sydes) September 12, 2022

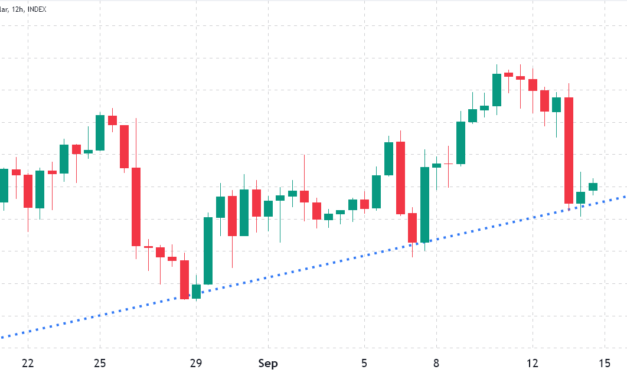
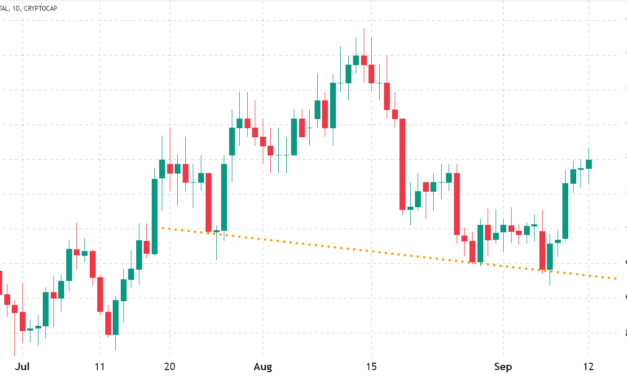
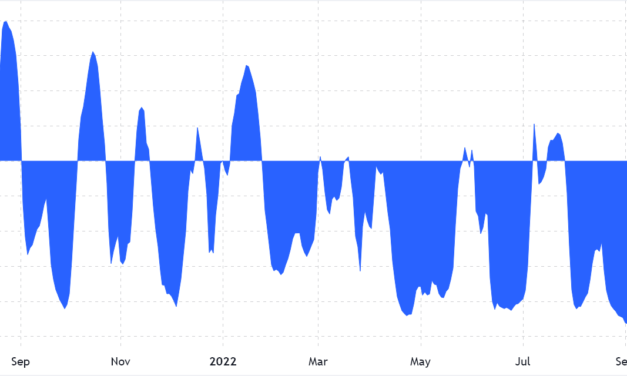
Correlation changes over time, despite the general inverse trendThe periods of inverse movements between Bitcoin and the DXY index have never exceeded 36 days. The correlation metric ranges from a negative 1, meaning select markets move in opposite directions, to a positive 1, which reflects a perfect and symmetrical movement. A disparity or a lack of relationship between the two assets would be represented by 0.Dollar Index DXY 20-day correlation versus Bitcoin. Source: TradingViewThe metric has been below negative 0.6 since Aug. 19, indicating that both DXY and Bitcoin have generally followed an inverse trend. In fact, the longest-ever period of inverse correlation has been April 14 to May 20.Saying that Bitcoin holds an inverse correlation to the DXY index would be statistically incoherent since it had a negative 0.6 or lower in less than 30% of the days since 2021.The dollar strengthened after the FOMC minutesOn Aug. 17, officials at the United States Federal Reserve indicated that additional interest rate hikes would be needed until inflation eased substantially, according to the minutes from the July 27 meeting.Dollar Index DXY (orange, right) vs. Bitcoin (blue). Source: TradingViewThe report caused the U.S. dollar to appreciate versus major global currencies, as the market gave the Fed a vote of confidence. Meanwhile, Bitcoin dropped 11% in two days to $20,800, reinforcing the inverse correlation thesis.Still, a correlation does not imply causation, meaning it is impossible to conclude that the DXY’s positive performance negatively impacted the Bitcoin price after the minutes from the Federal Reserve meeting were released.Correlation should not be used to predict short-term movesEven though pundits and influencers often use 20-day correlation data to explain daily price movements, one should analyze a more extended timeframe to understand the potential impacts of the DXY index on Bitcoin price.Dollar Index DXY (orange, right) vs. Bitcoin (blue), 2021. Source: TradingViewFor instance, 2021 presented some positive correlation between the DXY dollar index and Bitcoin. Maybe some of the movements were anticipated by either side, but no extended periods of inverse correlation were present.More importantly, events solely relevant to the cryptocurrency might have distorted the metric, such as the first U.S. Bitcoin exchange-traded fund launch on Oct. 19, 2021. Other examples include Tesla announcing a $1.5 billion Bitcoin investment on Feb. 8, 2021.Moreover, analysts point to the Chinese crackdown on mining in May 2021 as the culprit for the market downturn below $40,000. Those events could not have been anticipated by the DXY dollar index, so any ongoing correlation might have had little impact during those periods.Consequently, those waiting for a turnaround on the DXY index before placing bets on a Bitcoin rally have no statistical backing. Whenever positive (or negative) developments specific to the cryptocurrency industry take place, the historical correlation loses relevance.The views and opinions expressed here are solely those of the author and do not necessarily reflect the views of Cointelegraph. Every investment and trading move involves risk. You should conduct your own research when making a decision.

Čítaj viac

Volatility expected as $490M in ETH options expire shortly after the Ethereum Merge

Given the current state of the wider crypto market, some traders might be surprised to learn that Ether (ETH) has been trading in an ascending trend for the past 17 days. While the entire cryptocurrency market experienced a 10% decline on Sept. 13, Ether price held firm near the $1,570 support level.Ether/USD price index. Source: TradingViewIn less than 12 hours the Ethereum network is scheduled to undergo its largest ever upgrade and the possibility of extreme volatility should not be ignored. The transition to a Proof-of-Stake network will be a game changer for multiple reasons, including a 98.5% cut in energy use and reduced coin inflation.During an upgrade, there is always the risk of multiple malfunctions, especially in more complex systems like the Ethereum Virtual Machine processing. Even if the upgrade has been relatively smooth on previous testnet versions, it is impossible to predict the outcome of the decentralized applications and second-layer solutions plugged into Ethereum’s ecosystem.That is precisely why the $490 million Ether options expiry on Aug. 16 will put a lot of price pressure on both sides, even though bulls seem slightly better positioned as Ether nears $1,600.Most bearish bets are placed below $1,600Ether’s failure to break the $2,000 resistance on Aug. 14 and its subsequent plunge to $1,420 on Aug. 29 gave the bears the signal to expect continuation of the downtrend. That becomes evident as only 12% of the put (sell) options for Sept. 16 have been placed above $1,600. Thus, Ether bulls are better positioned for the expiry of $490 million weekly options.Ether options aggregate open interest for Sept. 16. Source: CoinGlassA broader view using the 1.06 call-to-put ratio shows a relatively balanced situation with bullish bets (calls) open interest at $252 million versus the $238 million put (sell) options. Nevertheless, as Ether currently stands near $1,600, both sides have similar odds of moving the needle.If Ether price remains below $1,600 at 8:00 am UTC on Sept. 16, only $27 million worth of these call (buy) options will be available. This difference happens because there is no use in the right to buy Ether at $1,600 or $1,700 if it trades below that level on expiry.Bears could pocket a $100 million profitBelow are the four most likely scenarios based on the current price action. The number of options contracts available on Sept. 16 for call (bull) and put (bear) instruments varies, depending on the expiry price. The imbalance favoring each side constitutes the theoretical profit:Between $1,400 and $1,500: 33,000 calls vs. 2,600 puts. The net result favors bears by $100 million.Between $1,500 and $1,700: 29,600 calls vs. 29,000 puts. The net result is balanced between bulls and bears.Between $1,700 and $1,800: 49,200 calls vs. 3,800 puts. The net result favors bulls by $80 million.Between $1,800 and $1,900: 81,400 calls vs. 700 puts. Bulls increase their gains to $145 million.This crude estimate considers the call options used in bullish bets and the put options exclusively in neutral-to-bearish trades. Even so, this oversimplification disregards more complex investment strategies.Macroeconomic turmoil might have helped ETH bearsEther bulls need to sustain the price above $1,500 on Sept. 16 to balance the scales and avoid a potential $100 million loss. However, Ether bulls were unlucky on Sept. 12 after the United States stock markets fell by $1.6 trillion on Sept. 13 due to a hotter-than-expected inflation report.There’s absolutely no way to predict the outcome of Ethereum Merge, let alone its price impact. However, analysis suggests these three indicators should be watched by traders during the Merge event. One can never guess the consequences of unexpected delays or even the positive impact of a smooth transition because investors could have priced in the Merge in advance, triggering a “sell the news” event. Consequently, both bulls and bears still have a shot on the Sept. 16 weekly options expiry. The views and opinions expressed here are solely those of the author and do not necessarily reflect the views of Cointelegraph. Every investment and trading move involves risk. You should conduct your own research when making a decision.

Čítaj viac

Bitcoin margin long-to-short ratio at Bitfinex reach the highest level ever

Sept. 12 will leave a mark that will probably stick for quite a while. Traders at the Bitfinex exchange vastly reduced their leveraged bearish Bitcoin (BTC) bets and the absence of demand for shorts could have been caused by the expectation of cool inflation data.Bears may have lacked confidence, but August’s U.S. Consumer Price Index (CPI) came in higher than market expectations and they appear to be on the right side. The inflation index, which tracks a broad basket of goods and services, increased 8.3% over the previous year. More importantly, the energy prices component fell 5% in the same period but it was more than offset by increases in food and shelter costs.Soon after the worse-than-expected macroeconomic data was released, U.S. equity indices took a downturn, with the tech-heavy Nasdaq Composite Index futures sliding 3.6% in 30 minutes. Cryptocurrencies accompanied the worsening mood, and Bitcoin price dropped 5.7% in the same period, erasing gains from the previous 3 days.Pinpointing the market downturn to a single inflationary metric would be naive. A Bank of America survey with global fund managers had 62% of respondents saying that a recession is likely, which is the highest estimate since May 2020. The research paper collected data on the week of Sept. 8 and was led by strategist Michael Hartnett.Interestingly, as all of this takes place, Bitcoin margin traders have never been so bullish, according to one metric.Margin traders flew away from bearish positionsMargin trading allows investors to leverage their positions by borrowing stablecoins and using the proceeds to buy more cryptocurrency. On the other hand, when those traders borrow Bitcoin, they use the coins as collateral for shorts, which means they are betting on a price decrease.That is why some analysts monitor the total lending amounts of Bitcoin and stablecoins to understand whether investors are leaning bullish or bearish. Interestingly, Bitfinex margin traders entered their highest leverage long/short ratio on Sept. 12.Bitfinex margin Bitcoin longs/shorts ratio. Source: TradingViewBitfinex margin traders are known for creating position contracts of 20,000 BTC or higher in a very short time, indicating the participation of whales and large arbitrage desks.As the above chart indicates, on Sept. 12, the number of BTC/USD long margin contracts outpaced shorts by 86 times, at 104,000 BTC. For reference, the last time this indicator flipped above 75, and favored longs, was on Nov. 9, 2021. Unfortunately, for bulls, the result benefited bears as Bitcoin nosedived 18% over the next 10 days.Derivatives traders were overly excited in November 2021To understand how bullish or bearish professional traders are positioned, one should analyze the futures basis rate. That indicator is also known as the futures premium, and it measures the difference between futures contracts and the current spot market at regular exchanges.Bitcoin 3-month futures basis rate, Nov. 2021. Source: Laevitas.chThe 3-month futures typically trade with a 5% to 10% annualized premium, which is deemed an opportunity cost for arbitrage trading. Notice how Bitcoin investors were paying excessive premiums for longs (buys) during the rally in November 2021, the complete opposite of the current situation.On Sept. 12, the Bitcoin futures contracts were trading at a 1.2% premium versus regular spot markets. Such a sub-2% level has been the norm since Aug. 15, leaving no doubts regarding traders’ lack of leverage buying activity.Related: This week’s Ethereum Merge could be the most significant shift in crypto’s historyPossible causes of the margin lending ratio spikeSomething must have caused short-margin traders at Bitfinex to reduce their positions, especially considering that the longs (bulls) remained flat across the 7 days leading to Sept. 12. The first probable cause is liquidations, meaning the sellers had insufficient margin as Bitcoin gained 19% between Sept. 6 and 12.Other catalysts might have led to an unusual imbalance between longs and shorts. For instance, investors could have shifted the collateral from Bitcoin margin trades to Ethereum, looking for some leverage as the Merge approaches.Lastly, bears could have decided to momentarily close their margin positions due to the volatility surrounding the U.S. inflation data. Regardless of the rationale behind the move, there is no reason to believe that the market suddenly became extremely optimistic as the futures markets’ premium paints a very different scenario from November 2021.Bears still have a glass-half-full reading as Bitfinex margin traders have room to add leverage short (sell) positions. Meanwhile, bulls can celebrate the apparent lack of interest in betting on prices below $20,000 from those whales.The views and opinions expressed here are solely those of the author and do not necessarily reflect the views of Cointelegraph. Every investment and trading move involves risk. You should conduct your own research when making a decision.

Čítaj viac

Bitcoin and altcoins pop to the upside, but upcoming macro events could cap the rally

The 13% gains in the six days leading to Sept. 12 brought the total crypto market capitalization closer to $1.1 trillion, but this was not enough to break the descending trend. As a result, the overall trend for the past 55 days has been bearish, with the latest support test on Sept. 7 at a $950 billion total market cap.Total crypto market cap, USD. Source: TradingViewAn improvement in traditional markets has accompanied the recent 13% crypto market rally. The tech-heavy Nasdaq Composite Index gained 6.2% since Sept. 6 and WTI oil prices rallied 7.8% since Sept. 7. This data reinforces the high correlation versus traditional assets and places the spotlight on the importance of closely monitoring macroeconomic conditions.The correlation metric ranges from a negative 1, meaning select markets move in opposite directions, to a positive 1, which reflects a perfectly symmetrical movement. A disparity or a lack of relationship between the two assets would be represented by 0.Nasdaq futures and Bitcoin/USD 50-day correlation. Source: TradingViewAs displayed above, the Nasdaq composite index and Bitcoin 50-day correlation currently stand at 0.74, which has been the norm throughout 2022.The FED’s Sept. 21 decision will set the moodStock market investors are anxiously awaiting the Sept. 21 U.S. Federal Reserve meeting, where the central bank is expected to raise interest rates again. While the market consensus is a third consecutive 0.75 percentage point rate hike, investors are looking for signs that the economic tightening is fading away.A report on the U.S. Consumer Price Index, a relevant inflation metric, is expected on Sept. 13 and on Sept. 15, investor attention will be glued to the U.S. retail sales and industrial production data.Currently, the regulatory sentiment remains largely unfavorable, especially after the enforcement director for the United States Securities and Exchange Commission (SEC), Gurbir Grewal, said the financial regulator would continue to investigate and bring enforcement actions against crypto firms.Altcoins rallied, but pro traders were resilient to leverage longsBelow are the winners and losers of last week’s total crypto market capitalization 8.3% gain to $1.08 trillion. Bitcoin (BTC) stood out with a 12.5% gain, which led its dominance rate to hit 41.3%, the highest since Aug. 9.Weekly winners and losers among the top-80 coins. Source: NomicsTerra (LUNA) jumped 107.7% after Terra approved a proposal on Sept. 9 for an additional airdrop of over 19 million LUNA tokens until Oct. 4.RavenCoin (RVN) gained 65.8% after the network hash rate reached 5.7 TH per second, the highest level since January 2022.Cosmos (ATOM) gained 24.6% after Crypto research firm Delphi Digital shifted the focus of its research and development arm to the Cosmos ecosystem on Sept. 8.Even with these gains, a single week of positive performance is not enough to interpret how professional traders are positioned. Those interested in tracking whales and market markers should analyze derivatives markets. Perpetual contracts, also known as inverse swaps, have an embedded rate usually charged every eight hours. Exchanges use this fee to avoid exchange risk imbalances.A positive funding rate indicates that longs (buyers) are demanding more leverage. However, the opposite situation occurs when shorts (sellers) require additional leverage, causing the funding rate to turn negative.Accumulated 7-day perpetual futures funding rate on Sept. 12. Source: CoinglassPerpetual contracts reflected a neutral sentiment as the accumulated funding rate was relatively flat in most cases. The only exceptions have been Ether (ETH) and Ether Classic (ETC), even though a 0.30% weekly cost to maintain a short (bear) position should not be deemed relevant. Moreover, those cases are likely related to the Ethereum Merge, the transition to a proof-of-stake network expected for Sept. 15.Related: Glimpses of positive momentum in an overall bearish market? ReportThe odds of a downtrend are still highThe positive 8.3% weekly performance can’t be deemed a trend change considering the move was likely tied to the recovery in traditional markets. Furthermore, one could assume that investors are likely to price in the risk of additional regulatory impact after Gary Gensler’s remarks.There is still uncertainty on potential macroeconomic triggers and traders are not likely to add risk ahead of important events like the FOMC interest rate decision. For this reason, bears have reason to believe that the prevailing longer-term descending formation will resume in the upcoming weeks.Professional traders’ lack of interest in leverage longs is evident in the neutral futures funding rate and this is another sign of negative sentiment from investors. If the crypto total market capitalization tests the bearish pattern support level at $940 million, traders should expect a 12.5% price drop from the current $1.08 billion level. The views and opinions expressed here are solely those of the author and do not necessarily reflect the views of Cointelegraph. Every investment and trading move involves risk. You should conduct your own research when making a decision.

Čítaj viac

3 major mistakes to avoid when trading cryptocurrency futures markets

Many traders frequently express some relatively large misconceptions about trading cryptocurrency futures, especially on derivatives exchanges outside the realm of traditional finance. The most common mistakes involve futures markets’ price decoupling, fees and the impact of liquidations on the derivatives instrument.Let’s explore three simple mistakes and misconceptions that traders should avoid when trading crypto futures. Derivatives contracts differ from spot trading in pricing and tradingCurrently, the aggregate futures open interest in the crypto market surpasses $25 billion and retail traders and experienced fund managers use these instruments to leverage their crypto positons.Futures contracts and other derivatives are often used to reduce risk or increase exposure and are not really meant to be used for degenerate gambling, despite this common interpretation.Some differences in pricing and trading are usually missed in crypto derivatives contracts. For this reason, traders should at least consider these differences when venturing into futures markets. Even well-versed derivatives investors from traditional assets are prone to making mistakes, so it’s important to understand the existing peculiarities before using leverage.Most crypto trading services do not use U.S. dollars, even if they display USD quotes. This is a big untold secret and one of the pitfalls that derivatives traders face that causes additional risks and distortions when trading and analyzing futures markets. The pressing issue is the lack of transparency, so clients don’t really know if the contracts are priced in stablecoin. However, this should not be a major concern, considering there is always the intermediary risk when using centralized exchanges.Discounted futures sometimes come with surprisesOn Sept. 9, Ether (ETH) futures that mature on Dec. 30 are trading for $22 or 1.3% below the current price at spot exchanges like Coinbase and Kraken. The difference emerges from the expectation of merge fork coins that could arise during the Ethereum merge. Buyers of the derivatives contract will not be awarded any of the potentially free coins that Ether holders may receive.Airdrops can also cause discounted futures prices since the holders of a derivatives contract will not receive the award, but that’s not the only case behind a decoupling since each exchange has its own pricing mechanism and risks. For example, Polkadot quarterly futures on Binance and OKX have been trading at a discount versus DOT price on spot exchanges. Binance Polkadot (DOT) quarterly futures premium. Source: TradingViewNotice how the futures contract traded at a 1.5% to 4% discount between May and August. This backwardation demonstrates a lack of demand from leverage buyers. However, considering the long-lasting trend and the fact that Polkadot rallied 40% from July 26 to Aug. 12, external factors are likely in play. The futures contract price has decoupled from spot exchanges, so traders must adjust their targets and entry levels whenever using quarterly markets.Higher fees and price decoupling should be consideredThe core benefit of futures contracts is leverage, or the ability to trade amounts that are larger than the initial deposit (collateral or margin).Let’s consider a scenario where an investor deposited $100 and buys (long) $2,000 USD worth of Bitcoin (BTC) futures using 20x leverage.Even though the trading fees on derivatives contracts are usually smaller than spot markers, a hypothetical 0.05% fee applies to the $2,000 trade. Therefore, entering and exiting the position a single time will cost $4, which is equivalent to 4% of the initial deposit. That might not sound much, but such a toll weighs as the turnover increases.Even if traders understand the additional costs and benefits of using a futures instrument, an unknown element tends to present itself only in volatile market conditions. A decoupling between the derivatives contract and the regular spot exchanges is usually caused by liquidations.When a trader’s collateral becomes insufficient to cover the risk, the derivatives exchange has a built-in mechanism that closes the position. This liquidation mechanism might cause drastic price action and consequent decoupling from the index price. Although these distortions will not trigger further liquidations, uninformed investors might react to price fluctuations that only happened in the derivatives contract. To be clear, the derivatives exchanges rely on external pricing sources, usually from regular spot markets, to calculate the reference index price.There is nothing wrong with these unique processes, but all traders should consider their impact before using leverage. Price decoupling, higher fees and liquidation impact should be analyzed when trading in futures markets.The views and opinions expressed here are solely those of the author and do not necessarily reflect the views of Cointelegraph. Every investment and trading move involves risk. You should conduct your own research when making a decision.

Čítaj viac

Získaj BONUS 8 € v Bitcoinoch

nakup bitcoin z karty

Registrácia Binance

Burza Binance

Aktuálne kurzy