Autor Cointelegraph By Kyle White

Research report outlines why the crypto market might be on the verge of a reversal

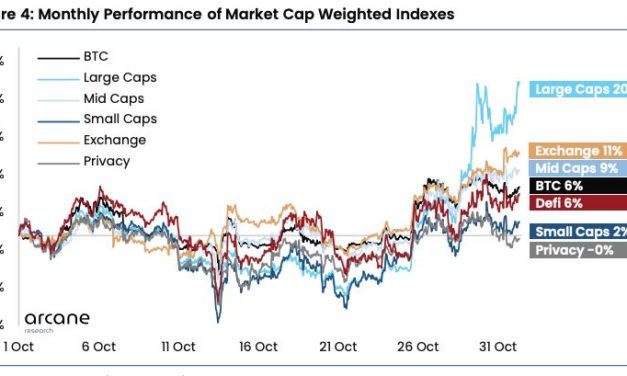
As November begins, analysts are busy dissecting the major market movements that occurred in October. While Bitcoin (BTC) stayed relatively unchanged with only 5.89% growth in October, Arcane Research senior analyst, Vetle Lunde mapped out the direction the market might take in the next few months.“Uptober,” a reference to Bitcoin’s bullish historical performance in the month of October, was a common theme across many threads on crypto Twitter and according to Lunde it appears to have happened. Data shows BTC and exchange tokens outperformed the large caps index up until Oct. 26. Elon Musk’s Twitter takeover helped push the large caps index above Bitcoin with a staggering 20% monthly gain. Dogecoin (DOGE) helped cement the large-cap strength by producing a 144% gain in the last seven days. Weighted index performance for October 2022 performance. Source: Arcane ResearchOctober’s Bitcoin spot market was driven by increased volume and lower volatility, while benefiting from a short squeeze that briefly invigorated the market. According to Lunde, the last week of October saw the largest short liquidation volume in crypto since July 26, 2021. While this activity helped push Bitcoin up by 6%, Ether (ETH) and Binance Coin (BNB) saw more substantial gains at 18% and 19% respectively. 7-day average BTC USD daily volume with and without Binance. Source: Arcane ResearchThe short squeeze helped give an overall boost but Lunde concluded that the momentum did not create a substantial change in BTC price. BTC spot volume is up 46% in the last seven days and the 30-day volatility index is at a 2-year low. Furthermore, the 7-day volatility index is sitting at 2.2%, whereas the yearly average is 3%. 30-Day and 7-Day volatility for BTC. Source: Arcane ResearchWhen comparing volatility to a previous short squeeze to the recent short squeeze, Lunde said:”The July 26 squeeze saw a daily high-low variation of 15% as markets hastily moved up, whereas the October 25 and October 26 moves saw daily high-low variations of 5% and 6%, respectively. Further, momentum has stopped, indicating that traders should brace for longer consolidation.”While Bitcoin is priced attractively, the best approach to this market is to dollar cost average in the short-term rather than using leverage, according to Lunde. Bitcoin has been experiencing uniquely low volatility and follows the US equities market closely so it is important to track Q3 earnings reports. Fed policy will continue to dictate Bitcoin priceFederal Reserve chairman Jerome Powell is set to speak after the Nov. 2 Federal Open Market Committee (FOMC) regarding U.S. monetary policy, inflation and the upcoming rate hike.According to Lunde there are two scenarios to watch for:”Scenario 1: Jerome Powell remains astute in combating inflation and prepares the market for further hikes. This is, in my opinion, the most plausible scenario. In this environment, I expect correlations between BTC and other asset classes to remain elevated and the now 4.5- month-long trading range to hold firm, with dampened activity, leading to a longer lasting opportune environment to stack sats.””Scenario 2: Jerome Powell provides subtle pivot hints. In this scenario, I see the correlated market environment softening. Last week, we saw how unique structural crypto-related market activity caused correlations to decline through a substantial short squeeze. Pivot anticipations will lead to similar reactions and revitalize BTC’s digital gold narrative.”Under the second scenario, some analysts believe that crypto could begin to decouple from U.S. equities. This reaction could mirror the crypto market’s reaction in mid-2020 that pushed the Bitcoin price over $20,000. What to expect in the long-termIn the longer-term, Lunde predicts that the adoption of Bitcoin and digital assets will continue to be an emerging trend. Pointing to a Fidelity survey that showed an increase in interest from institutional markets in 2022, Lunde remains bullish on BTC at the current price. Even though Bitcoin is seeing less on-chain transactions, increased participation from a clearer regulatory framework is possible in the long-term. A clearer framework could eventually emerge if the U.S. electorate starts to consider crypto policy when voting. Bitcoin’s muted growth, its correlation to equities and a sticky downtrend for nearly a year remains a threat, but many analysts are confident that Bitcoin’s current price is undervalued. The views and opinions expressed here are solely those of the author and do not necessarily reflect the views of Cointelegraph.com. Every investment and trading move involves risk, you should conduct your own research when making a decision.

Čítaj viac

Bitcoin on-chain data flashes early signs of the BTC bottom being in

While Bitcoin (BTC) price support may be psychological for some traders, the statistics behind BTC remaining over $20,000 for a week are strong indicators of price support or in other words, a new bear market floor. Multiple Bitcoin data points might be able to establish a $20,000 support level. Last week Bitcoin reached a high of $20,961. However, it never sustained its upward momentum as the rally fizzled out, failing to break $21,000 support. As a result of the rally as well as the rejection, Glassnode, in the most recent report, analyzes if Bitcoin is hammering out a bear market floor.Realized price distributionBitcoin’s realized price charts the average cost buyers paid for their BTC holdings. If the price of Bitcoin goes below a user’s realized price, they are technically experiencing an unrealized loss. For visual effect, the UTXO Realized Price Distribution shows the percentage of supply distributed across the acquisition price. The 2019 bear market shows that 30% of BTC’s total supply was concentrated within the realized price range. In April 2019, the price broke out above the realized price, signaling the start of a new bull market.Bitcoin UTXO realized price distribution in April 2019. Source: GlassnodeLooking at the current market and applying the same methodology, Bitcoin’s realized price is concentrating 20% of supply between $17,000 and $22,000. While this suggests that more redistribution may need to occur, the consolidation is significant and highlights a resilient holder base.Bitcoin UTXO realized price distribution in October 2022. Source: GlassnodeHow long until the breakout?Bitcoin’s valuation model may indicate how long until a breakout like in April 2019. Based on historical data, prior cycles have witnessed the realized price range lasting between 5.5 and 10 months. In the current cycle, Bitcoin has only been within range for ~3 months, meaning the next breakout may only happen after more months of sideways trading.Historic Bitcoin valuation model with realized price ranges. Source: GlassnodeRelated: BTC price sees ‘double top’ before FOMCLong term holders are still in profitUtilizing the realized price distribution in terms of long term holders versus short term holders may also provide insight. Currently, long term holders are the majority of the supply in profit meaning they have less stress to sell and if they did, they are in profit. The total amount of supply in profit is 56% whereas for long term holders, it is at 60%. Total supply in profit and long term holder supply in profit. Source: GlassnodeWhile previous market cycles have lasted longer than the current cycle, signs are positive for a repeat breakout. And with long term holders being an overwhelming majority of the supply in profit, sell pressure may be minimized in the event of upcoming sell-off events.The views and opinions expressed here are solely those of the author and do not necessarily reflect the views of Cointelegraph.com. Every investment and trading move involves risk, you should conduct your own research when making a decision.

Čítaj viac

Here is why strong post-Merge fundamentals could benefit Ethereum price

The shift of the Ethereum (ETH) blockchain to a proof-of-stake (PoS) protocol opened new opportunities for developers and investors to explore, including the burning of Ether. Now, Ethereum PoS transactions are validated through staking rather than mining. Staking impacts the supply and price dynamics of Ether in ways that are different from mining. Staking is expected to create deflationary pressure on Ether as opposed to mining that induces inflationary pressure. The increase in the total amount of funds locked in Ethereum contracts could also push its price up in the long term. This is because it affects one of the fundamental forces that determine its price, supply. The percentage of newly issued Ether versus burned Ether has increased by 1,164.06 ETH since the merge. This means since the merge, almost all new minted supply has been burnt through the new PoS Ethereum burn mechanism which is expected to turn deflationary when the network sees an uptick in use.According to Bitwise analyst Anais Rachel, “all the ETH issued since The Merge will have been taken out of circulation by the end of this week.” 1/ It’s likely that all ETH issued since The Merge will have been taken out of circulation by the end of this week pic.twitter.com/WqRASUwi4i— Anais Rachel (@Anais_Rchl) October 27, 2022While the graph covers the 43 days since the Ethereum merge, the tokenomics are set up to turn Ethereum deflationary. Ultrasound Money shows that the peak. The reduction is attributable to Ethereum’s movement from PoW to PoS. Total supply difference shows Ethereum is still inflationary with positive 1,376 ETH minted since the merge.Supply change post Ethereum merge. Source: Ultrasound MoneyAnkit Bhatia, CEO of the Sapien Network, explains how staking impacts supply. Bhatia told Cointelegraph: “The retail market would most likely acquire Ether from exchanges like Coinbase, which will probably offer the option for buyers to immediately stake their purchase and further reduce circulating supply.” There is evidence of an increase in locked Ether. For example, DeFiLama shows that over $31.78 billion worth of Ether is currently locked in smart contracts.Total Ether value locked. Source: DeFi LlamaIn addition to Ethereum’s PoS locked tokens, Token Terminal data provides a breakdown of staked tokens throughout the Ethereum ecosystem.Estimated locked tokens per project. Source: token terminalThe leading protocols include Uniswap, Curve, Aave, Lido and MakerDao. For example, the TVL on Lido is $6.8 billion while MakerDao has $8 billion. Showing an increased interest in proof-of-stake, Ether holders depositing to PoS are moving Lido to new heights. Lido’s TVL increased from $4.52 billion before the Merge news on July 13, 2022 to $6.8 billion at the time of writing.ETH deposited in Lido. Source: NansenAs October comes to an end, the TVL continues to increase as many investors lock Ether. DeFi protocols see an uptick in TVL and daily active users The TVL and DAUs of Uniswap have been increasing over time. In most cases, the rise in a protocol’s TVL is accompanied by increases in daily active users on the platform. The most likely cause of the increase in TVL and DAUs are the lucrative Ether staking rewards. TVL and DAUs for Uniswap. Source: token terminalAn increase in DAUs at Uniswap may trigger more Ether to burn due to an increase in transactions and it may also help take more Ether out of circulation as Uniswap TVL grows. The top pairing on Uniswap with Ether is USD Coin (USDC), which currently provides 34%+ APY.Top 10 Ether pairings on Uniswap V3 with APY. Source: Defi LlamaLucrative staking yieldsEther paired with stable coins on Uniswap is a top choice for liquidity providers. The pairing is generating at most 72.20% APY when looking at Ether paired with Tether (USDT). It is worth noting that some staking platforms that deal with liquid staking derivatives include Coinbase, Lido and Frax. In such cases, the yield is as high as 7% per year. Data from EthereumPrice.org shows that Lido pays 3.9% APY, Everstake 4.05%, Kraken 7% and Binance 7.8%.It is important to note that the rate of return also varies with the amount invested. Usually smaller amounts have higher APYs than larger amounts. The yield also depends on the protocol. For example, validators earn more than those who invest on crypto exchanges and pooled staking. However, validators are required to stake 32 ETH and constantly maintain their nodes, which is a reason platforms like Lido are helping smaller ETH holders earn. The increase in Ether’s TVL from increased yields, the move to PoS and DAUs on the top Ethereum DApps could eventually lead to an Ether rally.The views and opinions expressed here are solely those of the author and do not necessarily reflect the views of Cointelegraph.com. Every investment and trading move involves risk, you should conduct your own research when making a decision.

Čítaj viac

Bitcoin analysts map out the key bull and bear cases for BTC’s price action

Research has detailed Bitcoin’s recent record-low volatility and while traders expect an eventual price breakout, the Oct. 26 BTC price move to $21,000 is not yet being interpreted as confirmation that $20,000 has now become support. In a recent “The Week On-chain Newsletter,” Glassnode analysts mapped out a bull case and a bear case for BTC. According to the report, the bear case includes limited on-chain transaction activity, stagnant non-zero address growth and reduced miner profits present a strong Bitcoin sell-off risk but data also shows that long-term hodlers are more determined than ever to weather the current bear market. The bull case, on the other hand, entails an increase in whale wallets, outflow from centralized exchanges and hodling by longer term investors.Stalled new address growthOn-chain active address growth remains stagnant across the BTC network. A reduction in transactions translates to a decrease in utilization and user growth for the network, factors which could possibly hinder BTC price expansion. Bitcoin transactions of active addresses versus Bitcoin’s price. Source: GlassnodeNew addresses within the Bitcoin ecosystem that possess a non-zero address have also plateaued, a trend which also occurred in November 2018. Stalled growth in new non-zero addresses back in 2018, was followed by a BTC price dip and did not recover until January 2019 when this metric began to increase. New non-zero Bitcoin wallets. Source: GlassnodeRelated: Public Bitcoin miners hash rate is booming, but is it actually bearish for BTC price?Miner selling could trigger a new sell-offIn previous years, many BTC miners held on to large quantities of BTC in their reserves. However, since the onset of the bear market, many miners are selling BTC in order to cover their capital costs and operational expenses.With BTC mining production costs are rising amid a backdrop of falling revenues, miners are deleveraging by selling their newly mined BTC. Glassnode warned that that the current: “Deleveraging events of miners may lead to distribution into thin order books, historically light demand, and persistent macroeconomic uncertainty and liquidity constraints.” As the price of BTC drops and miners’ profitability shrinks, miners may be forced to liquidate more of their reserve Bitcoin holdings. Bitcoin balance in miner wallets. Source: GlassnodeWhales are accumulatingIn spite of the falling BTC prices many BTC whales that hold an excess of 10,000 BTC are possibly increasing their holdings even in bear market conditions. As shown in the chart below, they continue to accumulate BTC after distributing in April and September. Bitcoin accumulation trend chart. Source: GlassnodeBTC withdrawals from centralized exchange could reduce sell pressureFunds moved from centralized exchanges weakens immediate selling pressure on the market. Coinbase, one of the highest volume centralized exchanges, is seeing large amounts of BTC withdraws. When comparing the current BTC outflow from Coinbase to the post-March 2020 peak at the exchange, over 48% of the total BTC at the exchange has been transferred out. Glassnode points out that: “Coinbase has seen a very large-scale net withdrawal of -41.6k BTC this week… It is important to note that these outflows are based on our best estimated wallet clusters, and appear to be a combination of coins flowing into both investor wallets, and/or institutional grade custody solutions.”Bitcoin balance on Coinbase. Source: GlassnodeHodlers keep hodlingAccording to the Realized Cap HODL Waves metric, the total USD wealth held in BTC, valued at the time of each coin’s last transaction, is now disproportionately skewed to longer-term holders. The proportion of wealth held in coins that moved in the last 3-months is now at an all-time-low. The reciprocal observation is that wealth held by coins older than 3-months (increasingly held by Hodlers) is now at an all-time-high.Bitcoin HODL Waves. Source: GlassnodeWhile some Bitcoin analysts believe BTC’s low volatility during this period is “a calm before the storm” and the current macroeconomic and price surge of BTC may show the resolve of hodlers as the winning factor. The views and opinions expressed here are solely those of the author and do not necessarily reflect the views of Cointelegraph.com. Every investment and trading move involves risk, you should conduct your own research when making a decision.

Čítaj viac

Why is Bitcoin price up today?

Bitcoin price is up today, and a market-wide rally in crypto prices suggests that BTC and Ether (ETH) could be aiming to wrap up the month of October in the black. As of October 26, 2022, most major cryptocurrencies are posting single-digit gains. Bitcoin recorded a 5.15% price increase within the last 24 hours and a 5.48% gain within the last 7 days. While the current price is fluctuating, BTC is holding above the psychologically important $20,000 level. The following chart shows the BTC rally since October 24, 2022. BTC price. Source: CointelegraphStocks are beginning the day down as Bitcoin continues to remain over $20,000. Bitcoin’s momentum has continued for 3 days now and is seeing green candles today. The recent price spike pushed Bitcoin’s total market capitalization above the $1T mark and comes after months of narrow sideways trading range of $18,000 and $20,000. Hand in hand with Bitcoin’s growth, most major cryptocurrencies including Ethereum (ETH), Solana (SOL), Cardano (ADA), Polygon (MATIC), Ripple (XRP) and Tron (TRX) registered more than 10% price increases within the last 48 hours. There are several reasons for the crypto rally. The current rally in BTC and other major cryptocurrencies may indicate an increase in confidence in the market following several key developments; here we give details of the key drivers of the growth$1 billion in short positions were liquidated Since Bitcoin price crashed to $17,600 on June 18, the open interest of BTC futures contracts has been surging. The current price move triggered a wave of liquidations and one data point to keep an eye on is if we see a sharp reduction in aggregate open interest. Data shows that Bitcoin short liquidations accounted for $550 million in liquidations in the past 24 hours. $704 million in cross-crypto shorts were liquidated on Oct. 25, with the Oct. 26 tally so far standing at $275 million.Crypto liquidations chart. Source: CoinglassShort liquidations directly help push the Bitcoin price higher by forcing automated buy pressure. The current rally is seeing open interest gaining momentum after remaining consistent since October which explains much of the sideways trading as well as the current rally. Bitcoin options open interest. Source: CoinglassMacro movements are starting to turn in Bitcoin’s favor Investors’ confidence in the crypto market could also be rising due to their belief that the United States Federal Reserve could roll out smaller-sized interest rate hikes in the next two months. According to Macromicro, a firm that publishes investors’ consensus estimates on expected changes in interest rates, shows that interest rates may be lower than previously anticipated in the near future. Investors believe interest rates could fall. Source: MacromicroThe graph points to a possible slow down in the interest rate hikes. The public sentiment shows that future rates may fall and investors believe that this has created the possibility for a broad crypto market recovery. The S&P 500 provides a general overview for the economy in general. Currently, Bitcoin and the S&P 500 share a high correlation coefficient. Therefore if interest rates ease and the economy grows, Bitcoin could continue to rally if a similar turn-around were to take place in equities markets. The better the macro climate, the better for Bitcoin price. Related: Why is the crypto market up today?Stocks stage a multi-day rally and the UK gets a crypto friendly leader The selection of Rishi Sunak as the new UK prime minister appears to have boosted crypto investor sentiment. Sunak is a crypto advocate and once commissioned a royal NFT. As a result, the world expects him to make major reforms in the crypto sector. During his tenure as the Finance Minister under the leadership of Boris Johnson, Sunak indicated his willingness to make the UK a cryptocurrency hub.In April 2022 Sunak said:“It’s my ambition to make the UK a global hub for crypto asset technology, and the measures we’ve outlined today will help to ensure firms can invest, innovate and scale up in this country.”It is still too early to determine whether or not the October 26 rally is a sign of a trend change, but one thing is clear.Factors impacting Bitcoin price and the crypto market are clearly being driven by the forced unwinding of futures contracts, positive movement in macro markets and investors’ expectation that central bank policy and potential crypto regulatory frameworks will improve.The views and opinions expressed here are solely those of the author and do not necessarily reflect the views of Cointelegraph.com. Every investment and trading move involves risk, you should conduct your own research when making a decision.

Čítaj viac

Získaj BONUS 8 € v Bitcoinoch

nakup bitcoin z karty

Registrácia Binance

Burza Binance

Aktuálne kurzy