Autor Cointelegraph By Kyle White

Bitcoin slips under $17K, crypto stocks tumble in reaction to FTX bankruptcy

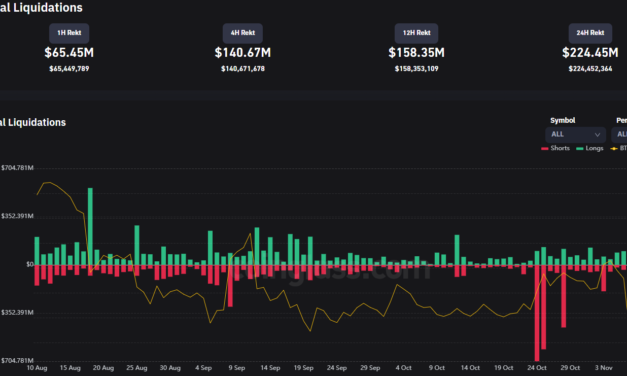
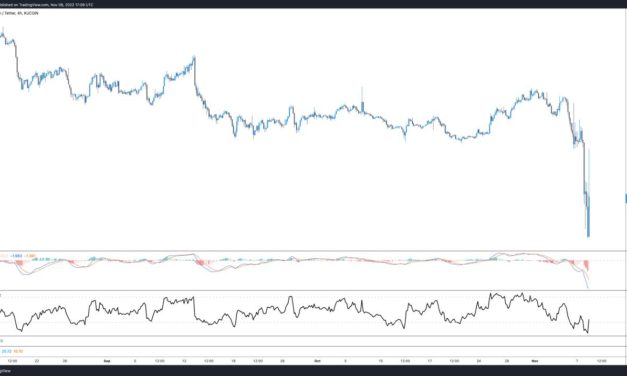
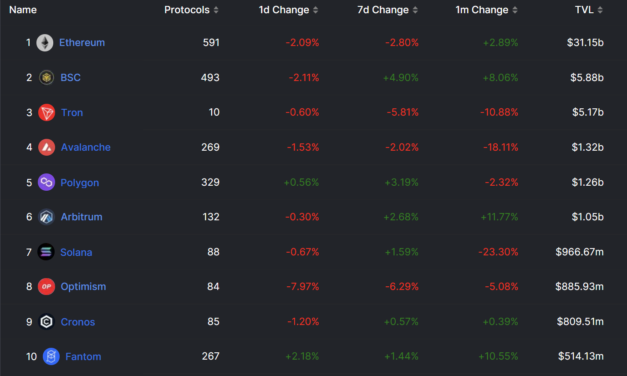
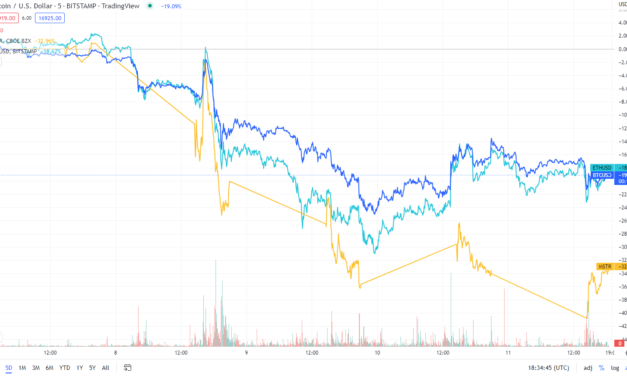
Bitcoin (BTC), Ether (ETH) and cryptocurrency-linked stocks like MicroStrategy are seeing a sharp downturn after news broke that FTX announced filing for Chapter 11 bankruptcy and Sam Bankman-Fried stepping down as CEO. Bitcoin, Ethereum and MicroStrategy comparison. Source: TradingViewCrypto-linked stocks declineMicroStrategy (MSTR), led by the outspoken advocate of Bitcoin Michael Saylor, is down 32.57% on Nov. 11 in a 5-day period. MicroStrategy holds about 130,000 Bitcoin and, therefore, its stock price is heavily correlated with BTC/USD. Meanwhile, the tech-heavy NASDAQ has gained 0.79%. Mining stocks have seen losses today, with the Hashrate Index Crypto Mining Stock Index showing a 0.14% loss at midday Nov. 11. Top miners’ market performance is much lower. Marathon (MARA) is down 4.95%, Riot (RIOT) is down 5.74%, and Hive (HIVE) is down 16.08%.Mining stock performance sorted by market cap. Source: Hashrate IndexMeanwhile, ETH price saw a 22% decrease this past week despite Ether becoming deflationary for the first time since the Merge. Over 8,000 Ether have been burned in the last seven days bringing the yearly rate to -0.354%.7-day Ether supply statistics. Source: ultra sound moneyIn addition to the FTX debacle hindering the Ether price, a mass amount of futures liquidations caused the price to hit a 4-month low of $1,070 this week.Bitcoin price back below June lows Data from Cointelegraph Markets Pro shows Bitcoin has lost 20% of its value in the past week as well. In addition, Bitcoin reached a new yearly low of $15,742 due to the FTX collapse. Bitcoin index. Source: CointelegraphMoreover, Bitcoin’s price crunch is leading miners to sell at an accelerated rate further increasing downward pressure. According to Charles Edwards, founder of the Capriole Fund, Bitcoin miners reached the red level on an open-source Bitcoin Miner Sell Pressure chart, which shows the most selling in almost five years. Bitcoin miners are in pain and selling more than they have in almost 5 years!Introducing: Bitcoin Miner Sell Pressure. A free, open-source indicator which tracks on-chain data to highlight when Bitcoin miners are selling more of their reserves than usual. pic.twitter.com/sXpxXXdUiW— Charles Edwards (@caprioleio) November 11, 2022The uptick in miner selling has also coincided with a Bitcoin whale moving 3,500 BTC for the first time since 2011.Is BTC close to bottoming?But analysts are mixed on whether BTC has bottomed. For instance, trader Mags sees two possibilities. He tweeted:”Bottom is in already ($15.5k) and we front run everyone waiting for $14k,” Otherwise, “We see a deep re-test & go way lower than $14k , maybe $11.5k – $12k.”Other popular analysts like John Wick don’t believe the bottom is in. “I gave everyone heads up and said if this lower end of the support broke that I would short again,”he said.” I also mentioned that I did not think the lows were in. I hope you put in your orders ahead of time”#BTC I gave everyone heads up and said if this lower end of the support broke that I would short again. I also mentioned that I did not think the lows were in.I hope you put in your orders ahead of time Dots again catching the move early and have predicted every move https://t.co/FVF0aMSq3X pic.twitter.com/ADlgNyBcC8— John Wick (@ZeroHedge_) November 11, 2022

The views and opinions expressed here are solely those of the author and do not necessarily reflect the views of Cointelegraph.com. Every investment and trading move involves risk, you should conduct your own research when making a decision.

Čítaj viac

Bitcoin price hits multi-year low at $15.6K, analysts expect further downside

Investor sentiment in the crypto market is floundering after Binance decided to nix its agreement with FTX to purchase the distressed cryptocurrency exchange. The events have sent Bitcoin to a new yearly low, while other altcoins have also taken a sharp downturn. Data from Cointelegraph shows Bitcoin (BTC) declining to $15,698 amid the chaos caused by FTX’s potential insolvency and the failure of the Binance deal. Analysts are turning to technical charts to try and find the next price path. Analyst expects downside continuation with brief support at $12KIndependent market analyst, CanteringClark said that BTC price could possibly find a short-term bounce at $15,000. Citing an assortment of indicators, the analysts suggested that Bitcoin could eventually settle around the $12,000 level.This is as clean of a continuation break as you are going to get, and this time we have a catalyst to really send it.15k might provide brief support, but the next major area for price to settle seems to be around the 12k handle.Cheap Bitcoin coming. pic.twitter.com/aDDMJIMRDh— Clark (@CanteringClark) November 9, 2022Will Bitcoin price drop below key multi-year moving averages?Analyst Caleb Franzen explained that the estimated moving average (EMA) is an indicator utilized to gauge price over a certain period of time. According to Franzen, if Bitcoin price continues to fall, it would be the first time in its history that the 52 week and 104 week EMA’s crossed below the 156 week EMA.#Bitcoin analysis using annual EMA’s on weekly candles:52-week EMA = 1 year104-week EMA = 2 years156-week EMA = 3 yearsWe’ve never seen the 52 or 104 EMA’s cross below 156 EMA, but we’re getting very close this cycle.Is a new first coming for $BTC? pic.twitter.com/knUwdAnqvb— Caleb Franzen (@CalebFranzen) November 9, 2022

Read more: Bitcoin sinks to new yearly low at $16.8K as FTX insolvency fears turn into contagionFear is growing and investors are selling at a lossDave the wave, an independent market analyst, highlights the growing market fear surrounding Bitcoin utilizing the logarithmic growth curve. According to Dave, if the monthly Bitcoin monthly candle closes below $16,907, Bitcoin’s growth will have detracted using this important long-term metric. The LGC being tested here.Let’s see where #btc closes on the monthly candle, which is of most significant for long-term models. pic.twitter.com/nM79cVNhjs— dave the wave (@davthewave) November 9, 2022

Citing the aSOPR on-chain metric, Glassnode analysis shows that spenders are selling at a 10% loss, something which has not happened since the June 2022 sell-off. The last 48hrs have seen a series of dramatic events unfold related to FTX and Binance exchangesIn response, we have seen #Bitcoin aSOPR drop to 0.9, signalling the average spender was realizing a 10% loss.This is as severe as June sell-off, when prices first fell to $17.5k. pic.twitter.com/p2vmhzEy8Y— glassnode (@glassnode) November 9, 2022

Analysts across the market were hopeful that Binance’s bid to acquire FTX would stop the bleeding of the current sell-off and now that the deal is nixed, investors are likely to amplify their risk-off stance. The views and opinions expressed here are solely those of the author and do not necessarily reflect the views of Cointelegraph.com. Every investment and trading move involves risk, you should conduct your own research when making a decision.

Čítaj viac

Why is Bitcoin price down today?

After topping the $21,500 mark on Nov. 4, Bitcoin (BTC) price is down by 14% on Nov. 8, reaching a new yearly low at $17,166 and most altcoins are following suit. While the Binance and FTX news initially caused an uptick in the market, the day turned south as various unconfirmed sources speculate that FTX’s losses could show a $6 billion deficit. This price decline breaks Bitcoin’s short-term correlation to the stock market, with the tech-heavy Nasdaq down only 0.32%, while the Dow Jones gained 0.48% on the back of investors’ optimism about the Nov. 8 U.S. Midterm elections. In the backdrop of the current volatility, $614 million in BTC longs are at risk of liquidation with over $224 million liquidated on Nov. 8. The fear for many is if the FTX situation is not resolved by Binance’s bid to purchase the exchange, a sharper sell-off in the market could trigger a liquidation cascade and send BTC price to new lows.BTC long versus short and liquidations. CoinglassLet’s investigate the main reasons why the Bitcoin price is down today. FTX capitulates after investors’ fears of a bank run sap its liquidityBitcoin price is reacting to the stress placed on the market by the FTX, reaching a yearly low after a period where many thought the bear market bottom had been found.The May 2022, Terra Luna implosion and ultimate collapse of LUNA Classic produced the first 7-week losing streak in Bitcoin’s history. The market is drawing parallels between the current FTX bank run, the perceived large budget hole and what happened to Terra Luna earlier this year.Rising interest rates in the US and abroad weigh on Bitcoin priceBased on the Consumer Price Index Report, inflation in the United States increased by 0.6% in September compared to the previous month. The Consumer Price Index report – the most widely followed barometer of inflationary pressure in the United States – climbed 8.2% in September compared to the same month a year ago, slightly more than the 8.1% predicted by experts. With the upcoming CPI reporting event on Nov. 10, Bitcoin saw a volatile 12% decline in 24 hours hitting record lows for 2022. Bitcoin price index. Source: CointelegraphSuppressed retail and institutional inflowWhile the number of consumers investing in crypto increased dramatically in 2021, prices are heavily affected by retail traders looking to make money on those shifts. And since June, Bitcoin has been flat, stuck largely in the $18,000 to $21,000 range after dropping from its November 2021 all-time high near $68,000. Going below the all year low may not instantly provoke investor interest. According to independent market analyst Jaran Mellerud, Bitcoin’s on-chain activity has been down for the whole year. Coinbase’s second-quarter trading volumes fell by around half to $217 billion. Between mid-June and mid-July, Binance reported a 50% drop in volume, while Kraken and Gemini saw 75% and 80% drops respectively. Binance US was one significant exception, reporting a 2% reduction after halting Bitcoin trading fees in June. FTX has witnessed a run on the bank, seeing a net outflow of $1.1 billion in the first week of November. FTX outflow chart. Source: DuneAnalyticsRelated: Why is the crypto market down today?Is there a chance for Bitcoin price to reverse course? The short-term uncertainties in cryptocurrencies do not appear to have changed institutional investors’ long-term outlook. According to BNY Mellon CEO Robin Vince, a poll commissioned by the bank found that 91% of institutional investors were interested in investing in tokenized assets in the following years. Around 40% of them already have cryptocurrency in their portfolios and approximately 75% are actively investing in digital assets or considering doing so.Worries about FTX’s potential insolvency are clearly instrumental in Bitcoin price sweeping a new yearly low. In the long term market participants still expect the price of Bitcoin to go up, especially as more banks and financial institutions are seemingly turning to digital cash for settlement purposes. The views and opinions expressed here are solely those of the author and do not necessarily reflect the views of Cointelegraph.com. Every investment and trading move involves risk, you should conduct your own research when making a decision.

Čítaj viac

FTX Token, BNB and Solana soar after Binance CEO inks potential deal to acquire FTX

FTX Token (FTT) and Solana’s SOL (SOL) endured a tough weekend of trading that saw altcoins take double-digit losses in the 15%–30% range, but the tide turned as news broke that Binance could be in the process of acquiring FTX.On Nov. 8, FTX CEO Sam Bankman-Fried first took to Twitter to announce a liquidity-sharing partnership with Binance. Changpeng “CZ” Zhao, CEO of Binance, agreed to step in and provide liquidity to what was beginning to look like a bank run. Bankman-Fried billed the development as user-focused and benefiting the entire industry.1) Hey all: I have a few announcements to make.Things have come full circle, and https://t.co/DWPOotRHcX’s first, and last, investors are the same: we have come to an agreement on a strategic transaction with Binance for https://t.co/DWPOotRHcX (pending DD etc.).— SBF (@SBF_FTX) November 8, 2022CZ also confirmed that Binance would step in to assist FTX with its liquidity crunch, with the CEO tweeting a letter of intent to purchase FTX. This afternoon, FTX asked for our help. There is a significant liquidity crunch. To protect users, we signed a non-binding LOI, intending to fully acquire https://t.co/BGtFlCmLXB and help cover the liquidity crunch. We will be conducting a full DD in the coming days.— CZ Binance (@cz_binance) November 8, 2022

Since Nov. 7, FTX has been experiencing liquidity issues after news broke surrounding Alameda Research’s odd-looking books. As FTX was fighting off withdrawals from their exchange, even freezing withdrawals at one point, Binance announced it would sell the entire FTT allocation it possessed. FTT 4-hour chart. Source: TradingViewDuring the disagreement between exchanges, FTT price dropped 38.7% from $25.71 to $15.76, and SOL price fell 31.23% to a five-month low at $25. After news of a potential agreement between FTX and Binance, FTT price bounced more than 20%, but it still trades well below what had been long-time support at $22. SOL 4-hour chart. Source: TradingViewThe price of BNB (BNB) has also suffered over the past few days, dropping by 14%, but the news of Binance agreeing to acquire FTX was followed by the exchange token staging a 25% rally within the hour. BNB price index. Source: CointelegraphRelated: Bitcoin price swings over $20K as Binance helps FTX ‘liquidity crunch’While the story is developing and many unknown variables remain, the broader crypto market has reacted positively to the news. Bitcoin (BTC) briefly rallied over $20,000 before slipping back into the $19,800 range, while Ether (ETH) continues to trade above $1,500. The views and opinions expressed here are solely those of the author and do not necessarily reflect the views of Cointelegraph.com. Every investment and trading move involves risk, you should conduct your own research when making a decision.

Čítaj viac

Traders expect 200% upside from MATIC, but does Polygon network data support that?

In the past year, Polygon (MATIC) has focused on growing their list of high-profile partners which includes luminaries like Disney, Starbucks and Robinhood. The recent announcements of partnerships with both Instagram and JPMorgan have speculators pushing the token price up nearly 200%. In addition to partnerships, blockchain adoption through network usage is important to analyze. Blockchain adoption can be analyzed by looking into daily active users of the blockchain, protocols using the technology, number of transactions and total locked value. Total value locked on Polygon rises above $1BTotal value locked (TVL) is one cryptocurrency indicator used to assess the market’s sentiment towards a particular blockchain. TVL on Polygon requires utilizing the MATIC blockchain and locking funds in the various DeFi platforms available across the network. Rising TVL is a sign of growth, or new liquidity entering the ecosystem but it does not necessarily mean that the network and associated assets are “turning bullish.” While the top 3 protocols, Ethereum (ETH), Binance Coin (BNB) and Tron (TRX) all have a TVL over $5 billion, MATIC, Avalanche (AVAX) and Arbitrum are the only others with over $1 billion in TVL. According to data from Token Terminal, Polygon and Fantom (FTM) are the only blockchains to post positive TVL numbers in both 1 day and 7 day metrics. Top blockchains sorted by TVL. Source: Defi LlamaTop 3 protocol blockchain for developersProtocols are essentially decentralized applications (dApps) built using smart contracts on top of public blockchains. The recently announced partnerships have be tested but have not yet fully launched. Even if the new partnerships do not fully materialize, the network is already a top contender for developers to build their smart contracts.Top blockchains sorted by protocol number. Source: Defi LlamaPolygon is a newcomer when compared to Ethereum. So although Ethereum has more protocols than Polygon, Ethereum launched mainnet with a 5 year head start. Polygon’s astronomical growth in protocols launching on their blockchain is notable because according to TokenTerminal’s data, Ether’s market cap dominates MATIC 90% to 10%.Related: JP Morgan executes first DeFi trade on public blockchainPolygon sees an uptick in fees and daily active usersIn addition to Polygon’s price growing 12% in the past month, the network’s daily fees and daily active users have grown by 200% since August 5 lending credence to the Cointelegraph prediction. On August 5, Polygon collected $42,093 in fees and had 248,853 daily network users. By October 13, the network’s daily active users peaked at 737,815 following the success of the Reddit NFT avatar launch. Following on October 25 the network hit a 90 day peak of $131,940 in daily fees. Polygon network fees and daily active users. Source: TokenTerminalWhen comparing the on-chain activity and analysis with the recent MATIC rally, the data suggests that speculation on the partnership news matches the fundamentals. While it is a stretch to forecast a 200% potential gain in MATIC growth by only using technical analysis, Polygon’s network growth and daily active user stats are encouraging. The number of transactions and TVL could be a sign that network fundamentals align with the expectations of technical analysts. MATIC’s strength versus competing chains, while still being only a fraction of Ether and BNB’s market cap is quite bullish for its long-term growth prospects.The views and opinions expressed here are solely those of the author and do not necessarily reflect the views of Cointelegraph.com. Every investment and trading move involves risk, you should conduct your own research when making a decision.

Čítaj viac

Získaj BONUS 8 € v Bitcoinoch

nakup bitcoin z karty

Registrácia Binance

Burza Binance

Aktuálne kurzy