Autor Cointelegraph By Jordan Finneseth

Celsius (CEL) price gains 600%+, but analysts cite exchange error and a massive short squeeze

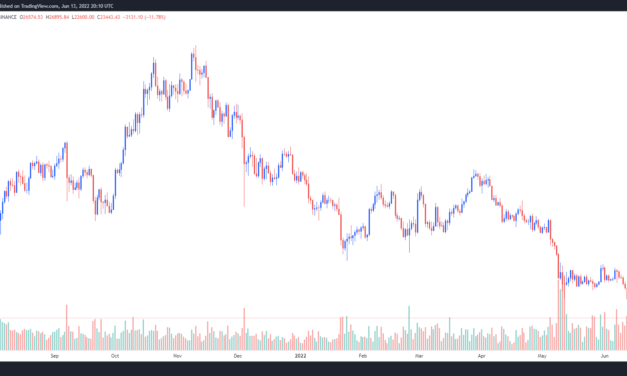
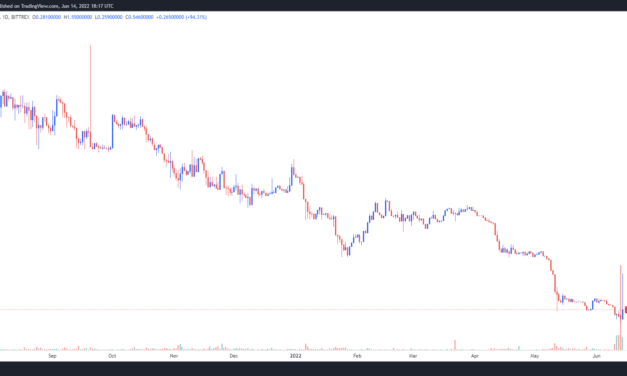
On June 14, discussions of Celsius continued to populate media headlines and June 14’s news involved the platform’s CEL token accruing massive gains after what appears to have been either an exchange glitch or a short-squeeze. CEL price spiked from $0.18  to $1.55 in one abrupt candle before sinking back to $0.60 within the same one-hour candle.CEL/USDT 1-day chart. Source: TradingViewCurrently, analysts are on the fence about the reason for the explosive price breakout. Some cite Celsius repaying a portion of its debts as a reason, while others pinpoint a possible error on the FTX exchange as the reason for what appears to be a short squeeze.Are debt repayments boosting investor confidence?Celsius has been scrambling to cover a number of its debts and it is possible that some investors view this as a sign that the platform will be able to survive the current mayhem. DAI arriving.Celsius finally going to start paying back the debt after buying enough time by reupping collateral to lower liq? pic.twitter.com/z6y165fzlL— Hsaka (@HsakaTrades) June 14, 2022Twitter analyst Hsaka said that on-chain data shows that the $28 million in Dai (DAI) that was recently deposited into a wallet controlled by Celsius and has since been sent to a separate address, which he identified as a debt repayment address. Celsius wallet transactions. Source: TwitterAnalysts believe that the Celsius’s strategy is to lower its liquidation price in the MakerDAO vaults  where it holds funds and ultimately avoid insolvency. User interface problems on FTXWhile the beginning of debt repayment might have helped inspire more confidence in Celsius, several crypto traders reported issues when trying to buy and sell the token on FTX exchange.Several replies to the tweet above confirmed user difficulties when trying to sell CEL on FTX, and Twitter user Karl Larsen said that they “could only fill my shorts at 0.87–0.95.”The possibility that the difficulties with the user interface on FTX played a part in CEL’s rapid spike was also noted by analytics provider TheKingFisher, who posted the following chart highlighting when the user interface went down in relation to when CEL price pumped. CEL/USD price. Source: TwitterAccording to TheKingfisher, when the UX went down, “most traders [were] unable to hedge, close [or] reduce their positions.”The firm said, “Spot market went above $2 to break index and trigger liquidations on purpose. That’s a spot manipulation to liquidate traders. Index being calculated on FTX itself. This is not outside of their boundary against fraud [to] keep the market organized.”Related: Nexo offers to buy out Celsius’ loans amid withdrawal suspensionIt’s just another short squeezeSome analysts say the price breakout was nothing more than an old-fashioned short squeeze, as noted by Saleem Lala. Bigger play was to liquidate $CEL shorts on perps. Funding was super high, over 2500% annualized, meaning lot of people were short. Prices didn’t move much on the perps, meaning there weren’t natural buys, but liquidations mostly as the mark price went up pic.twitter.com/GCeJNma6IF— Saleem Lala (@saleemlala) June 14, 2022

It remains to be seen what happens with the price of CEL moving forward, and it seems the most likely culprit was a cascading liquidation because these types of events are relatively frequent during strong market volatility. For example, Chain (XCN) token underwent a similar event on June 14 as its price dropped 95% due to cascading liquidations.The views and opinions expressed here are solely those of the author and do not necessarily reflect the views of Cointelegraph.com. Every investment and trading move involves risk, you should conduct your own research when making a decision.

Čítaj viac

Bitcoin has support at $23K, but analysts warn of a dire drop to $8K as global debt unwinds

Bitcoin’s month-long (BTC) choppy price action came to an end on June 13 after a deep market sell-off pressed the top cryptocurrency under the $29,000 support. The move took place as equities markets also sold-off sharply, hitting their lowest levels of the year. Data from Cointelegraph Markets Pro and TradingView shows that the Bitcoin sell-off began late in the day on June 12 and escalated into midday on June 13 when BTC hit a low of $22,592. BTC/USDT 1-day chart. Source: TradingViewHere’s a look at what several market analysts are saying about Bitcoin’s move lower and whether this is the final capitulation event before the long-awaited price bottom.Is there solid support at $23,000?Previous instances of bear market capitulation have seen a solid level of support at Bitcoin’s 200-week moving average as shown in the following chart posted by market analyst and pseudonymous Twitter user Rekt Capital.BTC/USD 1-week chart. Source: TwitterBased on the trend from the last two cycles, Rekt Capital suggested that it’s possible that BTC could see a “macro double bottom at the 200-week moving average” moving forward if the price action plays out in a similar fashion. Rekt Capital said, “If so, then $BTC is very close to forming its first Macro Bottom at the 200-week MA at ~$23,000. The second Macro Bottom could form in about two years’ time at a price point of ~$41,000.” Analysts say “max pain” is at $13,330Insight into where Bitcoin could potentially be headed should it continue to break below the established support levels was provided by data from Whalemap, who posted the following chart highlighting the previously established support levels that could now flip to resistance.Bitcoin realized price by address. Source: TwitterWhalemap said, “#Bitcoin has broken through key realized price supports where they will likely become our new resistances. $13,331 is the ultimate max pain bottom.”Related: Bitcoin derivatives data shows no ‘bottom’ in sight as traders avoid leveraged long positionsIn an extreme, Bitcoin could pullback to $8,000According to Francis Hunt, a market analyst at The Market Sniper, Bitcoin price could drop to as low at $8,000 before hitting a real bottom. BTC/USD 1-day chart. Source: TwitterHunt said, “The accumulation points would be $17,000 to $18,000. This $15,000 comes out of the blue head and shoulders there, that would be a pretty nasty downturn, and there is a bear flag target, a little less strong on the bear flag target at $12,000, and a full round trip will take you back to our funnel at $8,000 to $10,000.”The views and opinions expressed here are solely those of the author and do not necessarily reflect the views of Cointelegraph.com. Every investment and trading move involves risk, you should conduct your own research when making a decision.

Čítaj viac

Bitcoin price falls below its ‘realized price’ but is it time to buy the dip?

On June 13, cryptocurrency prices plunged deeper into bear market territory after Bitcoin (BTC) sliced through its current trading range and briefly touched $22,600, its lowest level se since December 2020.According to BTC historic-al data, the market has now reached valuation metrics that show the price is severely oversold and perhaps near a bottom. Bitcoin has now fallen below its realized price, which represents the average price of every coin in supply based on the time it was last spent on-chain.Bitcoin realized price vs. actual price. Source: GlassnodeWhile the pain that this most recent capitulation has wrought across the ecosystem can’t be understated, the one glimmer of hope it offers weary crypto traders is that the worst of the decline could have occurred. The coming days will confirm this theory and proof would be institutions and retail traders stepping in to buy the dip.”Shrimps and whales” accumulateOn-chain data shows that not all traders feel devastated about Bitcoin at yearly lows. Shrimp wallets, wallets that hold less than 1 BTC, and whale wallets with more than 10,000 BTC have been in accumulation mode since the old Terra (LUNA), now known as Luna Classic (LUNC), collapsed in early May.Bitcoin accumulation trend score by cohort. Source: GlassnodeAccording to data from blockchain intelligence provider Glassnode, shrimp wallets “have seen a net balance growth of +20,863 since the May 9th Luna crash,” and a total increase of 96,300 BTC since November’s all-time high (ATH). Whale wallets have likewise been busy during this period of time as “this cohort has a monthly position change peak of ~140k BTC/month” and has added a total of +306,358 BTC since its all-time high in November.Related: Bitcoin analysts are watching these BTC price levels as key trendline loomsSupport is limited in the mid-$20,000 rangePart of the reason for the rapid sell-off on June 13 was the lack of demand in the $20,000 to $27,000 range as shown on the following entity-adjusted unspent realized price distribution chart. Entity-adjusted unspent realized price distribution. Source: GlassnodeWhile there is a heavy amount of demand near the $30,000 and $40,000 price ranges, some of the lowest volumes were found between $20,000 and $27,000, which left little support as the price of BTC crashed in the early hours on June 13.Relief may be in sight, however, as the saying goes “it’s always darkest before the dawn” and this could apply to the current state of the crypto market based on several metrics.According to the RVT Ratio, which compares the realized capitalization against the daily volume settled on-chain, “the network valuation is now 80 times larger than the daily value settled” which indicates a low amount of on-chain activity. Bitcoin entity-adjusted RVT ratio. Source: GlassnodeGlassnode said, “In past bear cycles, an underutilized network has provided confluence with bear market bottoms.”The RVT ratio is currently at its highest level since 2010, which may suggest that the market has reached the point of max pain and could see improvements soon, but the possibility of further weakness can not be ruled out. The overall cryptocurrency market cap now stands at $980 billion and Bitcoin’s dominance rate is 46.3%.The views and opinions expressed here are solely those of the author and do not necessarily reflect the views of Cointelegraph.com. Every investment and trading move involves risk, you should conduct your own research when making a decision.

Čítaj viac

Here’s how blockchains are helping to advance the global energy grid

The blockchain industry’s impact on the energy sector has been a major source of controversy over the past five years. Governments and environmental protection advocates have routinely expressed concerns about the amount of energy required to keep the Bitcoin network secure. Data shows the network’s energy consumption now rivals the yearly energy consumed by some small countries.Historical Bitcoin network power demand. Source: CCAFWhile much of the debate has centered around the negative environmental impacts of Bitcoin (BTC) mining, the drive to maximize earnings from mining and integrate blockchain technology with the energy grid has also introduced new developments that have the potential to be beneficial in the long term. Here’s a look at several developments that have arisen out of the demand for energy to operate blockchain networks and the positive effects cryptocurrency mining is having on the energy industry. Recapturing wasted energyOne of the fastest-growing segments of the cryptocurrency mining industry is the monetization of historically wasted sources of energy such as natural gas that is flared at oil drilling facilities. Discovering natural gas pockets is a common part of the oil drilling industry, and up until recently, this gas was typically burned in a process called “flaring” because the infrastructure needed for its collection was non-existent or there had not been sufficient demand for LNG. As the value of Bitcoin rose over time, the search for inexpensive energy sources led to the installation of shipping containers filled with mining equipment at drilling sites that can utilize the energy generated from flaring to mine BTC. While the process still results in carbon dioxide emissions, income is generated during the process and these funds could be redirected toward mitigating environmental concerns. Most recently, several companies have been exploring the integration of mining via flared gas in the Middle East, which accounted for over 38% of the global flaring in 2020 and presented one of the biggest opportunities to turn wasted energy into value. Blockchain technology can make energy generation more efficientA second side-benefit of the push to maximize crypto mining profits is improvements to the energy infrastructure and an increased focus on developing sustainable forms of energy generation. Studies by the Bitcoin Mining Council have shown that there has been a noticeable increase in the amount of energy derived from sustainable sources, as opposed to sources like oil and coal. Less developed countries like Kenya and El Salvador have also been able to benefit from improvements in energy generation from sustainable sources like geothermal power plants, which have given their economies an additional source of income.Whether it’s the utilization of excess power generated by hydroelectric power plants or an increase in the use of wind and solar power, crypto mining is providing a financial incentive to help further optimization of energy efficiency and generation. Related: Marathon Digital moves Montana BTC mine to pursue carbon neutralitySmart grid technologyAnother energy-related blockchain development is the formation of blockchain-based smart grids that aim to improve energy distribution on a large scale. Inefficiencies in electricity distribution have largely been traced to the retail level, where smaller firms who own very little of the electrical grid infrastructure mainly provide simple services such as billing and monitoring meter usage. These types of services can easily be handled by blockchain technology and Internet-of-Things- (IoT)-devices that help consumers bypass retailers and connect directly with wholesale distributors, potentially reducing electricity bills by up to 40%.Connecting consumers with a smart grid also allows them to shop around with different providers to obtain the best rates possible. This could help to level the playing field in an industry that has historically been dominated by one local energy company. Projects like Grid+ and Energy Web Token are helping to lead the way in this field as the old grid design of physical substations and monitoring equipment is replaced with a network of distributed energy resources (DERs) that include battery energy storage systems, solar arrays and natural gas generators. While the sector is still in a nascent phase, it’s a trend worth keeping an eye on because, in the coming years, blockchain technology is bound to be further integrated into the energy sector. Want more information about trading and investing in crypto markets?The views and opinions expressed here are solely those of the author and do not necessarily reflect the views of Cointelegraph.com. Every investment and trading move involves risk, you should conduct your own research when making a decision.

Čítaj viac

Bitcoin, altcoins sell-off on record-high inflation, but traders still expect BTC to consolidate

Global financial markets once again find themselves trending lower on June 10 after the Consumer Price Index (CPI) came in at a blistering 8.6% year-over-year increase, the highest print since 1981. The hotter-than-expected CPI print resulted in a collapse of the $30,000 support and Bitcoin (BTC) price sold off to a daily low of $28,852 before dip buyers managed to bid the price back above $29,000.BTC/USDT 1-day chart. Source: TradingViewHere’s what several analysts in the market are saying about the outlook for Bitcoin moving forward since there appears to be little relief on the inflation front and the Federal Reserve is still determined to raise interest rates. Dollar strength weighs heavily on risk assetsThe effect of the high CPI print on two benchmarks of financial markets, the dollar index (DXY) and the S&P 500 (SPX), was touched on by il Capo of Crypto, who posted the following charts noting that “After CPI results, #DXY continues its pump and #SPX keeps free-falling.”DXY 4-hour chart vs. SPX 2-hour chart. Source: TwitterMarket analyst Kevin Svenson also said that the Fed’s inability to curb inflation is likely to translate to choppy price action for the next year. With inflation, at 8.6% that means increased rate hikes are likely. $DXY is going parabolic. #BTC and most asset classes are likely going to have to deal with lots of ranging at the lows. Sideways for a year possibly. Instant recovery is not likely.— Kevin Svenson (@KevinSvenson_) June 10, 2022There’s potential for a pullback below $28,000Should the price of BTC continue to trend lower, crypto trader and pseudonymous Twitter user Altcoin Sherpa says trading below $28,000 is possible.BTC/USD 4-hour chart. Source: TwitterAltcoin Sherpa said, “$BTC: EMAs look the best they’ve looked in a while on the 4h but the overall high time frame market structure remains bearish. Not really doing anything active rn, just observing. Seems clear that $28K > is next up if this current area gets lost.Related: Bitcoin price falls under $29.5K after ‘unexpected’ 40-year high US inflationBTC needs to reclaim $30K to prevent further downsideInsight into what it would take to avoid a pullback to the support at $28,000 was provided by market analyst and pseudonymous Twitter user CrediBULL Crypto, who posted the following chart showing the “unfortunate” retrace from $30,000, the area. The analyst suggested that this “was the moment where we needed to see follow through.”BTC/USD 2-hour chart. Source: TwitterCrediBULL Crypto said, “On support, but it’s been tested four times now, so more likely it gives way to $28K. IF we can get back above $30K, then $28K may be avoided.”The overall cryptocurrency market cap now stands at $1.192 trillion and Bitcoin’s dominance rate is 46.6%.The views and opinions expressed here are solely those of the author and do not necessarily reflect the views of Cointelegraph.com. Every investment and trading move involves risk, you should conduct your own research when making a decision.

Čítaj viac

Získaj BONUS 8 € v Bitcoinoch

nakup bitcoin z karty

Registrácia Binance

Burza Binance

Aktuálne kurzy