Autor Cointelegraph By Jordan Finneseth

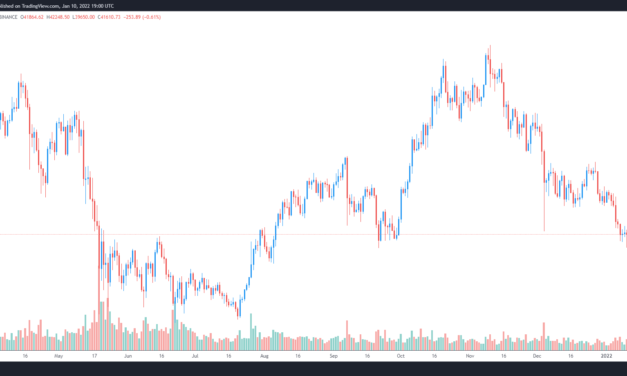
Bitcoin dip below $40K follows Fed signal of a possible fourth rate hike in 2022

Global financial markets, stocks and cryptocurrencies took a knock on Jan. 10 after rumors that the Federal Reserve may hike interest rates four times in 2022 circulated and sparked a sell-off and sent the benchmark 10-year Treasury yield briefly above 1.8%.Data from Cointelegraph Markets Pro and TradingView shows that a massive wave of selling broke Bitcoin’s (BTC) support near $42,000, resulting in a plunge to $39,660 before buyers stepped in to buy the perceived dip.BTC/USDT 1-day chart. Source: TradingViewHere’s what analysts are saying about this latest drawdown in BTC and what could possibly come next as analysts watch to see what the impact of the Fed’s easy money policies ending means for risk on assets. A shrinking money supply is bad for BitcoinThe Fed’s shifting monetary policy is generating significant challenges for risk-on assets but this was anticipated by analysts at Delphi Digital who noted that the headwinds facing BTC and the crypto market have more to do with “tighter liquidity conditions and heightened market volatility” than with rate hikes. According to Delphi Digital, “the macro tailwinds that helped propel BTC and crypto assets to new highs over the last 12-18 months have reversed course” as highlighted in the following chart showing that the global M2 supply topped out near March of 2021 and has been on the decline since then. Bitcoin price vs. Global M2 Supply. Source: Delphi DigitalThe peak in M2 supply came around the same time that Bitcoin set a new all-time high in early 2021 and was followed by a drawdown below $30,000 over the next couple of months. Despite the late 2021 resurgence in BTC which once again established a new high at $68,789 in November, the continued drop in M2 supply has taken its toll on the market which has been exasperated by the Fed sharing its plan to accelerate its timeline for raising interest rates. Delphi Digital said, “The shift away from excess liquidity and accommodative monetary conditions is a structural headwind we’ve highlighted in recent months, which now appears to be coming to a head.” The talk of higher interest rates has also breathed new life into the U.S. dollar, which Delphi Digital noted “does little favor to assets like BTC, which tends to move inversely with USD.”BTC/USD vs. DXY Index (Inverted). Source: Delphi DigitalDelphi Digital said, “We continue to stress how important the U.S. dollar is in determining the direction of global markets, especially assets tethered to the currency debasement narrative.”Related: Bitcoin drops below $40K for first time in 3 months as fear set to ‘accelerate’“A good buying opportunity”Analysis on the current chart structure for BTC was offered by analyst and pseudonymous Twitter user ‘Resolute’ who posted the following chart highlighting the 42.5% decrease in BTC price from its highs in November. BTC/USDT 2-day chart. Source: TradingViewResolute said, “Conceivably a double bottom from the September 2020 low, after retracing Q4s move up. Currently trading below the 2d 200 EMA which has historically been a good buying opportunity.”Resolute’s observation that this may be a good area of accumulation was echoed by cryptocurrency trader and Cointelegraph contributor Michaël van de Poppe, who posted the following tweet indicating a preference for opening a long as opposed to shorting the current market. I’d rather long than short here for #Bitcoin. pic.twitter.com/QUc8n58b8K— Michaël van de Poppe (@CryptoMichNL) January 10, 2022The overall cryptocurrency market cap now stands at $1.192 trillion and Bitcoin’s dominance rate is 40.9%.The views and opinions expressed here are solely those of the author and do not necessarily reflect the views of Cointelegraph.com. Every investment and trading move involves risk, you should conduct your own research when making a decision.

Čítaj viac

Crypto regulation concerns make decentralized stablecoins attractive to DeFi investors

Stablecoins have emerged as a foundational part of the cryptocurrency ecosystem over the past couple of years due to their ability to provide crypto traders with an offramp during times of volatility and their widespread integration with decentralized finance (DeFi). These are necessary for the health of the ecosystem as a whole. Currently, Tether (USDT) and USD Coin (USDC) are the dominant stablecoins in the market, but their centralized nature and the persistent threat of stablecoin regulation have prompted many in the crypto community to shun them and search for decentralized alternatives. Top 9 stablecoins by reported market capitalization. Source: MessariBinance USD (BUSD) is the third-ranked stablecoin and is controlled by the Binance cryptocurrency exchange. DAI, the top ranked decentralized stablecoin, has 38% of its supply backed by USDC which, again, raises questions about its “decentralization.”Investors’ pivot toward decentralized stablecoins can be noted by the rising market capitalizations and the number of DeFi platforms integrating TerraUSD (UST), FRAX (FRAX) and Magic Internet Money (MIM).Here’s a look at some of the factors backing the growth of each stablecoin.TerraUSDTerraUSD (UST) is an interest-bearing algorithmic stablecoin that is part of the Terra (LUNA) ecosystem and is designed to remain value-pegged with the United States dollar. In order to mint new UST, users are required to interact with Anchor Protocol and either burn an equivalent value of the network’s native LUNA token or lock up an equivalent amount of Ether (ETH) as collateral. The addition of Ether as a form of collateral really helped kick things into high gear for UST because it allowed for some of the value held in Ether to migrate into the Terra ecosystem and this resulted in an increase to UST circulating supply. 1/ bETH is now live on the Anchor web app!You can now borrow $UST against bETH, a wrapped version of the stETH staking derivative for ETH 2.0. We teamed up with @LidoFinance to provide a guide to using bETH on Anchor. https://t.co/T5KkGNNAYE— Anchor Protocol (@anchor_protocol) August 13, 2021As a result of the growth of UST, the Terra network recently surpassed Binance Smart Chain in terms of total value locked (TVL) on the protocol, which now sits at $17.43 billion, according to data from DefiLlama. Terra has also been adopted by the Curve stablecoin ecosystem which further helped its distribution across numerous DeFi protocols. This also gives UST holders another way to earn a yield alongside the 19.5% annual percentage yield (APY) offered to users who stake their UST on Anchor Protocol. FRAXFRAX (FRAX) is a first-of-its-kind fractional-algorithmic stablecoin developed by Frax Protocol. It is partially backed by collateral and the remaining portion is stabilized algorithmically.The real story behind the growth of FRAX starts with its adoption by the DeFi community within multiple well-known projects and decentralized autonomous organizations (DAOs) voting to add support for the stablecoin within their ecosystems and treasuries. FRAX was adopted early on by the OlympusDAO rebase protocol as a form of collateral that could be bonded to obtain the platform’s native OHM token. It also became the stablecoin of choice within the recently launched TempleDAO protocol.On Dec. 22, 2021, FRAX was added to Convex Finance (CVX) and was immediately thrust into the ongoing Curve Wars where a handful of major DeFi protocols are battling to accumulate CVX and Curve (CRV) to gain voting power over the Curve network and increase their stablecoin yield.The @fraxfinance Convex soft-launch has begun.https://t.co/oZ9WKZxNXRDeposit + convert $FXS to $cvxFXS— Convex Finance (@ConvexFinance) December 22, 2021

This week, the Curve Wars received a new participant after Tokemak members voted to add FRAX and Frax Share (FXS) to its Token Reactor, vowing to “bring the fight to a massive new scale.” Magic Internet Money Magic Internet Money (MIM) is a collateral-backed stablecoin issued by a popular DeFi protocol called Abracadabra.Money. What differentiates this coin is that it is “summoned” into existence when users deposit one 16 supported cryptocurrencies in “cauldrons” that support MIM.There are limitations placed on the amount that can be borrowed from the assets supported on Abracadabra and this is part of the protocol’s effort to avoid the problems faced by MakerDAO (DAI). Namely, the presence of too many centralized stablecoins and the history of catastrophic liquidations during market volatility. Some of the popular tokens available to pledge as collateral to mint MIM include wrapped Ether (wETH), Ether, Shiba Inu (SHIB), FTX Token (FTT) and Fantom (FTM).‍♂️!Our first zero-interest lending market is here!1️⃣ Provide $WETH as collateral and mint $MIM or leverage your $ETH!- Interest 0%- Liquidation Fee 4%- LTV 90%- Borrow Fee 0.5%What are you waiting for anon? Mint now!https://t.co/N3r54iPo7n— ‍♂️ (@MIM_Spell) December 31, 2021

MIM has also been integrated into the pools on Curve Finance, further highlighting the important role that Curve plays for stablecoins within the DeFi ecosystem and underscoring the incentives for participating in the Curve Wars. MIM’s cross-platform and centralized exchange integration, including its long list of collateral options, have boosted its circulating supply to $1.933 billion, making it the sixth-ranked stablecoin in terms of market capitalization.While the amount of value held in these decentralized stablecoins is only a fraction of that held in USDT and USDC, they are likely to continue to see their market share increase in the months ahead as proponents of decentralization choose them over their centralized counterparts. Want more information about trading and investing in crypto markets?The views and opinions expressed here are solely those of the author and do not necessarily reflect the views of Cointelegraph.com. Every investment and trading move involves risk, you should conduct your own research when making a decision.

Čítaj viac

Cosmos ecosystem tokens rally after Evmos promises Ethereum interoperability

The wider cryptocurrency market is facing another day of volatility and selling on Jan. 7 as Bitcoin (BTC) bears managed to break bull support at $42,000. The price of Bitcoin was pushed to a daily low of $40,620 before resources were exhausted. Data from Cointelegraph Markets Pro shows that four of the top seven gainers of the day are part of the growing Cosmos Hub. This ecosystem currently uses the Interblockchain Communication protocol (IBC) to facilitate interoperability and communication between connected networks.Top 7 coins with the highest 24-hour price change. Source: Cointelegraph Markets ProHere’s a look at what’s behind the strength seen in IRISnet (IRIS), Secret (SCRT), Akash Network (AKT) and Cosmos (ATOM). IRISnet expands its NFT capabilitiesThe top gainer over the past 24-hours has been IRISnet, an interchain service hub for decentralized applications that enables cross-chain interoperability and provides businesses with modules to support running a distributed system. Data from Cointelegraph Markets Pro and TradingView shows that after hitting a low of $0.079 in the early trading hours on Jan. 7, the price of IRIS blasted 84% higher to hit a daily high at $0.144 as its 24-hour trading volume surged 2,320% to $112.6 million. IRIS/USDT 4-hour chart. Source: TradingViewThe sudden surge in price and volume for IRIS comes as the protocol’s nonfungible token community continues to expand thanks to the upcoming launch of the Uptick Network nonfungible token (NFT) ecosystem. These efforts have helped to attract new users to the IRISnet ecosystem. Pulp Fiction NFTs are coming to the Secret NetworkThe Secret Network is a blockchain protocol with built-in data privacy for smart contracts that enables programmable privacy for data transfer, decentralized finance (DeFi) and NFTs. VORTECS™ data from Cointelegraph Markets Pro began to detect a bullish outlook for SCRT on Jan. 3, prior to the recent price rise. The VORTECS™ Score, exclusive to Cointelegraph, is an algorithmic comparison of historical and current market conditions derived from a combination of data points that includes market sentiment, trading volume, recent price movements and activity on Twitter.VORTECS™ Score (green) vs. SCRT price. Source: Cointelegraph Markets ProAs seen in the chart above, the VORTECS™ Score for SCRT began to pick up on Jan.3, around 55 hours before the price increased 25% over the next day.The boost to SCRT price comes after it was revealed that movie director Quentin Tarantino will be releasing NFTs from the popular move Pulp Fiction on the Secret Network. Akash Network partners with CloudStackThe Akash Network bills itself as the world’s first decentralized cloud computing marketplace for DeFi. Known as DeCloud, the service enables any application to launch quickly without the need to set up, configure or manage servers. Data from Cointelegraph Markets Pro and TradingView shows that after a quick drawdown to a low of $2.33 on Jan. 5, the price of AKT rebounded 25% to a daily high at $2.93 on Jan. 7 as its 24-hour trading volume increased by 88%. AKT/USD 4-hour chart. Source: TradingViewThe building momentum for AKT comes following the announced partnership between the Akash Network and CloudStack, a decentralized cloud aggregator that offers a portal to access any decentralized storage network, including Filecoin, Arweave and Storj. Related: 3 reasons why Cosmos (ATOM) price is near a new all-time highBulls like the idea of interoperability between Cosmos and EthereumCosmos is the foundational blockchain protocol for the entire Cosmos Hub, billing itself as the “internet of blockchains.” ATOM holders stake the platform’s native ATOM token to secure the entire ecosystem. VORTECS™ data from Cointelegraph Markets Pro began to detect a bullish outlook for SCRT on Dec. 29, prior to the recent price rise. VORTECS™ Score (green) vs. ATOM price. Source: Cointelegraph Markets ProAs seen in the chart above, the VORTECS™ Score for ATOM climbed into the green zone on Dec. 29 and hit a high of 80 just as its price began to increase by 79% over the next nine days. The overall cryptocurrency market cap now stands at $1.987 trillion and Bitcoin’s dominance rate is 39.9%.The views and opinions expressed here are solely those of the author and do not necessarily reflect the views of Cointelegraph.com. Every investment and trading move involves risk, you should conduct your own research when making a decision.

Čítaj viac

Here’s why Bitcoin traders say a drop to $38K is the worst case scenario

The fallout from the Federal Reserve’s recent hawkish comments about raising interest rates as soon as March continued to weigh heavily on the cryptocurrency market on Jan. 6. The Crypto Fear & Greed index has been dialed down to 15 and some traders are lamenting the possible start of an extended bear market. Crypto Fear & Greed Index. Source: AlternativeData from Cointelegraph Markets Pro and TradingView shows that bears attempted to challenge the lows set on Jan.5, bringing BTC price down to $42,439 during early trading on Jan. 6.BTC/USDT daily chart. Source: TradingViewLet’s take a quick look at where analysts think the price might go in the next few days.Bitcoin could bottom between $38,000 and $40,000According to Mike Novogratz, the CEO of Galaxy Digital Holdings and a staunch cryptocurrency advocate, this latest move down “has been on low volume” and highlighted the fact that there is a “tremendous amount of institutional demand on the sidelines.”As for whether or not Novogratz sees the current market conditions as a good buying opportunity, the experienced trader told CNBC that “he’s waiting a little longer to buy crypto” and suggested that the market will “be volatile over the next few weeks.”Novogratz said, “Bitcoin could find a bottom at the $38,000 to $40,000 level.” BTC attempts to establish a higher lowA closer look at the recent BTC price action was offered by crypto analyst and pseudonymous Twitter user Rekt Capital, who posted the following chart comparing the current market conditions to those that were seen the last time BTC price fell below its 50-day exponential moving average (EMA). BTC/USD 1-week chart. Source: TwitterAccording to Rekt Captial, BTC “has deviated below the blue 50 EMA” and is now in the process of trying to set a new higher low (HL) as represented by the green dashed line. Rekt Capital said, “In May 2021, BTC also formed a Higher Low (orange) upon deviating below the 50 EMA. BTC held the HL initially but wicking below it was common also.”Based on the circled section provided on the above chart, Rekt Capital sees the possibility of BTC dropping down into the $40,000 range. Related: Bitcoin price bounces off $42K as order book imbalance turns ‘crazy’BTC price is in the “golden pocket”A final bit of analysis highlighting the critical junction the market is in was provided by independent market analyst Scott Melker, who posted the following chart showing BTC trading between the 0.65 and 0.618 Fibonacci retracement levels. BTC/USD 1-day chart. Source: TwitterAccording to Melker, this range is known as the “golden pocket” and “is considered the most viable place too long or short an asset and look for a reversal.”Melker said, “Price is currently in the golden pocket of the move from $28,600 to $69,000.”The overall cryptocurrency market cap now stands at $2.077 trillion and Bitcoin’s dominance rate is 39.5%.The views and opinions expressed here are solely those of the author and do not necessarily reflect the views of Cointelegraph.com. Every investment and trading move involves risk, you should conduct your own research when making a decision.

Čítaj viac

Oracle tokens turn bullish as blockchain projects focus on interoperability

2022 looks to be a transformative year for the cryptocurrency ecosystem as the focus on interoperability between siloed blockchain networks comes to the forefront and a multitude of projects announce plans to interconnect their platforms with other protocols. One sector of the crypto ecosystem that will play a vital role in ensuring smooth communication and interaction between networks is oracles projects like Chainlink (LINK) and Band Protocol (BAND). Top 8 oracle projects by market capitalization. Source: MessariOracles relay data in a consistent, secure and decentralized manner and this is key to providing price feeds for the DeFi sector and centralized exchanges. The number of partners for the top oracle projects. Source: TwitterAs shown in the graphic above, Chainlink is by far the most widely adopted oracle in the crypto ecosystem with a near eight-fold lead in partners when compared to its nearest competitor Berry Data (BRY).Chainlink secures new partnershipsA scroll through the Chainlink Twitter feed shows why LINK has started off 2022 as the top oracle provider by announcing multiple partnerships with DeFi and NFT projects.The project has also benefited from its focus on developing the Cross-Chain Interoperability Protocol (CCIP) which helps facilitate the ongoing growth of the multi-chain ecosystem.VORTECS™ data from Cointelegraph Markets Pro began to detect a bullish outlook for LINK on Dec. 10, prior to the recent price rise. The VORTECS™ Score, exclusive to Cointelegraph, is an algorithmic comparison of historical and current market conditions derived from a combination of data points including market sentiment, trading volume, recent price movements and Twitter activity.VORTECS™ Score (green) vs. LINK price. Source: Cointelegraph Markets ProAs seen in the chart above, the VORTECS™ Score for LINK began to pick up on Dec. 10 and hit a high of 77, around 72 hours before the price increased 60% over the next three weeks. Related: Blockchain enables enterprise business models in the MetaverseBand Protocol launches on CeloBand Protocol is a cross-chain data platform designed to help developers integrate real-world data into their decentralized applications including sports, weather, random numbers and price feed data. The project recently announced that it had launched on Celo’s (CELO) mobile-first DeFi platform, which focuses on bringing decentralized finance to more than “6 billion smartphones in circulation.” VORTECS™ data from Cointelegraph Markets Pro began to detect a bullish outlook for BAND on Dec. 29, prior to the recent price rise. VORTECS™ Score (green) vs. BAND price. Source: Cointelegraph Markets ProAs seen in the chart above, the VORTECS™ Score for BAND hit a high of 76 on Dec. 29, around 48 hours before the price began to increase 44% over the next five days.With the major themes of interoperability and cross-chain integrations shaping up to be a primary focus of the cryptocurrency ecosystem in 2022, oracles are one sector of the market that could continue to see positive inflows thanks to their ability to transfer data and assets seamlessly and securely between supported blockchain networks. The views and opinions expressed here are solely those of the author and do not necessarily reflect the views of Cointelegraph.com. Every investment and trading move involves risk, you should conduct your own research when making a decision.

Čítaj viac

Získaj BONUS 8 € v Bitcoinoch

nakup bitcoin z karty

Registrácia Binance

Burza Binance

Aktuálne kurzy