Autor Cointelegraph By Jordan Finneseth

Ethereum bulls aim to flip $2.8K to support before calling a trend reversal

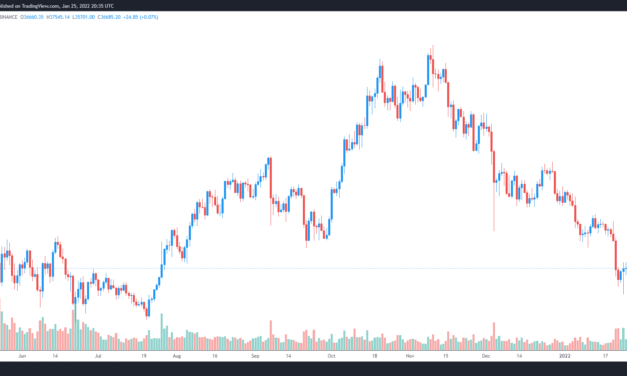
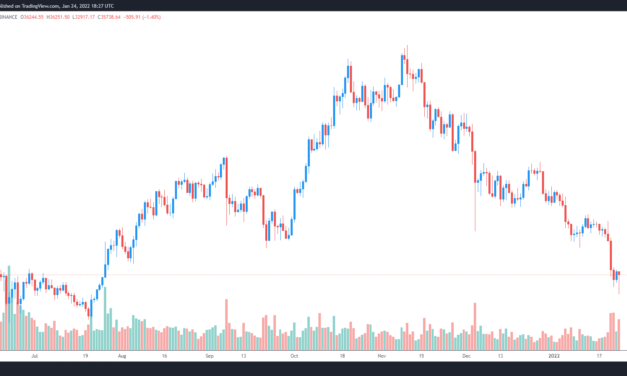
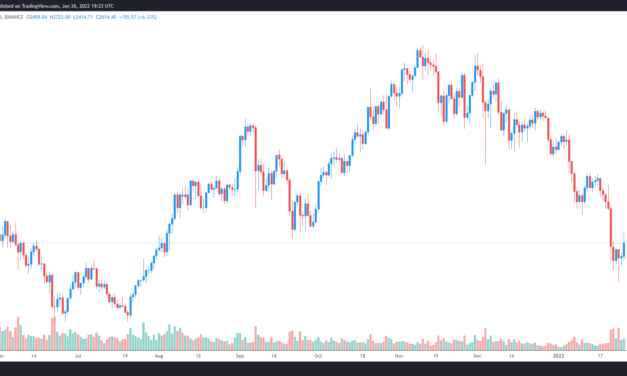
The dire predictions calling for the onset of an extended bear market may have been premature as prices appear to be in recovery mode on Jan. 26 following a signal from the U.S. Federal Reserve that interest rates will remain near 0% for the time being. After the Fed announcement from, prices across the cryptocurrency market began to rise with Bitcoin (BTC) up 4.11% and making a strong push for $39,000. This sparked a wave of momentum that helped to lift a majority of tokens in the market, but at the time of writing BTC price has pulled back to the $37,000 zone.Data from Cointelegraph Markets Pro and TradingView shows that the top smart contract platform Ethereum (ETH) also responded positively to the rise in bullish sentiment as its price climbed 8.11% on the 24-hour chart to hit a daily high at $2,723. ETH/USDT 1-day chart. Source: TradingViewHere’s a look at what several analysts in the market are saying about the price action for Ethereum and where the top altcoin could be headed in the short term. Ether had a “nice 12% bounce” from the recent lowsShort-term analysis of Ether’s price action was provided by crypto trader and pseudonymous Twitter user ‘CryptoAmsterdam’, who posted the following chart outlining one possible path the price of Ether could take in the near future. ETH/USDT 1-hour chart. Source: TwitterAfter noting the “nice 12% bounce” in the price of Ether “since the flip,” CryptoAmsterdam gave the warning that they “wouldn’t chase the green here.” CryptoAmsterdam said, “Will look for a potential short-term flip of bias if we get back under the lower time frame range high and break that little trendline.”A bottoming pattern on the Ether chartFurther insight into the state of Ether was offered by options trader and pseudonymous Twitter user ‘John Wick’, who posted the following chart highlighting the formation of a bottoming pattern on the Ether chart. ETH/USD 4-hour chart. Source: TwitterWick said, “Ethereum showing the same bottoming pattern trying to break out of the resistance zone. Needs to see more upside from BTC to breakout.”Related: Altcoins book 40% gains after Bitcoin and the crypto market enter a relief rallyEther bulls need to reclaim support at $2,850A final bit of analysis on key levels to keep an eye on moving forward was shared by crypto trader and pseudonymous Twitter user ‘TheCryptoCactus’, who posted the following chart outlining a key support and resistance zone, as well as an area of heavy accumulation. ETH/USD 2-day chart. Source: TwitterAccording to TheCryptoCactus, those that “longed the bottom” are in a good position for an “easy hedge” at these levels, but the trader cautioned that what is needed next is “to get a valid support/resistance flip of $2,850.”TheCryptoCactus said, “Personally, would rather wait till we flip $3,000 into support again and then just ape a huge position.”The overall cryptocurrency market cap now stands at $1.734 trillion and Bitcoin’s dominance rate is 41.5%.The views and opinions expressed here are solely those of the author and do not necessarily reflect the views of Cointelegraph.com. Every investment and trading move involves risk, you should conduct your own research when making a decision.

Čítaj viac

Altcoins book 40% gain after Bitcoin and the crypto market enter a relief rally

Crypto investors are beginning to feel a sense of hope once more on Jan. 26 as the wider cryptocurrency market is seeing green and Bitcoin (BTC) price trading near $38,000. Even with the breakout, traders are advising caution ahead of the Federal Open Market Committee meeting where the Federal Reserve is expected to unveil their plans for hiking interest rates. As bullish sentiment begins to return, several altcoin projects have seen their prices spike more than 41% as dip buyers sought to secure a position ahead of a possible market rally. Top 7 coins with the highest 24-hour price change. Source: Cointelegraph Markets ProData from Cointelegraph Markets Pro and TradingView shows that the biggest gainers over the past 24-hours were Frontier (FRONT), Decentral Games (DG) and Quantstamp (QSP).Frontier lists at BithumbFrontier is a chain-agnostic decentralized finance aggregator designed to allow users to store, earn, swap and invest in crypto assets on multiple blockchain networks from one interface. VORTECS™ data from Cointelegraph Markets Pro began to detect a bullish outlook for FRONT on Jan. 24, prior to the recent price rise. The VORTECS™ Score, exclusive to Cointelegraph, is an algorithmic comparison of historical and current market conditions derived from a combination of data points including market sentiment, trading volume, recent price movements and Twitter activity.VORTECS™ Score (green) vs. FRONT price. Source: Cointelegraph Markets ProAs seen in the chart above, the VORTECS™ Score for FRONT rose into the green zone on Jan. 23 and hit a high of 86 on Jan. 24, around 33 hours before the price spiked 100% over the next day. The surge in FRONT price comes as the token was listed on the Korean-based Bithumb cryptocurrency exchange. Decentral Games rolls out ICE pokerDecentral Games is a play-to-earn gaming protocol that offers users an opportunity to make a living through incentivized gameplay, self-custody and the delegation of yield-bearing Metaverse assets. Data from Cointelegraph Markets Pro and CoinGecko shows that the price of DG has rallied 55% from a low of $0.236 on Jan. 25 to a daily high of $0.366 on Jan. 26.DG/USD 1-hour chart. Source: CoinGeckoThe increase in price for DG comes as the beta version of the protocols ICE poker game is now live and allowing users to create avatars and earn money in a virtual reality skyline ICE poker lounge. Related: BTC price hits $38K as Bitcoin analysts focus on weekly closeQuantstamp services are in high demandThe blockchain security and code audit provider Quantstamp saw its token price rise 66% on Wednesday to hit a daily high of $0.357. VORTECS™ data from Cointelegraph Markets Pro began to detect a bullish outlook for QSP on Jan. 23, prior to the recent price rise. VORTECS™ Score (green) vs. QSP price. Source: Cointelegraph Markets ProAs seen in the chart above, the VORTECS™ Score for QSP climbed to a high of 73 on Jan. 23, around 10 hours before the price staged a 69% rally over the next two days.The climbing price of QSP follows a series of audits conducted by the Quantstamp team for multiple projects including the code for the CasperSwap decentralized exchange and the MakersPlace NFT market. The overall cryptocurrency market cap now stands at $1.734 trillion and Bitcoin’s dominance rate is 41.8%.The views and opinions expressed here are solely those of the author and do not necessarily reflect the views of Cointelegraph.com. Every investment and trading move involves risk, you should conduct your own research when making a decision.

Čítaj viac

Bitcoin hits $37.5K, stocks recoup losses ahead of Wednesday’s FOMC statement

The dominant sentiment of doom and gloom in the crypto market shifted toward hope on Jan. 25 after the price of Bitcoin (BTC) climbed to $37,500 briefly as stock markets staged a midday rally that recovered most of the losses from Jan. 24.Even with Jan. 25’s recovery, global markets remain in a state of flux, primarily due to uncertainty over the U.S. Federal Reserve’s plan to raise interest rates in the coming months, with the latest signal indicating that the first rate hike will come in March. Data from Cointelegraph Markets Pro and TradingView shows that Bitcoin bulls reclaimed the $36,000 level early on Jan. 25 and managed to claw their way above $37,500 before a closing-bell pullback in equities markets weighed on BTC price. BTC/USDT 1-day chart. Source: TradingViewHere’s what several analysts are saying about this latest move for Bitcoin and whether it’s the start of a sustainable rally or a bull trap that is destined to push the price back into the low $30,000s. $34,000 is a crucial level to holdThe significance of the recent price bounce off of $34,000 was addressed by on-chain data firm Whalemap, who posted the following chart highlighting the bounce off of the “whale” trendline. Bitcoin realized price by address. Source: WhalemapWhalemap said, “Perfect bounce for Bitcoin on the daily. $34,000 is now crucial to hold.”According to the chart posted by Whalemap, should $34,000 fail to hold, the next major support level is found near $25,000. Volatility ahead of the FOMC meetingThe issue of concern ahead of the Federal Open Market Committee (FOMC) meeting was addressed by market analyst and Cointelegraph contributor Michaël van de Poppe, who posted the following chart highlighting the “nice flip of $36,000” and suggested that now the market is “looking for a continuation to $38,000.”BTC/USDT 1-hour chart. Source: TwittervanPoppe said, “However, all very tricky still with the FOMC meeting coming up tomorrow, as volatility will probably remain high on Bitcoin and the markets.”Related: Is the bottom in? Data shows Bitcoin derivatives entering the ‘capitulation’ zoneAn old CME gap wa filledOne final observation about the latest move in the market was offered by independent market analyst Scott Melker, who posted the following Bitcoin CME futures chart and pointed out that the recent dip in BTC filled a gap that goes back to July 2021. BTC CME futures. 1-day chart. Source: TwitterMelker said, “Not a huge believer in the CME gap narrative, but this was an epic fill. Almost to the dollar.”A slightly different take on the narrative that the bull market is now coming to a close was offered by the crypto trader and pseudonymous Twitter user PlanC, who posted the following weet suggesting that the bear market actually started in February 2021 and is just now coming to an end. Right now everyone is worried about going into a correction phase “bear market” #Bitcoin However, we have actually been in one since the first 2021 peak. #BTCAnd it looks like we might be coming out of it #soon. pic.twitter.com/2e87uZLw61— Plan©️ (@TheRealPlanC) January 24, 2022The overall cryptocurrency market cap now stands at $1.667 trillion and Bitcoin’s dominance rate is 42%.The views and opinions expressed here are solely those of the author and do not necessarily reflect the views of Cointelegraph.com. Every investment and trading move involves risk, you should conduct your own research when making a decision.

Čítaj viac

Here’s 5 altcoins to study as crypto prices drop close to a 1-year low

The pain trade has been an unwelcome sight across the cryptocurrency market since the start of 2022 and over the past 24 days Bitcoin (BTC) and the altcoin prices have drifted, leading some analysts to suggest that a bear market is at hand.Despite traders’ concern that another extended crypto winter could be starting, it times like these when investors can capitalize on great opportunities to pick up fundamentally sound cryptocurrencies at a discount.Crypto Fear & Greed Index. Source: Alternative.meIn that vein, here’s a closer look at several projects with strong fundamentals and a proven use case that could be good candidates for accumulation during the current market correction. Polygon (MATIC)The Ethereum (ETH) layer-two scaling solution Polygon (MATIC) is currently down 50.76% from its all-time high of $2.92 which was established on Dec. 27, 2021. MATIC/USDT 1-day chart. Source: TradingViewPolygon saw a tremendous amount of growth and adoption over the course of 2021 because its compatibility with Ethereum and low transaction costs made it a destination for users and protocols that were looking for a way to remain on the Ethereum network and avoid the high cost of transactions. Total MATIC wallets over time. Source: Dune AnalyticsThe network is capable of hosting all manner of decentralized applications including lending protocols like AAVE, decentralized exchanges like Uniswap or gaming and nonfungible token projects like Aavegotchi. With the capabilities and final date for the rollout of Eth2 still unknown, layer2 solutions like Polygon are likely to continue to see increased engagement as users seek lower-fee transactions. Fantom (FTM)Fantom (FTM) is a layer-one blockchain protocol that also rose in prominence over 2021 as its low fee environment and Ethereum Virtual Machine (EVM) Compatibility helped attract new users and protocols to the network. FTM/USDT 1-day chart. Source: TradingViewData from Cointelegraph Markets Pro and TradingView shows that the price of FTM is currently down 36.3% from its December highs and trading at a price of $2.15 at the time of writing. The bullish case for FTM is backed by the continued rise total value locked (TVL) on the Fantom network despite the market-wide pullback, with data from Defi Llama showing that the Fantom TVL is currently at an all-time high of $12.07 billion. Total value locked on Fantom. Source: Defi LlamaWhen compared to competing networks such as Solana (SOL) which has a TVL of $7.62 billion, Fantom holds more value and has not experienced any major network disruptions like Solana,  yet it trades at a significant discount when compared to the price of SOL. TVL of #Fantom and #Solana are nearly the same now (10.67B vs 10.31B)Buy $FTM now like buy $SOL at 23$#fantomseason #solanawinter #fantomnews pic.twitter.com/eeUop6biZJ— Fantom News (@fantomnews) January 15, 2022With the current price of SOL standing at roughly $90, the price of FTM would need to be $18.10 to have a matching market cap, suggesting that Fantom is undervalued relative to its layer-one competitors and has the potential to close that gap as 2022 progresses. Polkadot (DOT)Another token that could potentially be in a good accumulation zone is Polkadot (DOT), a sharded multi-chain protocol whose goal is to facilitate the cross-chain transfer of any data or asset types across multiple blockchain networks. Data from Cointelegraph Markets Pro and TradingView shows that the price of DOT has been on the decline since early November 2021 as the token underperformed its cohort of layer-one projects possibly due to the lack of a functioning bridge to Ethereum.DOT/USDT 1-day chart. Source: TradingViewThis all changed on Jan. 11 when Polkadot’s Moonbeam (GLMR) parachain officially launched and established the first cross-chain bridge for the Polkadot network. As of Jan. 24, Moonbeam has processed more than 1,329,000 transactions and supports more than 700 ERC-20 tokens. As other parachains officially launch on Polkadot in the months ahead, DOT has the potential to see a rise in demand and token price as users look to get involved with the Polkadot network. Polkadot ecosystem. Source: PolkaProjectCurve (CRV)When it comes to the increasing importance of the stablecoins in the crypto market, Curve DAO token has emerged as one of the most sought-after tokens by investors and protocols who have been vying for control of governance on the platform. CRV/USDT 1-day chart. Source: TradingViewAfter hitting a record high of $6.80 on Jan. 4, the price of CRV has fallen 60% and now trades at $2.76 according to data from TradingView. Even with the drop in CRV price, the ongoing ‘Curve Wars’ suggest that demand for the token is likely to rise once the current weakness in the market subsides as decentralized finance projects attempt to accumulate governance powers over the Curve ecosystem.At the time of writing, a total of 49% of the circulating supply of CRV is locked in veCRV, the voting token for the Curve protocol. Percentage of CRV tokens locked on Curve. Source: Dune AnalyticsRelated: Does a Fed digital dollar leave any room for crypto stablecoins?Frax Share (FXS)Another protocol that looks to play a larger role in the stablecoin sector is Frax Share (FXS), the first fractional-algorithmic stablecoin system in the crypto sector that began to gain traction near the end of 2021. FXS/USDT 4-hour chart. Source: TradingViewThe protocol’s FRAX stablecoin has emerged as a fan favorite of the DeFi crowd in large part thanks to its decentralized nature in a field dominated by centralized projects like Tether (USDT) and USD Coin (USDC). As a result of its adoption, the total volume of FRAX transacted has risen over the past six months and is currently at an all time high of $6.3 billion. FRAX monthly volume. Source: Dune AnalyticsFXS’s bullish momentum is backed by a steadily increasing total value locked, which increased by 30.53% over the past week and 86.9% over the last month to hit a record high of $2.28 billion on Jan. 24. This climb to a record TVL comes even as the prices of nearly every other asset fell across the crypto market.Total value locked on Frax Share. Source: Defi LlamaWith FRAX now being adopted across DeFi by users looking for more decentralized stablecoin options, FXS could likewise see an increase in demand and token price as the importance of reliable stablecoin protocols intensifies. The views and opinions expressed here are solely those of the author and do not necessarily reflect the views of Cointelegraph.com. Every investment and trading move involves risk, you should conduct your own research when making a decision.

Čítaj viac

Analysts say Bitcoin’s bounce at $36K means “it’s time to start thinking about a bottom”

Bears remain in full control of the cryptocurrency market on Jan. 24 and to the shock of many, they managed to pound the price of Bitcoin (BTC) to a multi-month low at $32,967 during early trading hours. This downside move filled a CME futures gap that was left over from July 2021.Data from Cointelegraph Markets Pro and TradingView shows that the $36,000 level was overwhelmed in the early trading hours on Monday, leading to a sell-off that dipped below $33,000 before dip buyers arrived to bid the price back above $35,500.BTC/USDT 1-day chart. Source: TradingViewHere’s a look at what several analysts are saying about the macro factors at play in the global financial markets and what to be on the lookout for in the months ahead. “Rate hikes don’t kill risk assets”For several weeks the dominant conversation in U.S. financial markets has been the prospect of up to four interest rate hikes by the Federal Reserve over the course of 2022, which many people have claimed will put an end to the current bull market. But according to financial analyst and pseudonymous Twitter user ‘Tascha,’ this is a common misconception because “rate hikes don’t kill risk assets.”Tascha said, “Reversal of quantitative easing does. Check what happened to stocks 2015 and 2018 when Fed turned off the tap.”Further insight into Tascha’s tweet was provided in the following reply from pseudonymous Twitter user RK Maruvada. Is it time to think about a bottom?A bit of hope for the crypto faithful was provided by technical analyst and Bollinger Bands creator John Bollinger, who posted the following tweet suggesting that “it’s time to start thinking about a bottom in cryptos.” It’s time to start thinking about a bottom in cryptos. However the ability to get outside the lower Bollinger Band repeatedly strongly suggests a retest of some sort will be needed. My plan is wait for a bottom and a bounce, then look for a retest as an entry. $btc, $eth, $ltc…— John Bollinger (@bbands) January 24, 2022While the well-known analyst thinks that the market may be in the general area of a bottom, caution is still warranted and a bounce followed by a retest is needed before looking to enter a long position in BTC. Related: Bitcoin ‘enters value zone’ as BTC price floor metric goes green againOpening a Bitcoin long “looks attractive here”A final bit of analysis was provided by macro strategist and Delphi Digital co-founder Kevin Kelly, who indicated that “the big question now is where will the next wave of demand come from and what level do we need to hit for it to trigger such bids? BTC/USD 1-day chart. Source: TradingViewAccording to Kelly, “the mid-to-high $30,000s for BTC is a safe bet,” especially due to the widely held belief by many that Bitcoin could see a “run up to $70,000.” This would mark a 75% gain from the current levels, which “large capital allocators would salivate at the opportunity to capture” from Kelly’s view, “even if it takes a year or longer to realize such gains.”Kelly said, “That is why we firmly believe BTC looks attractive here for those with a long enough time horizon, especially when compared to traditional alternatives to park your capital.”This sentiment that BTC is at a good level for a long was also echoed in the following tweet by cryptocurrency analyst and Twitter user Will Clemente.Don’t think asymmetry is skewed to the downside for BTC here. For the long term investor this is a good area to DCA in some heavier buys IMO.— Will Clemente (@WClementeIII) January 24, 2022

The overall cryptocurrency market cap now stands at $1.594 trillion and Bitcoin’s dominance rate is 41.9%.The views and opinions expressed here are solely those of the author and do not necessarily reflect the views of Cointelegraph.com. Every investment and trading move involves risk, you should conduct your own research when making a decision.

Čítaj viac

Získaj BONUS 8 € v Bitcoinoch

nakup bitcoin z karty

Registrácia Binance

Burza Binance

Aktuálne kurzy