Autor Cointelegraph By Jordan Finneseth

Altcoin Roundup: JunoSwap, Solidly and VVS Finance give DeFi a much-needed refresh

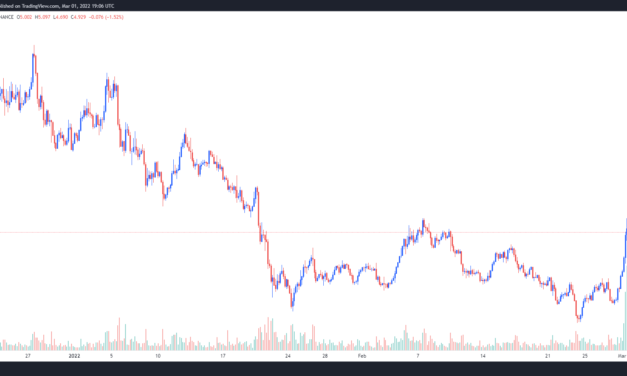
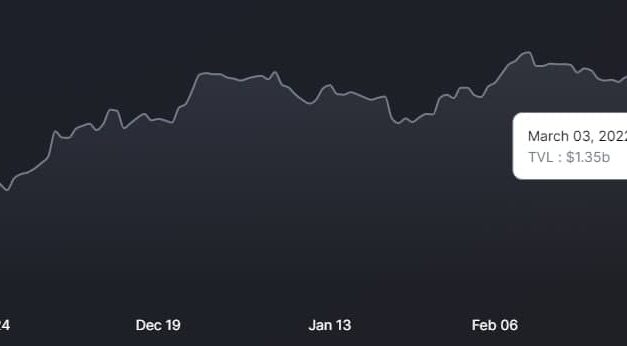
Decentralized finance (DeFi) was the talk of the town in early 2021, but it has since taken a back seat to more appealing sectors like nonfungible tokens (NFTs), memecoins and blockchain gaming. Now that cross-chain bridges and interoperability have allowed for the easier migration of assets to competing chains, a new class of DeFi protocols is arising to challenge those left from 2021.Here’s a look at three DeFi projects that have launched on some of the up-and-coming layer-1 blockchain networks, catching the eye of the crypto community. VVS Finance VVS Finance is the largest DeFi protocol on the Cronos network, a project that emerged out of the Crypto.com ecosystem which has since been fully rebranded to Cronos (CRO).The goal of VVS Finance is to offer instant swaps with low fees, low slippage and attractive yields for liquidity providers (LPs). As a reward for providing liquidity, two-thirds of swap fees collected on the exchange are distributed to the LPs of the respective pools and LP tokens can also be locked in the protocol’s Crystal Farms to earn VVS rewards. VVS holders also have the ability to single stake their tokens in the “Glitter Mines,” where they can currently auto-compound for 65.78%. Future plans include the addition of VVS rewards for those who swap tokens through the exchange. According to data from DefiLlama, the current TVL for VVS finance is $1.35 billion, accounting for more than half of the $2.37 billion in value locked on the Chronos network. Total value locked on VVS Finance. Source: DefiLlamaThe steady rise in TVL on VVS has come as the protocol has added support for new assets including Dogecoin (DOGE), Shiba Inu (SHIBA), TrueUSD (TUSD) and Cardano (ADA). Solidly Solidly is a decentralized exchange (DEX) on the Fantom network and it claims to offer “low fees, near-zero slippage on correlated assets and a strong focus on secondary markets for tokenized locks as NFTs.”In simpler terms, Solidly is designed to function as an interface for swapping stablecoins and other crypto assets. The DEX is the latest creation by Andre Cronje, DeFi architect and founder of Yearn.finance. It was launched in January 2022 with the goal of offering fair and balanced access to decentralized finance. The protocol’s focus on stablecoins has thrust it into the Curve Wars debate with its own twist. This comes at the time when Solidly Wars have broken out among the Fantom DeFi community, with the Solidex protocol currently accounting for 33.74% of all Solidly emissions. Despite launching just a little over a month ago, the total value locked (TVL) on the protocol recently hit a high of $2.19 billion and saw more than $317 million in volume on March 3 as the wider crypto market experienced a sell-off. Total liquidity and 24-hour trading volume on Solidly. Source: SolidlySOLID, the native token, holders can stake their tokens on the network for varying lock-up periods ranging from one week to four years. They are also able to receive vested equity nonfungible tokens (veNFT) that represent the staked assets and confer voting rights. Liquidity providers are also rewarded with veNFTs and earn between 40% and 100% based on their own ve-token balance. Fees generated from activity on the Solidly exchange are distributed to veNFT token holders. Related: Crypto adds efficiency to global trade and financing, says Bequant execJuno Juno is a decentralized, public and permissionless network for cross-chain smart contracts that is part of the Cosmos ecosystem. While it is not necessarily a DeFi-specific protocol, Juno has enabled the creation of multiple decentralized applications (DApps) and DeFi protocols like Junoswap with others currently in development. The protocol was created by a group of developers, validators and delegators within the Cosmos ecosystem to become a kind of sister hub to the Cosmos Hub, which can help “preserve the neutrality of the Hub by offloading smart contract usage/congestion to a designated contract zone.” Juno is also home to CosmWasm, a program that enables WebAssembly (WASM) virtual machines in the Cosmos SDK. The addition of WASM allows software to be written in many different coding languages, making it so that developers don’t need to learn a new language just to build on Cosmos. Activity for the JUNO token saw a noticeable uptick near the end of December 2021, climbing from a price of $7.70 on Dec. 20 to a record-high of $45.85 on March 3.JUNO/USD 1-day chart. Source: CoinGeckoAlongside interest in the cross-chain smart contract capabilities of Juno, investors have also been attracted to the protocol for several high-profile airdrops that have been distributed to JUNO holders and stakers such as the GovDrop for Neta (NETA) and Marble DAO. Want more information about trading and investing in crypto markets?The views and opinions expressed here are solely those of the author and do not necessarily reflect the views of Cointelegraph.com. Every investment and trading move involves risk, you should conduct your own research when making a decision.

Čítaj viac

Ethereum price consolidates near $2.8K as analysts say bulls prepare for a push higher

Choppy market conditions dominated the cryptocurrency landscape on March 3 as the global economy continues to face challenges on multiple fronts and uncertainty about the future weighs heavily on asset prices. Data from Cointelegraph Markets Pro and TradingView shows that the gains made by Ether (ETH) on March 2 were nullified in trading on March 3 as the price drifted from March 2’s high of $3,044 to a daily low of $2,784, reflecting an overall decline of 8.5%. ETH/USDT 1-day chart. Source: TradingViewHere’s what several analysts in the crypto market are saying about what could be in store for Ether in the next few weeks.Ether is a “safe buy” above $3,200Analysis of the weekly price action for Ether was provided by options trader and pseudonymous Twitter user John Wick, who posted the following chart that suggests that there has been a confirmed reversal in Ether price. ETH/USD 1-week chart. Source: TwitterThe analyst said, “The weekly Ethereum has the same great looking setup, with a combination confirmed reversal & double bottom. Wouldn’t be surprised to see it eventually take us to just below $5,000 as first target.”A similar sentiment was expressed by crypto analyst and pseudonymous Twitter user Crypto White Walker, who posted the following chart and stated that they “would like to see a wick till $2,600s again before it starts its ascend.”ETH/USDT 1-week chart. Source: TwitterCrypto White Walker said, “A close above $3,200 will make this chart look even better and in my opinion, safe buying zone is then only, once it breaks the lower highs on the daily time frame. Weekly RSI should be 55.5-56.5 soon.”Ether needs to hold above $2,830Insight into the Ether price action on a lower time frame chart was offered by crypto trader and pseudonymous Twitter user Altcoin Troy, who posted the following chart, which highlighted the major areas of demand for Ether. ETH/USDT 1-hour chart. Source: TwitterAltcoin Troy said, “Currently testing H1 demand zone/orderblock around ~$2,800. Also in confluence with the 200-hourly EMA, which I would like to see hold as well. Key level to reclaim is $2,830 for more upside.”Related: Bitcoin heads for $42K support as stocks pullback nudges BTC price lowerA 2016 fractal points to an upcoming breakoutA more macro view of the current price action as it relates to previous cycles was touched upon by crypto analyst and pseudonymous Twitter user TechDev, who posted the following chart comparing 2016 to the current price action. BTC/USD 1-week chart. Source: TwitterTechDev said, “Primary idea for Ethereum (and alts in general). Imagine how bearish things looked in 2016, even printing a macro lower low…”A similar observation was made by Ali_charts, who posted the following chart and stated “check out how similar the consolidation phase that Ether saw between March 2016 and January 2017 looks to the price action that Ether is currently going through.”ETH/USD 1-week chart. Source: TwitterShould the pattern projected by both TechDev and Ali_Charts play out, the price of Ether could reach as high as $28,000 during the next major bull wave. The overall cryptocurrency market cap now stands at $1.864 trillion and Bitcoin’s dominance rate is 43.1%.The views and opinions expressed here are solely those of the author and do not necessarily reflect the views of Cointelegraph.com. Every investment and trading move involves risk, you should conduct your own research when making a decision.

Čítaj viac

Analysts say bulls will aim for $48K now that Bitcoin’s ‘accumulation phase’ has begun

Investor sentiment across the cryptocurrency ecosystem has seen a significant shift in the positive direction over the past week, despite events in the wider world. Currently, Bitcoin (BTC) is back above $43,500 and many altcoins are also witnessing double-digit gains.Crypto Fear & Greed index. Source: AlternativeThe ongoing conflict in Ukraine and recent actions taken by governments to limit access to banking services may have helped to shine a light on the value of holding cryptocurrencies, which offers some protection against uncontrollable events and what some might perceive as government overreach. Data from Cointelegraph Markets Pro and TradingView shows that the price of BTC has oscillated between $43,350 and $45,400 on March 2 as the world awaits some form of resolution to the current conflicts. BTC/USDT 1-day chart. Source: TradingViewHere’s what several analysts are saying about the recent price action for BTC and where it could be headed in the weeks ahead. Bitcoin accumulation has begunThe sideways price action for Bitcoin has been largely influenced by the fact that the top cryptocurrency “has entered a volume gap” according to crypto analyst and pseudonymous Twitter user Rekt Capital, who posted the following chart highlighting the lower demand in the current price range. BTC/USD 1-week chart. Source: TwitterRekt Capital said, “Volume Gaps tend to get filled entirely. Major Volume Gap resistance lies ahead at the ~$48,000 region, which happens to be the mid-range area of the macro range.”Evidence that the price is likely to head higher was provided by Ki Young Ju, CEO of the on-chain analysis firm CryptoQuant. According to Ki, the “BTC accumulation phase” has begun. Bitcoin UTXO age bands. Source: TwitterAccording to Ki, “newbies who joined last year are evolving to long-term holders” as the market cap for Bitcoins that are older than six months now accounts for 52% of the total market cap of BTC as opposed to 13% at the recent cyclic top.He said, “Unlikely to hit the previous low ($28,000) as the newbies will wait for other newbies in the next cycle.”Rate hikes could be the next major catalystA more in-depth analysis of the effect of current events on the cryptocurrency market was offered by David Lifchitz, managing partner and chief investment officer at ExoAlpha, who noted the hard bounce in BTC from $37,000 to $44,000 “in the couple of hours following Russian President Vladimir Putin’s announcement of a national ban on foreign FX transfers.” The rapid move upwards “stalled at $44,000, which coincided with the 100-day moving average,” according to Lifchitz, which is “also near the top of the $33,000-$45,000 range in which Bitcoin has been trading in for weeks. Lifchitz sees the $45,000 resistance as holding firm for now and highlighted the “next hurdle” at $51,000 that still stands in the way before BTC can even attempt to make a run at its all-time high above $64,000. As for what comes next for BTC in the short term, Lifchitz suggested that “BTC may go down a bit toward the middle of its $33,000–$45,000 range” and noted that “it’s difficult to see BTC breaking above $45,000 and then $51,000 without any significant catalyst.” Lifchitz said, “There’s the FOMC meeting on March 16th where the FED decides if it hikes rates or not. Technically a rate hike “strengthens” the USD and therefore “weakens” BTC in the BTC/USD pair, so it will be interesting to see how BTC reacts then if the FED hikes rates in 2 weeks, but the impact on BTC may not be drastic.”Related: Bitcoin bulls aim to solidify control over BTC price by flipping $44K to supportVertical accumulation is a “possibility”A final bit of insight into BTC’s historical performance was provided by analyst and pseudonymous Twitter user Altcoin Sherpa, who posted the following chart showing that the current range has been a significant support and resistance zone since last May. BTC/USD 1-day chart. Source: TwitterAltcoin Sherpa said, “Watching $40,000 to see if we get a pullback. If this is like September then we’ll see vertical accumulation and Bitcoin is not going to dip (unless on low time frames) much at all for a bit. I’m guessing I won’t get this in the short term.”The overall cryptocurrency market cap now stands at $1.924 trillion and Bitcoin’s dominance rate is 43.2%.The views and opinions expressed here are solely those of the author and do not necessarily reflect the views of Cointelegraph.com. Every investment and trading move involves risk, you should conduct your own research when making a decision.

Čítaj viac

Bitcoin paints a clear ‘double bottom’ but ailing momentum could force a $34K retest

Bullish optimism returned to the cryptocurrency market on March 1after a majority of tokens turned green and Bitcoin bulls telegraphed their intention to hold the $40,000 level as support going forward.Data from Cointelegraph Markets Pro and TradingView shows that the price of Bitcoin (BTC) has surged 20% from a low of $37,409 on Feb. 28 to an intraday high at $44,951 on Tuesday. BTC/USDT 4-hour chart. Source: TradingViewHere’s what several analysts are saying about the sudden bullish reversal in Bitcoin price and what crypto traders can expect moving forward during this time of increased global tensions. A revisit to $34,000 is “not out of the question”Prior to Tuesday’s price surge, BTC sellers were firmly in control of the market according to a report from Delphi Digital, which posted the following chart and noted that “in the wake of recent events that have unfolded, being cautious over the last two weeks has indeed proved to be the correct course of action.”BTC/USD 6-hour chart. Source: Delphi DigitalAccording to Delphi Digital, the major lower support level to keep an eye on is $34,000 based on the amount of support seen there back in January when a hawkish Fed caused markets to tumble “before staging an impressive rally.” Delphi Digital said, “Since then, price has failed to sustain momentum and returned to this $34,000 region as Russia announced its invasion of Ukraine. Price has since bounced to $38,000 at the time of writing, but a revisit of the $34,000 support level is certainly not out of the question just yet.”Hodlers are hopefulA more bullish projection was offered by on-chain analysis firm Glassnode, which noted that “despite a 50%+ correction” since the highs in November, a majority of the buyers that had entered the market throughout the August to November rally “have not liquidated their positions.”Bitcoin URPD on Feb. 27. Source: GlassnodeAccording to Glassnode’s analysis of the URPD metric, which shows the distribution of coin supply at the price it last moved on-chain, “the primary redistribution appears to be coming from investors who bought the $60,000+ range” and have recently been selling in the $35,000 to $38,000 price range. Glassnode said, “This spending behavior describes a market dominated by price insensitive HODLers, who appear unwilling to liquidate their coins, even if held at a loss. Meanwhile, top buyers have been significantly fleshed out, and represent a far smaller proportion of the investor cohort when compared to May-July 2021.”Related: 3 reasons why Bitcoin price rallied toward $45K entering MarchIs Bitcoin’s reversal official?A final bit of insight with a bullish bent was offered by options trader and pseudonymous Twitter user John Wick, who posted the following chart noting that “you can see we have a clear double bottom with a nice sign of strength.”BTC/USD 1-week chart. Source: TwitterJohn Wick said, “We also have a confirmed reversal. Stops should always be set under the signals wick. I would be surprised if this setup takes us over $60,000.”The overall cryptocurrency market cap now stands at $1.93 trillion and Bitcoin’s dominance rate is 43.2%.The views and opinions expressed here are solely those of the author and do not necessarily reflect the views of Cointelegraph.com. Every investment and trading move involves risk, you should conduct your own research when making a decision.

Čítaj viac

Rune’s upcoming mainnet launch and Terra (LUNA) integration set off a 74% rally

2021 was a roller coaster of a year for THORChain (RUNE), which saw its price top out at $20.31 only to come crashing down below $4 as a series of hacks and declining interest in decentralized finance had the token limping into 2022.Data suggests that investors could be taking a closer look at Rune and a few potentially bullish factors could include the protocol’s recent integration with the Terra and Cosmos ecosystem, an upcoming mainnet launch and the attractive yields offered to liquidity providers.RUNE/USDT 4-hour chart. Source: TradingViewData from Cointelegraph Markets Pro and TradingView shows that after hitting a low of $3.00 on Feb. 24, the price of RUNE has rallied 74.2% to a daily high at $5.23 on March 1 amid a 388% surge in its 24-hour trading volume.Rune integrates with TerraOne development that has excited the RUNE community is the integration of Terra (LUNA) into the THORChain protocol. This integration also enables the platform to support all Cosmos-based projects. To clear up any uncertainty: The Terra integration is complete. We’re now working with @TerraSCV to review the integration before pushing things. Once we receive the green light and handle any comments, $UST and $LUNA will be live on @THORChain. https://t.co/DsTw1qbUDV— Nine Realms (@ninerealms_cap) March 1, 2022Terra integration brings LUNA token, along with the TerraUSD (UST) stablecoin to the THORChain ecosystem and gives users more trading and staking options.THORChain now supports six wallet types and eight blockchains on its THORSwap cross-chain decentralized exchange. THORChain is also in the process of adding support for Haven and Monero. Wallets and blockchains supported by THORSwap. Source: TwitterAs part of the rollout for Terra and the Cosmos SDK, THORChain will be updated via a hard fork, which will be fully tested in the testnet and followed by further testing in Stagenet after the Terra launch and on ChaosNet before the mainnet launch. Bulls anticipate the next mainnet launchA second reason for the increased attention to RUNE could be the upcoming mainnet launch on THORChain. This event has been highly anticipated since late 2021 when the launch was originally planned but delayed due to a variety of factors.With Mainnet on the horizon, there will be push towards greater integration. https://t.co/gWIXVHC5FK will allow this. Watch this space. Watch the integration grow!$RUNE #LUNAISCOMING— THORChain #LUNAISCOMING (@THORChain) February 28, 2022

The specific date for the mainnet launch has yet to be disclosed, but there is no shortage of interest from community members who have remained loyal throughout the struggles and hacks over the past year. The requirements for mainnet launch are meeting all testnet goals, which includes the rehearsal of adding and removing chains, removing Bitcoin (BTC) and Litecoin (LTC) from the testnet, and several test runs with forking the chain. Related: THORSwap hammers home the point: Aligned incentives are a crypto superpowerHigh staking yields attract new depositsA third factor helping to attract users and liquidity to THORChain is the high yields offered to liquidity providers on the protocol. APRs offered on THORSwap. Source: THORSwapSome of the highest yields offered include 55% for Binance USD (BUSD) and 30% for the DAI stablecoin. LTC deposits earn 26% and Dogecoin (DOGE) is set at 24%. VORTECS™ data from Cointelegraph Markets Pro began to detect a bullish outlook for RUNE prior to the recent price rise. The VORTECS™ Score, exclusive to Cointelegraph, is an algorithmic comparison of historical and current market conditions derived from a combination of data points including market sentiment, trading volume, recent price movements and Twitter activity.VORTECS™ Score (green) vs. RUNE price. Source: Cointelegraph Markets ProAs seen in the chart above, the VORTECS™ Score for RUNE spiked to a high of 78 on Feb. 25, around 57 hours before the price began to increase 55% over the next two days. The views and opinions expressed here are solely those of the author and do not necessarily reflect the views of Cointelegraph.com. Every investment and trading move involves risk, you should conduct your own research when making a decision.

Čítaj viac

Získaj BONUS 8 € v Bitcoinoch

nakup bitcoin z karty

Registrácia Binance

Burza Binance

Aktuálne kurzy